SpeedCurve is now part of the Embrace family! There are no changes to how you use our products. Our founder Mark shares what this means...
NEW! A better way to manage performance budgets in SpeedCurve

We've made a major update to how you create, manage, and monitor performance budgets in SpeedCurve – and we think you're going to love it.
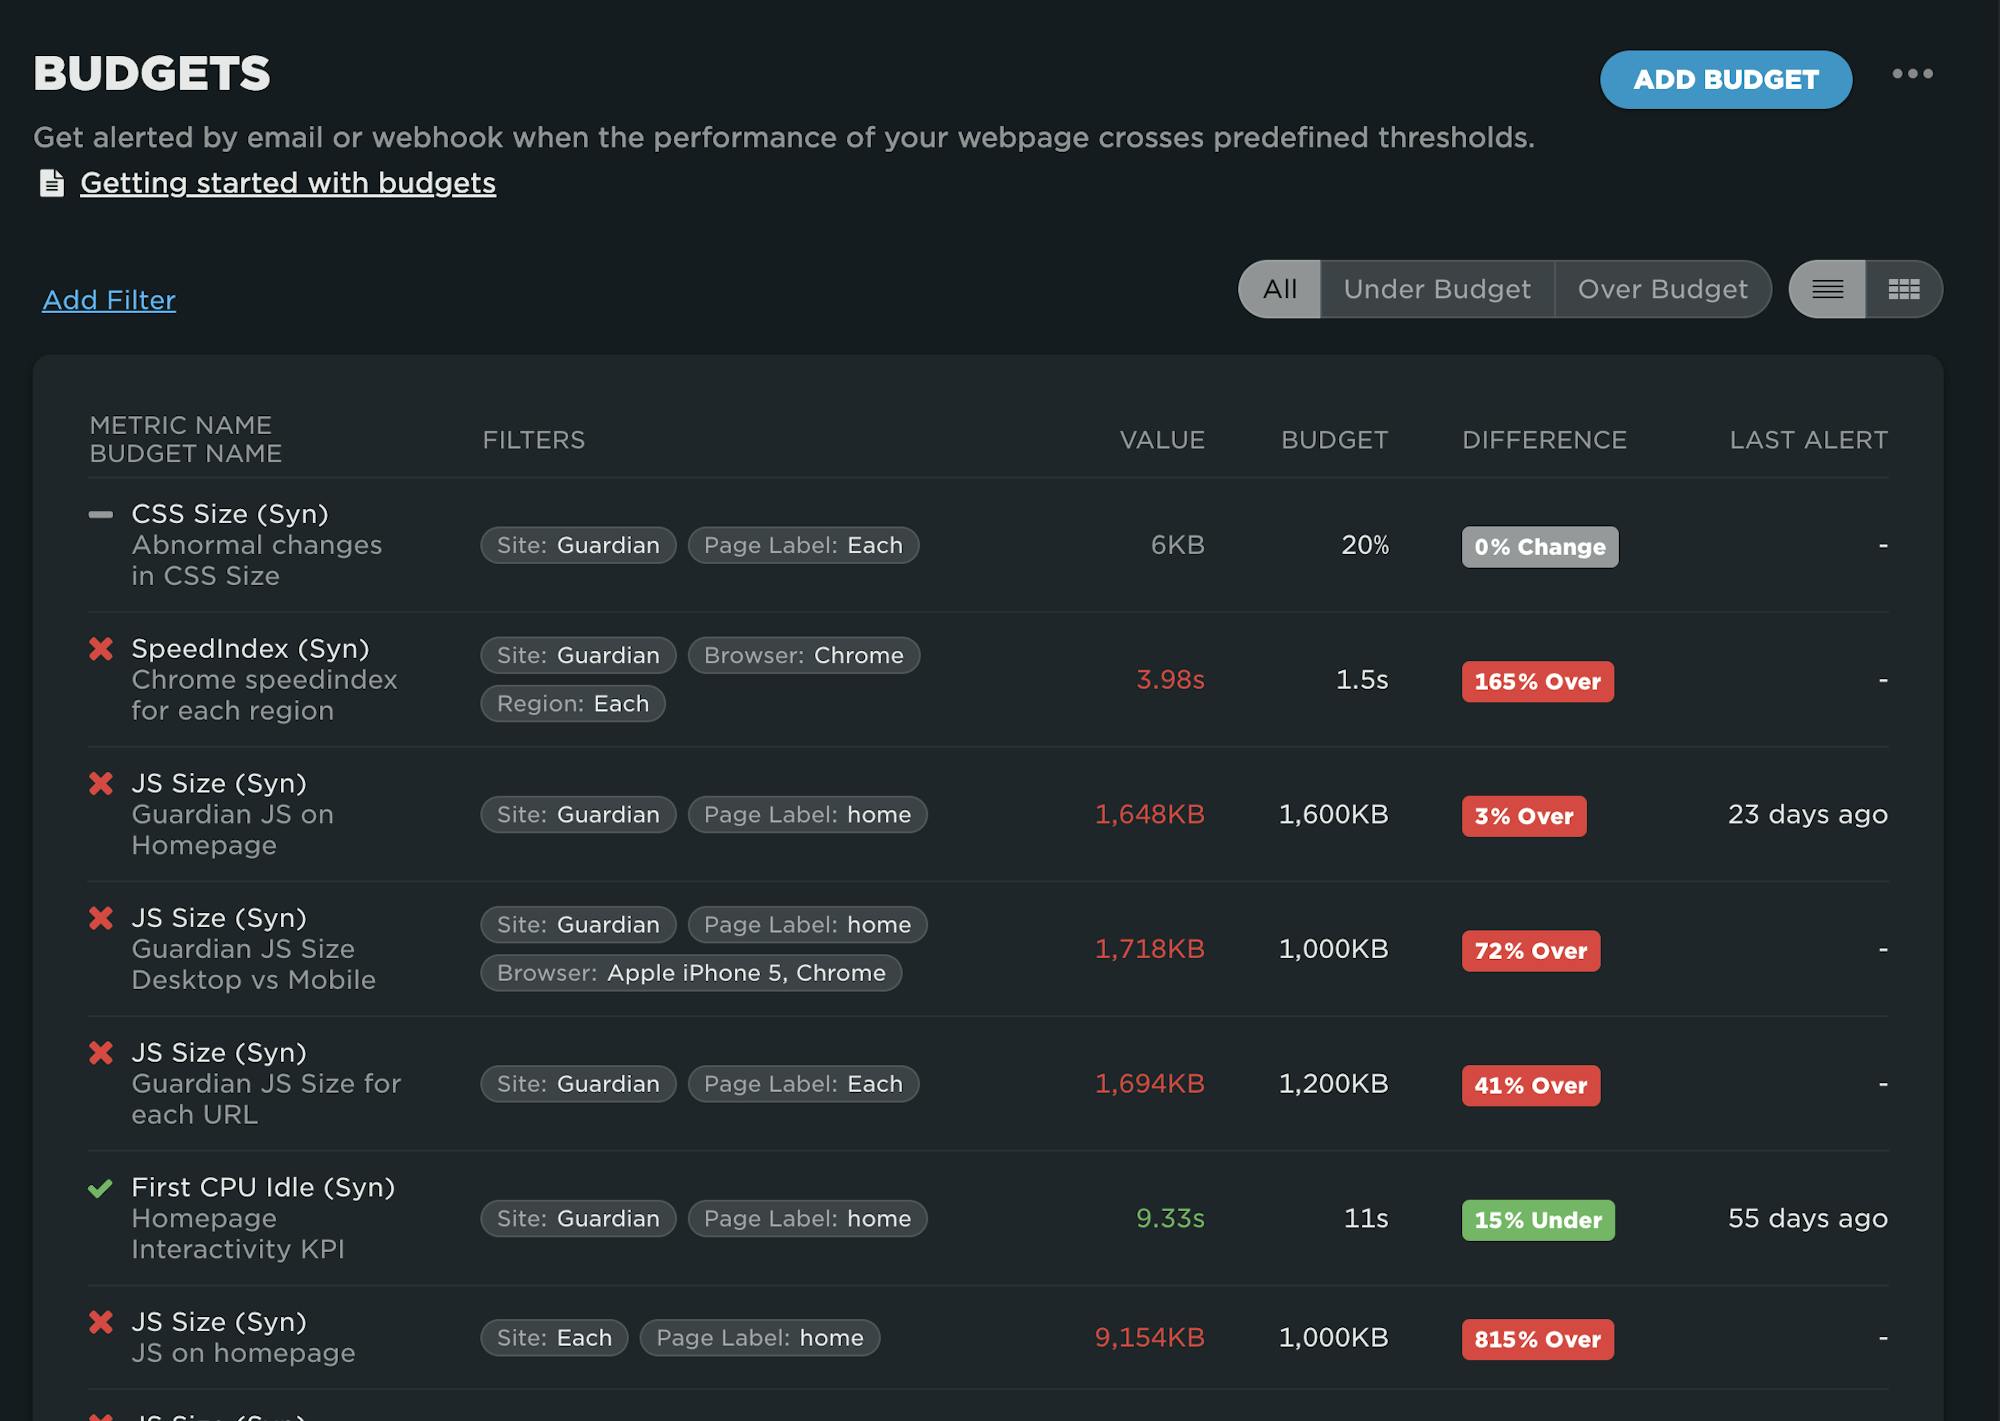
Until now, performance budgets lived inside your Favorites dashboards. That worked well for surfacing budget charts in context with the rest of your performance data, but it made managing budgets frustrating because they were spread all over your Favorites dashboards.
To fix this issue, we've moved performance budget management into its own dedicated Budgets dashboard. This change unlocks powerful new capabilities and makes tracking your performance thresholds and goals easier and more intuitive than ever.
Our 10 most popular web performance articles of 2024

We love writing articles and blog posts that help folks solve real web performance and UX problems. Here are the ones you loved most in 2024. (The number one item may surprise you!)

Some of these articles come from our recently published Web Performance Guide – a collection of evergreen how-to resources (written by actual humans!) that will help you master website monitoring, analytics, and diagnostics. The rest come from this blog, where we tend to publish industry news and analysis.
Regardless of the source, we hope you find these pieces useful!
A Complete Guide to Web Performance Budgets
It's easier to make a fast website than it is to keep a website fast. If you've invested countless hours in speeding up your site, but you're not using performance budgets to prevent regressions, you could be at risk of wasting all your efforts.
In this post we'll cover how to:
- Use performance budgets to fight regressions
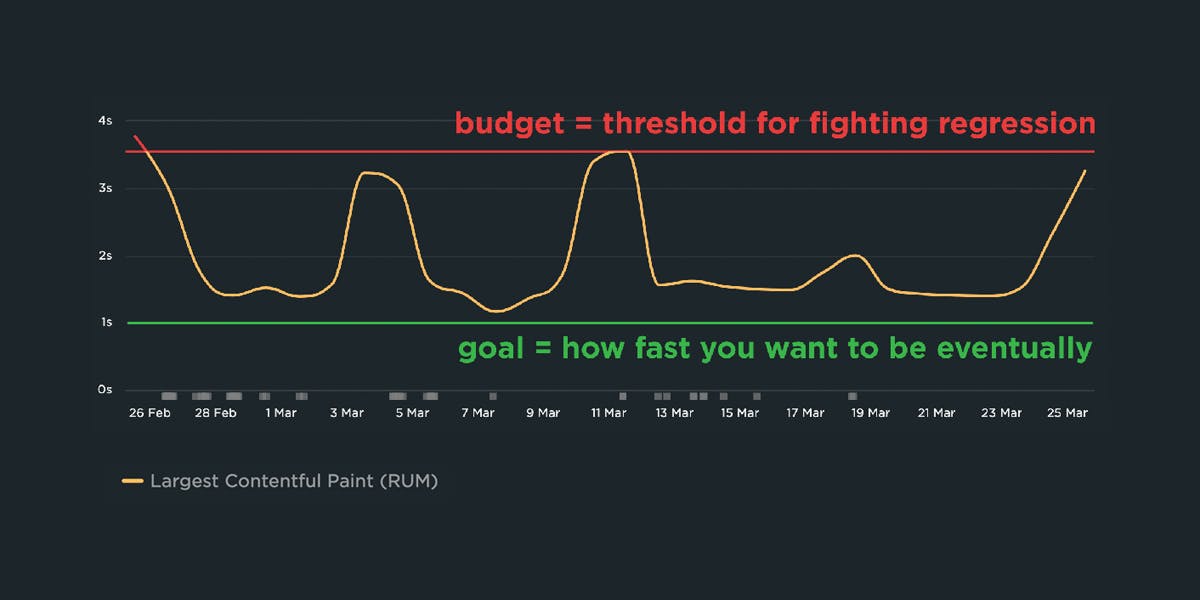
- Understand the difference between performance budgets and performance goals
- Identify which metrics to track
- Validate your metrics to make sure they're measuring what you think they are – and to see how they correlate with your user experience and business metrics
- Determine what your budget thresholds should be
- Focus on the pages that matter most
- Get buy-in from different stakeholders in your organization
- Integrate with your CI/CD process
- Synthesize your synthetic and real user monitoring data
- Maintain your budgets
This bottom of this post also contains a collection of case studies from companies that are using performance budgets to stay fast.
Let's get started!
Continuous performance with guardrails and breadcrumbs


The hardest part about web performance isn’t making your site faster – it’s keeping it that fast. Hearing about a company that devoted significant effort into optimizing their site, only to find their performance right back where it started a few months later, is all too familiar.
The reality is that, as critical as site speed is, it’s also very easy to overlook. It doesn’t jump out like a blurry image or a layout issue. And the majority of modern tools and frameworks that are used to build sites today make it all too easy to compound the issue.
Making performance more visible throughout the development process is one of the most critical things a company can do.
I like to think of it as setting up guardrails and breadcrumbs.
- We need guardrails to help protect us from shipping code that will result in unexpected regressions.
- We need breadcrumbs that we can follow back to the source to help us identify why a metric may have changed.
Guardrails and breadcrumbs need to work together. Setting up guardrails without the ability to dive in more will lead to frustration. Having proper breadcrumbs without guardrails in place all but assures we will constantly be fighting regressions after they’ve already wreaked havoc on our sites and our users.
Let’s take a look at both of these concepts and how they should work together.
How to automatically test the performance of your GitHub pull requests


As highlighted in our December product update, we've been making a lot of improvements in the area of CI/CD. In addition to the new Deployments dashboards and Notes updates, we've launched a new GitHub integration. Our purpose in building this integration is to lower the barrier for getting web performance feedback for your code changes, directly in the environment you are working in.
Follow along below for an example of how you can use this integration in practice to fight web performance regressions and keep your pages fast.
10 things I love about SpeedCurve (that I think you'll love, too)

This month, SpeedCurve enters double digits with our tenth birthday. We're officially in our tweens! (Cue the mood swings?)
I joined the team in early 2017, and I'm blown away at how quickly the years have flown by. Every day, I marvel at my great luck in getting to work alongside an amazing team to build amazing tools to help amazing people like you!
In the spirit of celebration, I thought it would be fun to round up my ten favourite things to do in SpeedCurve (that I think you'll like, too). Keep scrolling to learn how to:
- Fight regressions and stay fast
- See the impact of performance on your business
- Benchmark your site against your competitors
- Track third parties to make sure they're not quietly hurting performance
- Make sure you're tracking the best metrics for your pages
- Get a prioritized list of performance recommendations
- Bookmark and compare synthetic tests and RUM sessions so you can quickly find and fix performance issues
- Run A/B tests so you see how code changes affect your performance and user engagement metrics
- Get customized weekly reports
- Motivate your team with a wall-mounted monitor showing your favourite charts
What is page bloat? And how is it hurting your business, your search rank, and your users?
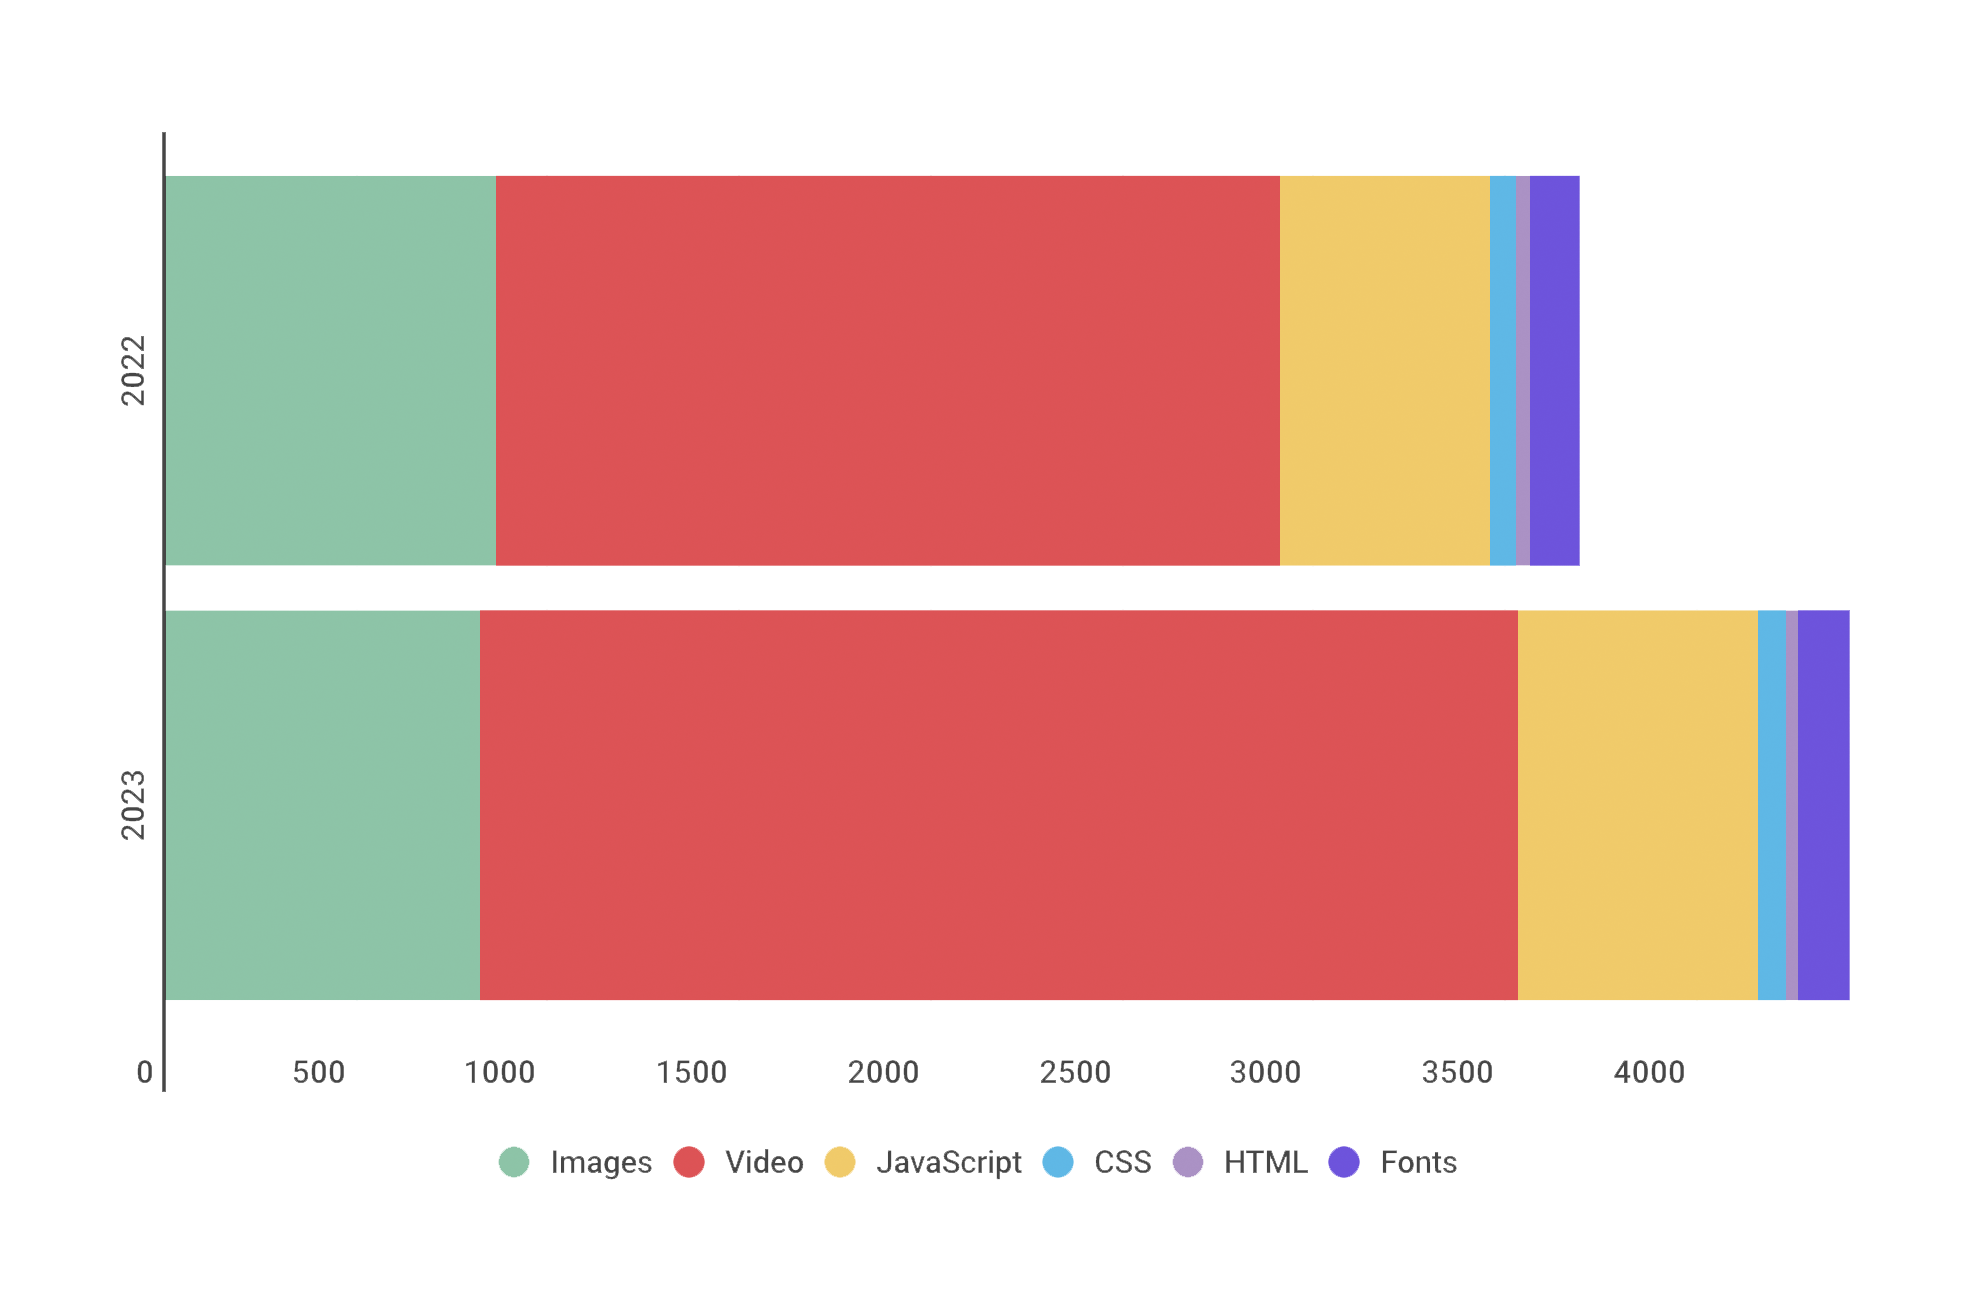
For more than ten years, I've been writing about page bloat, its impact on site speed, and ultimately how it affects your users and your business. You might think that this topic would be played out by now, but every year I learn new things – beyond the overarching fact that pages keep getting bigger and more complex, as you can see in this chart, using data from the HTTP Archive.
In this post, we'll cover:
- How much pages have grown over the past year
- How page bloat hurts your business and – at the heart of everything – your users
- How page bloat affects Google's Core Web Vitals (and therefore SEO)
- If it's possible to have large pages that still deliver a good user experience
- Page size targets
- How to track page size and complexity
- How to fight regressions
Ten years of page bloat: What have we learned?

(See our more recent page growth post: What is page bloat? And how is it hurting your business, search rank, and users?)
I've been writing about page size and complexity for years. If you've been working in the performance space for a while and you hear me start to talk about page growth, I'd forgive you if you started running away. ;)
But pages keep getting bigger and more complex year over year – and this increasing size and complexity is not fully mitigated by faster devices and networks, or by our hard-working browsers. Clearly we need to keep talking about it. We need to understand how ever-growing pages work against us. And we need to have strategies in place to understand and manage our pages.
In this post, we'll cover:
- How big are pages today versus ten years ago?
- How does page bloat hurt your business?
- How does page bloat affect other metrics, such as Google's Core Web Vitals?
- Is it possible to have large pages that deliver a good user experience?
- What can we do to manage our pages and fight regression?
SEO and web performance: What to measure and how to optimize
Chances are, you're here because of Google's update to its search algorithm, which affects both desktop and mobile, and which includes Core Web Vitals as a ranking factor. You may also be here because you've heard about the most recent potential candidates for addition to Core Web Vitals, which were just announced at Chrome Dev Summit.
A few things are clear:
- Core Web Vitals, as a premise, are here to stay for a while.
- The metrics that comprise Web Vitals are still evolving.
- These metrics will (I think) always be in a state of evolution. That's a good thing. We need to do our best to stay up to date – not just with which metrics to track, but also with what they measure and why they're important.
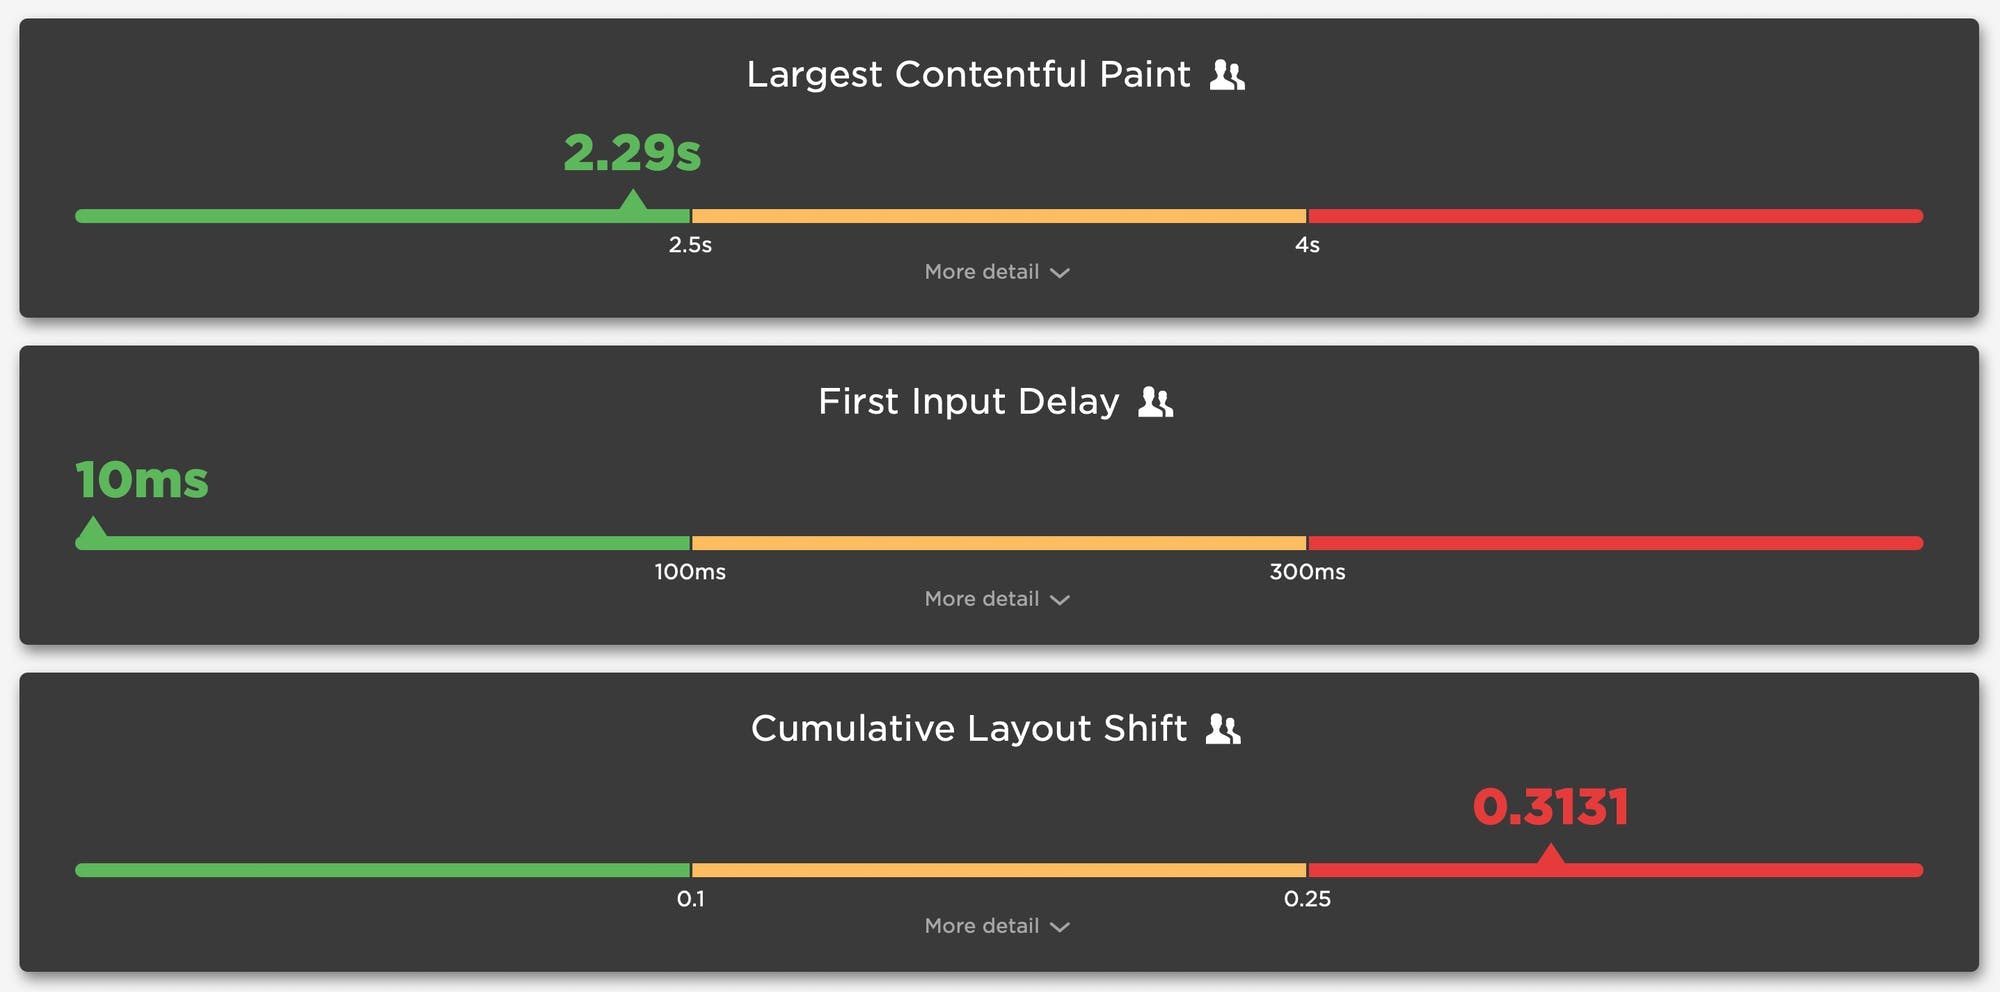
If you're new to Core Web Vitals, this is a Google initiative that was launched in early 2020. Web Vitals is (currently) a set of three metrics – Largest Contentful Paint, First Input Delay, and Cumulative Layout Shift – that are intended to measure the loading, interactivity, and visual stability of a page.
When Google talks, people listen. I talk with a lot of companies and I can attest that, since Web Vitals were announced, they've shot to the top of many people's list of things to care about. But Google's prioritization of page speed in search ranking isn't new, even for mobile. As far back as 2013, Google announced that pages that load slowly on mobile devices would be penalized in mobile search.
Keep reading to find out:
- How much does web performance matter when it comes to SEO?
- Which performance metrics should you focus on for SEO?
- What can you do to make your pages faster for SEO purposes?
- What are some of the common issues that can hurt your Web Vitals?
- How can you track performance for SEO?
Web Performance for Product Managers

I love conversations about performance, and I'm fortunate enough to have them a lot. The audience varies. A lot of the time it’s a front-end developer or head of engineering, but more and more I’m finding myself in great conversations with product leaders. As great as these discussions can be, I often walk away feeling like there was a better way to streamline the conversation while still conveying my passion for bringing fellow PMs into the world of webperf. I hope this post can serve that purpose and cover a few of the fundamental areas of web performance that I’ve found to be most useful while honing the craft of product management.
So, whether you are a PM or not, if you're new to performance I've put together a few concepts and guidelines you can refer to in order to ramp up quickly. This post covers:
- What makes a page slow?
- How is performance measured?
- What do the different metrics mean?
- Understanding percentiles and how to use them
- How to communicate performance to different stakeholders
Let's get started...
An Opinionated Guide to Performance Budgets
Performance budgets are one of those ideas that everyone gets behind conceptually, but then are challenged to put into practice – and for very good reason. Web pages are unbelievably complex, and there are hundreds of different metrics available to track. If you're just getting started with performance budgets – or if you've been using them for a while and want to validate your work – this post is for you.
What is a performance budget?
A performance budget is a threshold that you apply to the metrics you care about the most. You can then configure your monitoring tools to send you alerts – or even break the build, if you're testing in your staging environment – when your budgets are violated.
Understanding the basic premise of performance budgets is pretty easy. The tricky part comes when you try to put them into practice. This is when you run into three important questions:
- Which metrics should you focus on?
- What should your budget thresholds be?
- How do you stay on top of your budgets?
Depending on whom you ask, you could get very different answers to these questions. Here are mine.
New! Tracking first- and third-party request groups
Getting visibility into the impact that known third parties have on the user experience has long been a focus in our community. There are some great tools out there – like 3rdParty.io from Nic Jansma and Request Map from Simon Hearne – which give us important insight into the complexity involved in tracking third-party content.
When we released our re-imagined Third Party Dashboard last year, we were excited to be providing site owners with another great tool for managing the unmanageable. Among other things, we took an approach that included:
- grouping requests,
- exposing Long Tasks attributed to third parties, and
- tracking blocking CPU time.
This provided even more insight into the different ways JavaScript could be causing real headaches for users.
We received a lot of feedback from our customers, who loved the new third-party functionality but REALLY wanted to see similar functionality for their "first party" content as well. We heard this message loud and clear, and today we're happy to announce a few changes to our Synthetic monitoring tool that address this need while preserving the functionality you already know and love.
Six web performance resolutions for the new year

For the past two years, the performance.now() conference has been the most valuable performance event I've attended. So valuable, in fact, that I've made some of the talks the cornerstone of this list of performance resolutions for 2020. I'd love to know how many – if any – of these are on your list. As always, I'd love people's feedback!
Getting started with web performance? Here's what you need to focus on.
A while back, our friends at Shopify published this great case study, showing how they optimized one of their newer themes from the ground up – and how they worked to keep it fast. Inspired by that post, I wanted to dig a bit deeper into a few of the best practices they mentioned, which fall loosely into these three buckets:
- Analyze your pages – understand the critical rendering path and page composition.
- Create performance budgets and fight regression.
- Build a performance culture that embraces collaboration between design and dev.
Keep reading to learn how you can apply these best practices to your own site and give your pages a speed boost.
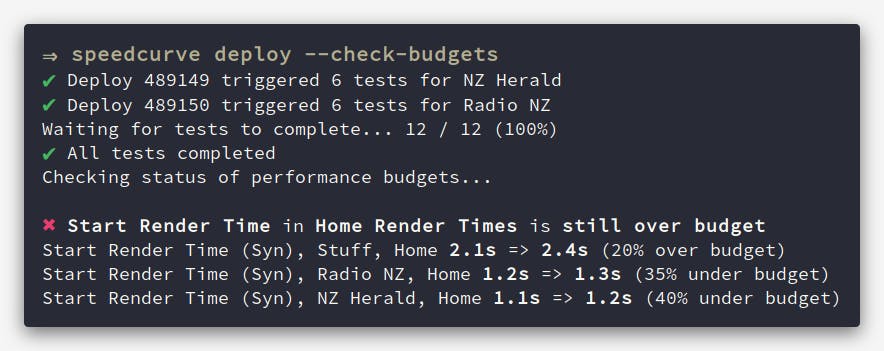
Performance testing in CI: Let's break the build!
Raise your hand if you've ever poured countless hours into making a fast website, only to have it slowly degrade over time. New features, tweaks, and Super Important Tracking Snippets all pile up and slow things down. At some point you'll be given permission to "focus on performance" and after many more hours, the website will be fast again. But a few months later, things start to slow again. The cycle repeats.
What if there was a way that you could prevent performance from degrading in the first place? Some sort of performance gateway that only allows changes to production code if they meet performance requirements? I think it's time we talked about having performance regressions break the build.
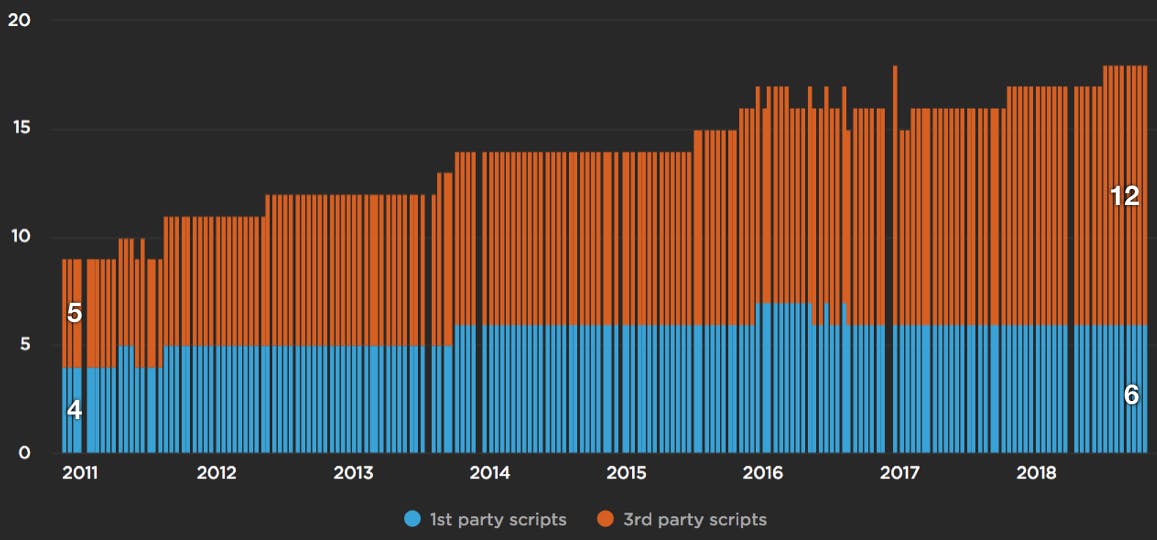
JavaScript growth and third parties

JavaScript is the main cause for making websites slow. Ten years ago it was network bottlenecks, but the growth of JavaScript has outpaced network and CPU improvements on today's devices. In the chart below, based on an analysis from the HTTP Archive, we see the number of requests has increased for both first and third party JavaScript since 2011.
Monitor performance budgets at a glance with your Status dashboard
This may sound counter-intuitive, but we don't want you to spend countless hours using SpeedCurve. In fact, our goal is to make your web performance data so accessible, understandable, and actionable that you can get everything you need from us in just a few minutes.
That's why we're so excited to announce the brand-new Status dashboard – a visualization that lets you see at a glance all your web performance budgets, as well as which budgets have been violated.
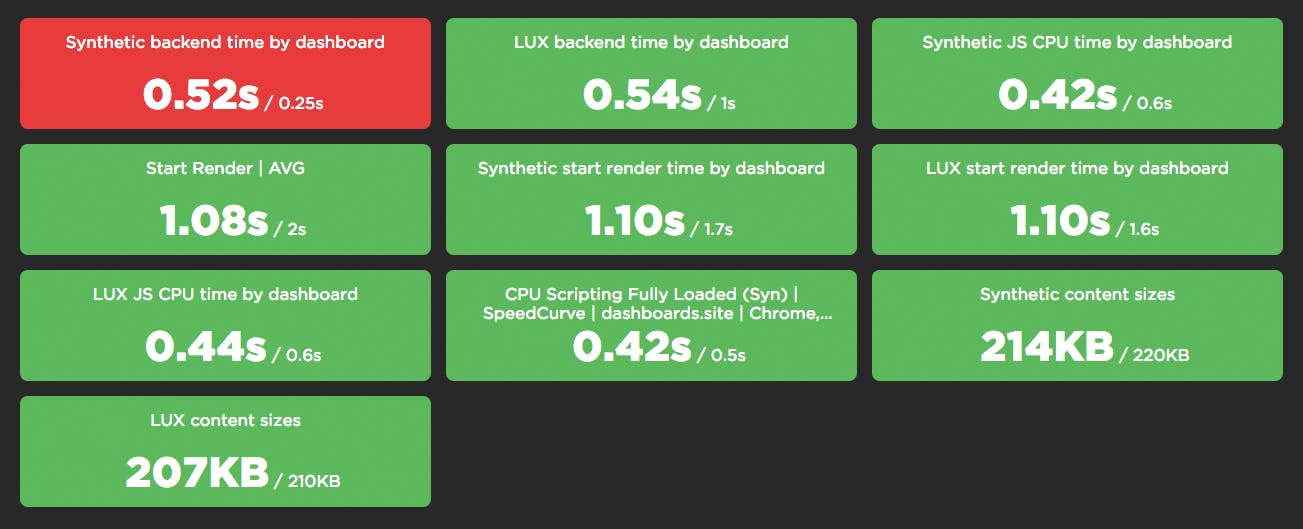
Keep reading to find out how to start using your Status dashboard to diagnose and fix your performance pains. But first, let's talk about why we built this feature.
SpeedCurve Consulting Services with Tim Kadlec

We're excited to announce that SpeedCurve is partnering with Tim Kadlec to provide consulting services to our customers!
Tim is a recognized expert when it comes to web performance. He has spoken at numerous conferences including Velocity, Fluent, QCon, SmashingConf, Beyond Tellerand, and WebStock. He wrote High Performance Images and Implementing Responsive Design, as well as contributing to other books. Mark, Tammy and I have each collaborated with Tim on side projects. We're full of gleeful anticipation as we look forward to this opportunity to work together again.
In the first sentence I mentioned that this is a partnership. Here's what that means: Tim will continue to do consulting outside of SpeedCurve, and if you're not a SpeedCurve customer we encourage you to contact him directly. Tim will also be running SpeedCurve's consulting services. This partnership brings special advantages to SpeedCurve customers:
Track down front-end CPU hogs

Often when monitoring and debugging site performance we focus on network activity and individual resources, but what about the CPU? As more and more sites switch to using large Javascript frameworks and manipulating the page using Javascript, the execution time this code takes and the available CPU can instead become the performance bottleneck.
CPU usage for all Chrome tests
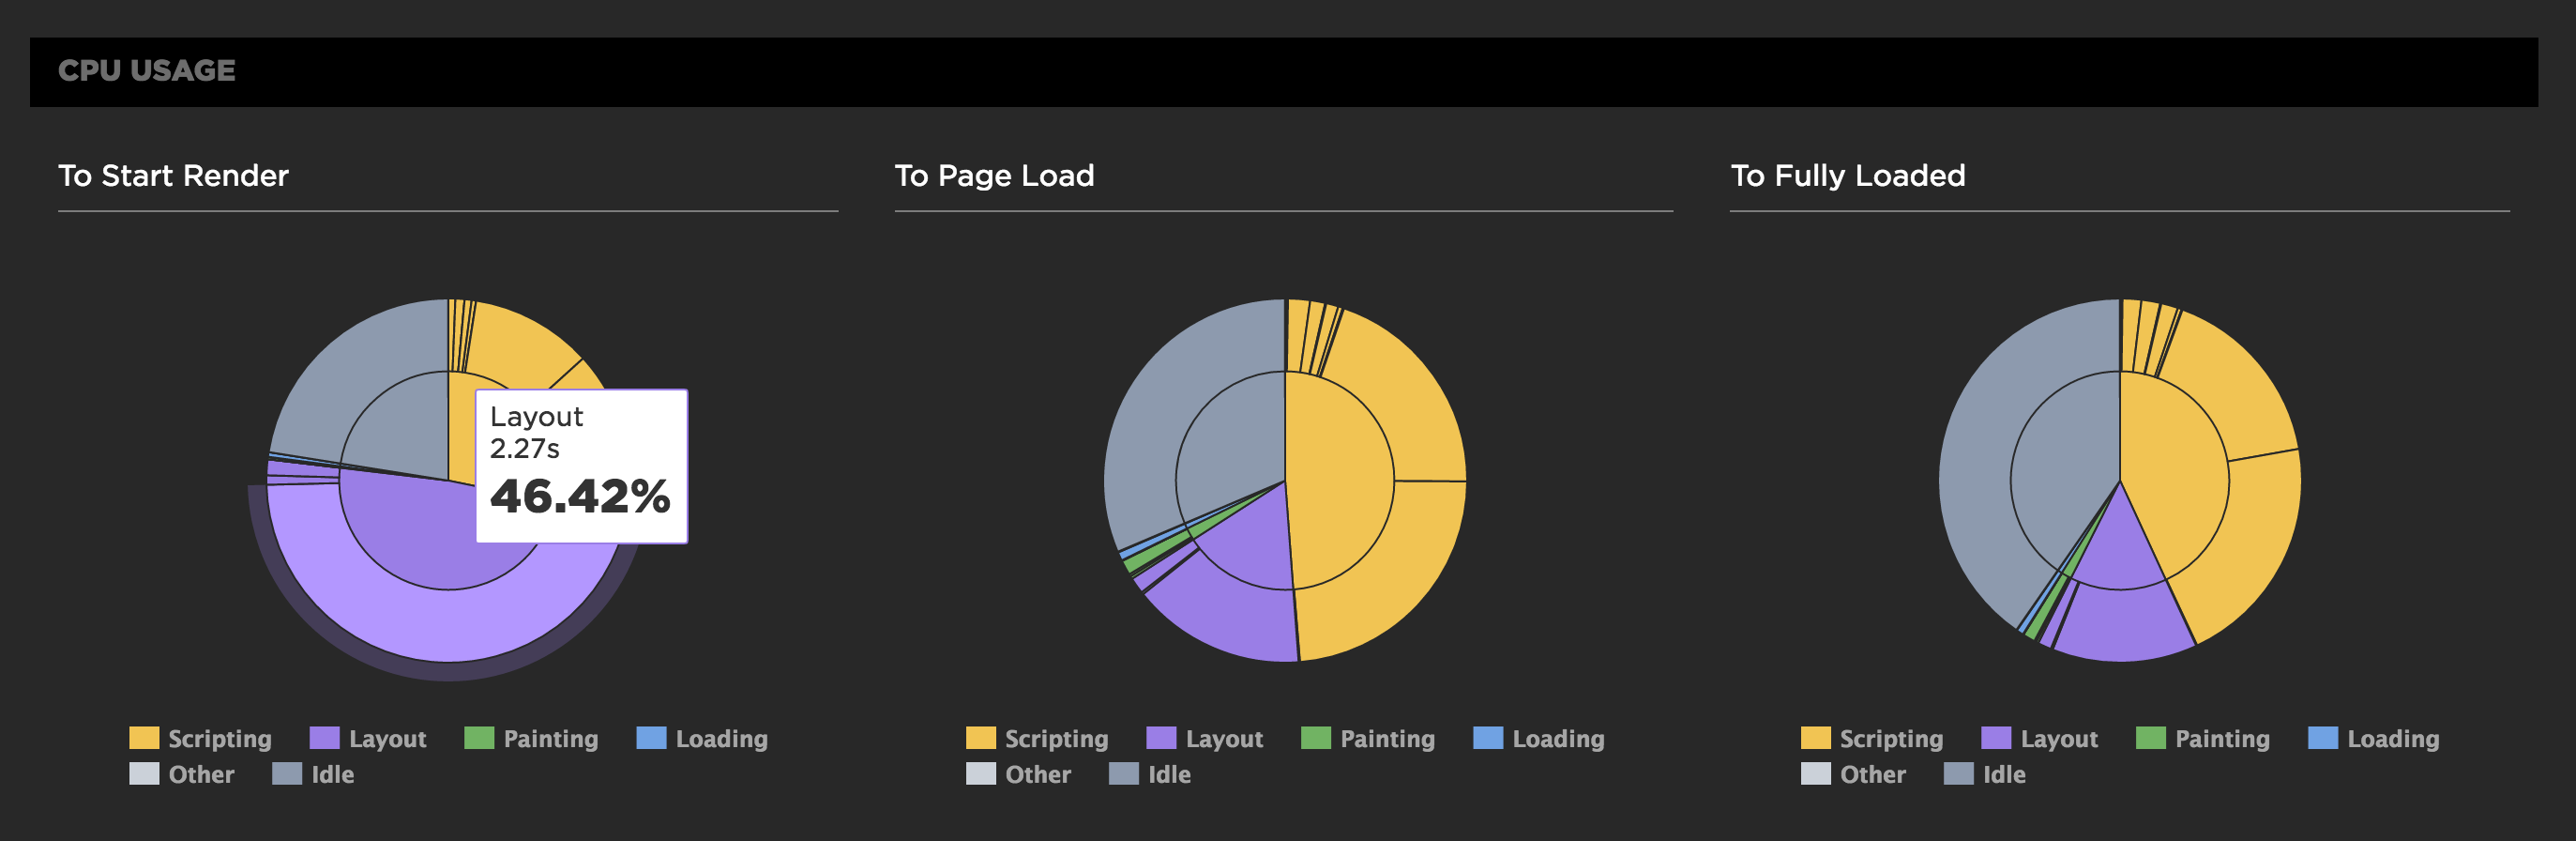
For any of SpeedCurve's Chrome-based tests, including emulated devices, we capture the Chrome Dev Tools timeline. From the browser main thread usage in the timeline we extract how busy the CPU is and what it's spending time on. Is it busy executing Javascript functions or busy laying out elements and painting pixels?
We also measure the CPU usage to different key events in the rendering of the page. SpeedCurve's focus is on the user experience and getting content in front of people as fast as possible, so we show you what the CPU is doing up till the page starts to render. This reflects CPU usage during the browser critical rendering path and can highlight various issues. If there's lots of CPU idle time then you're not delivering your resources efficiently. You want to get the CPU busy nice and early rendering the page, rather than sitting idle waiting for slow resources.
In the test below we see in the first pie chart that the CPU is spending a lot of time on layout up to the start render event, which is quite a different picture from the Fully Loaded CPU usage.
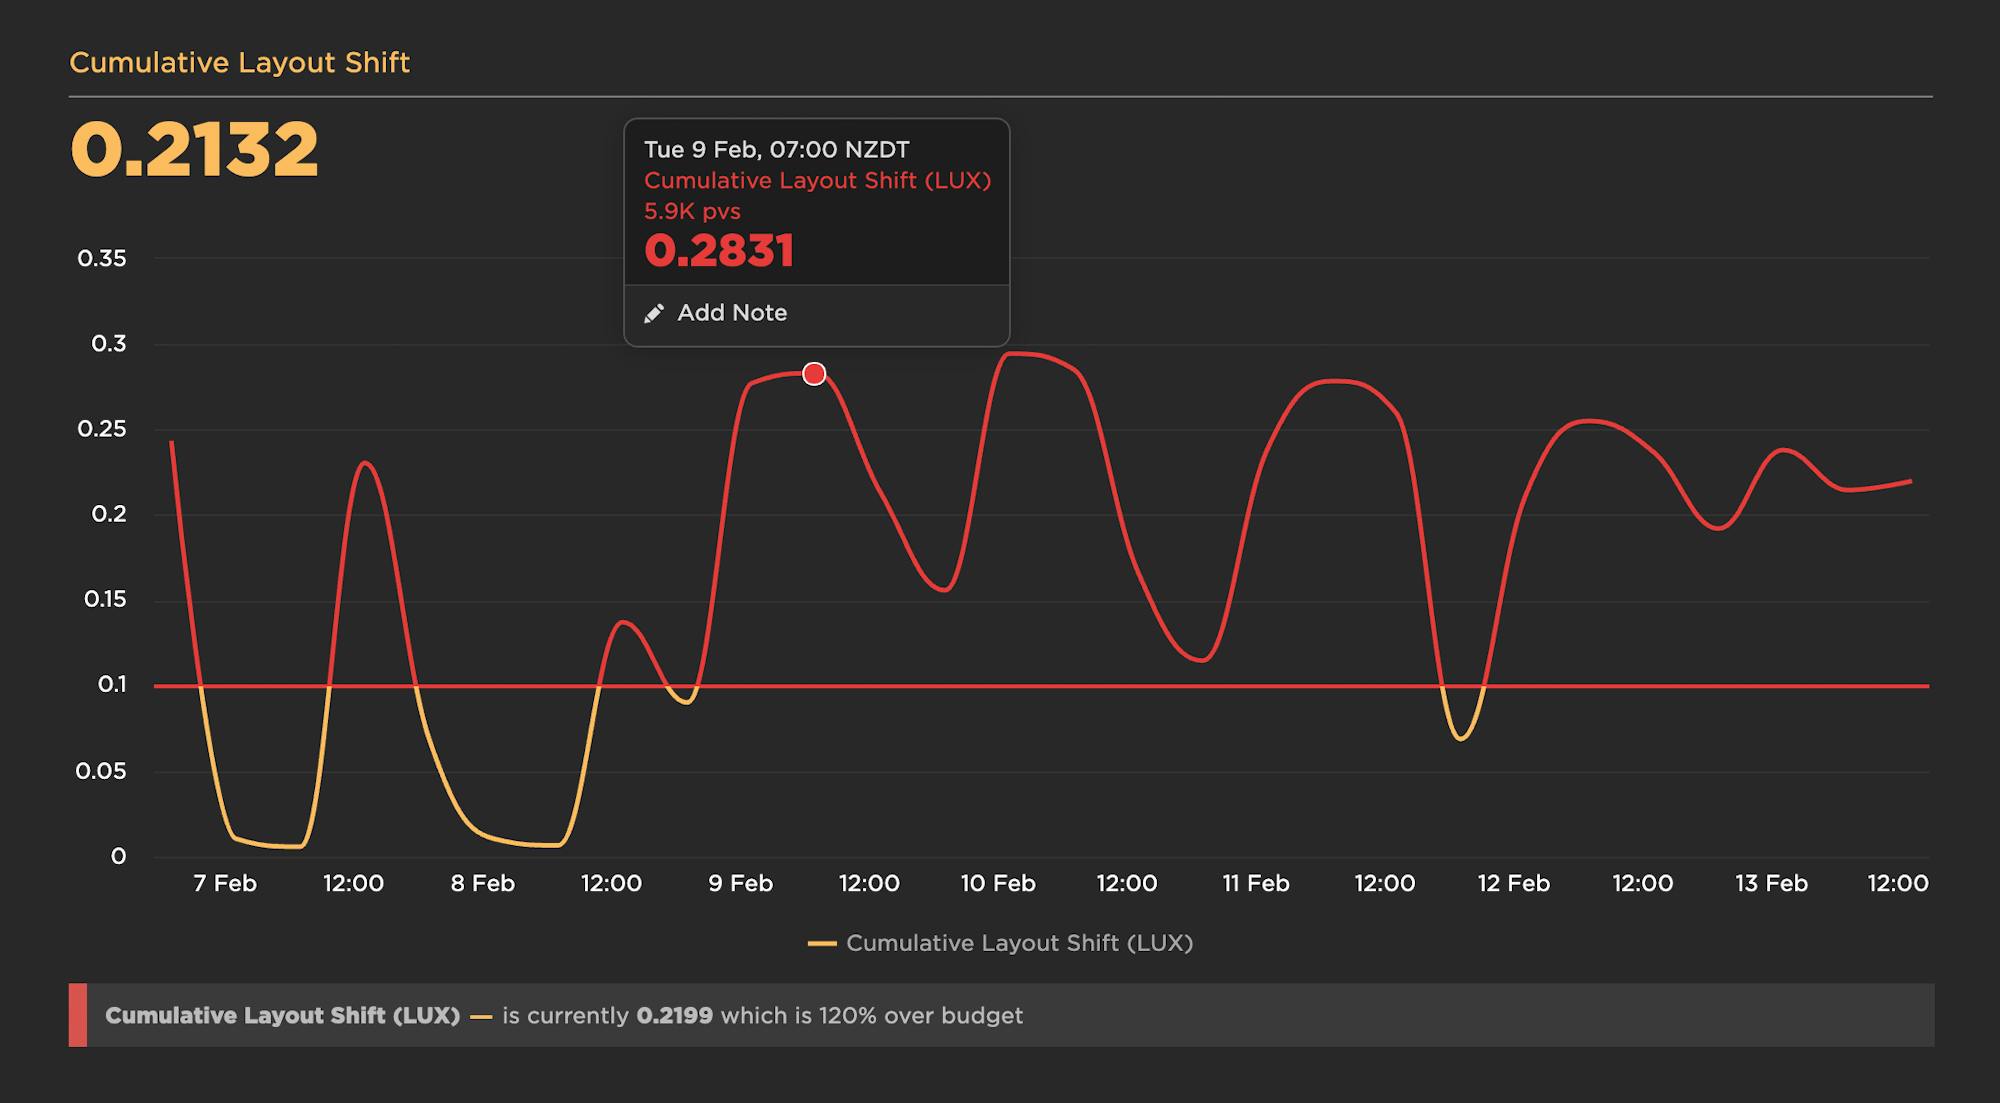
Performance budgets in action
Performance budgets are an important tool for ensuring your site is delivering a great user experience. Steve first experienced performance budgets while Head Performance Engineer at Google. The practice of using budgets to track performance took off with Tim Kadlec's blog post Setting a Performance Budget. The idea is to identify your performance goals and track the metrics that help you achieve your goals.
At SpeedCurve, we give performance budgets first-class status by tracking them in the Site dashboard. Here's an example of tracking a budget for image size.
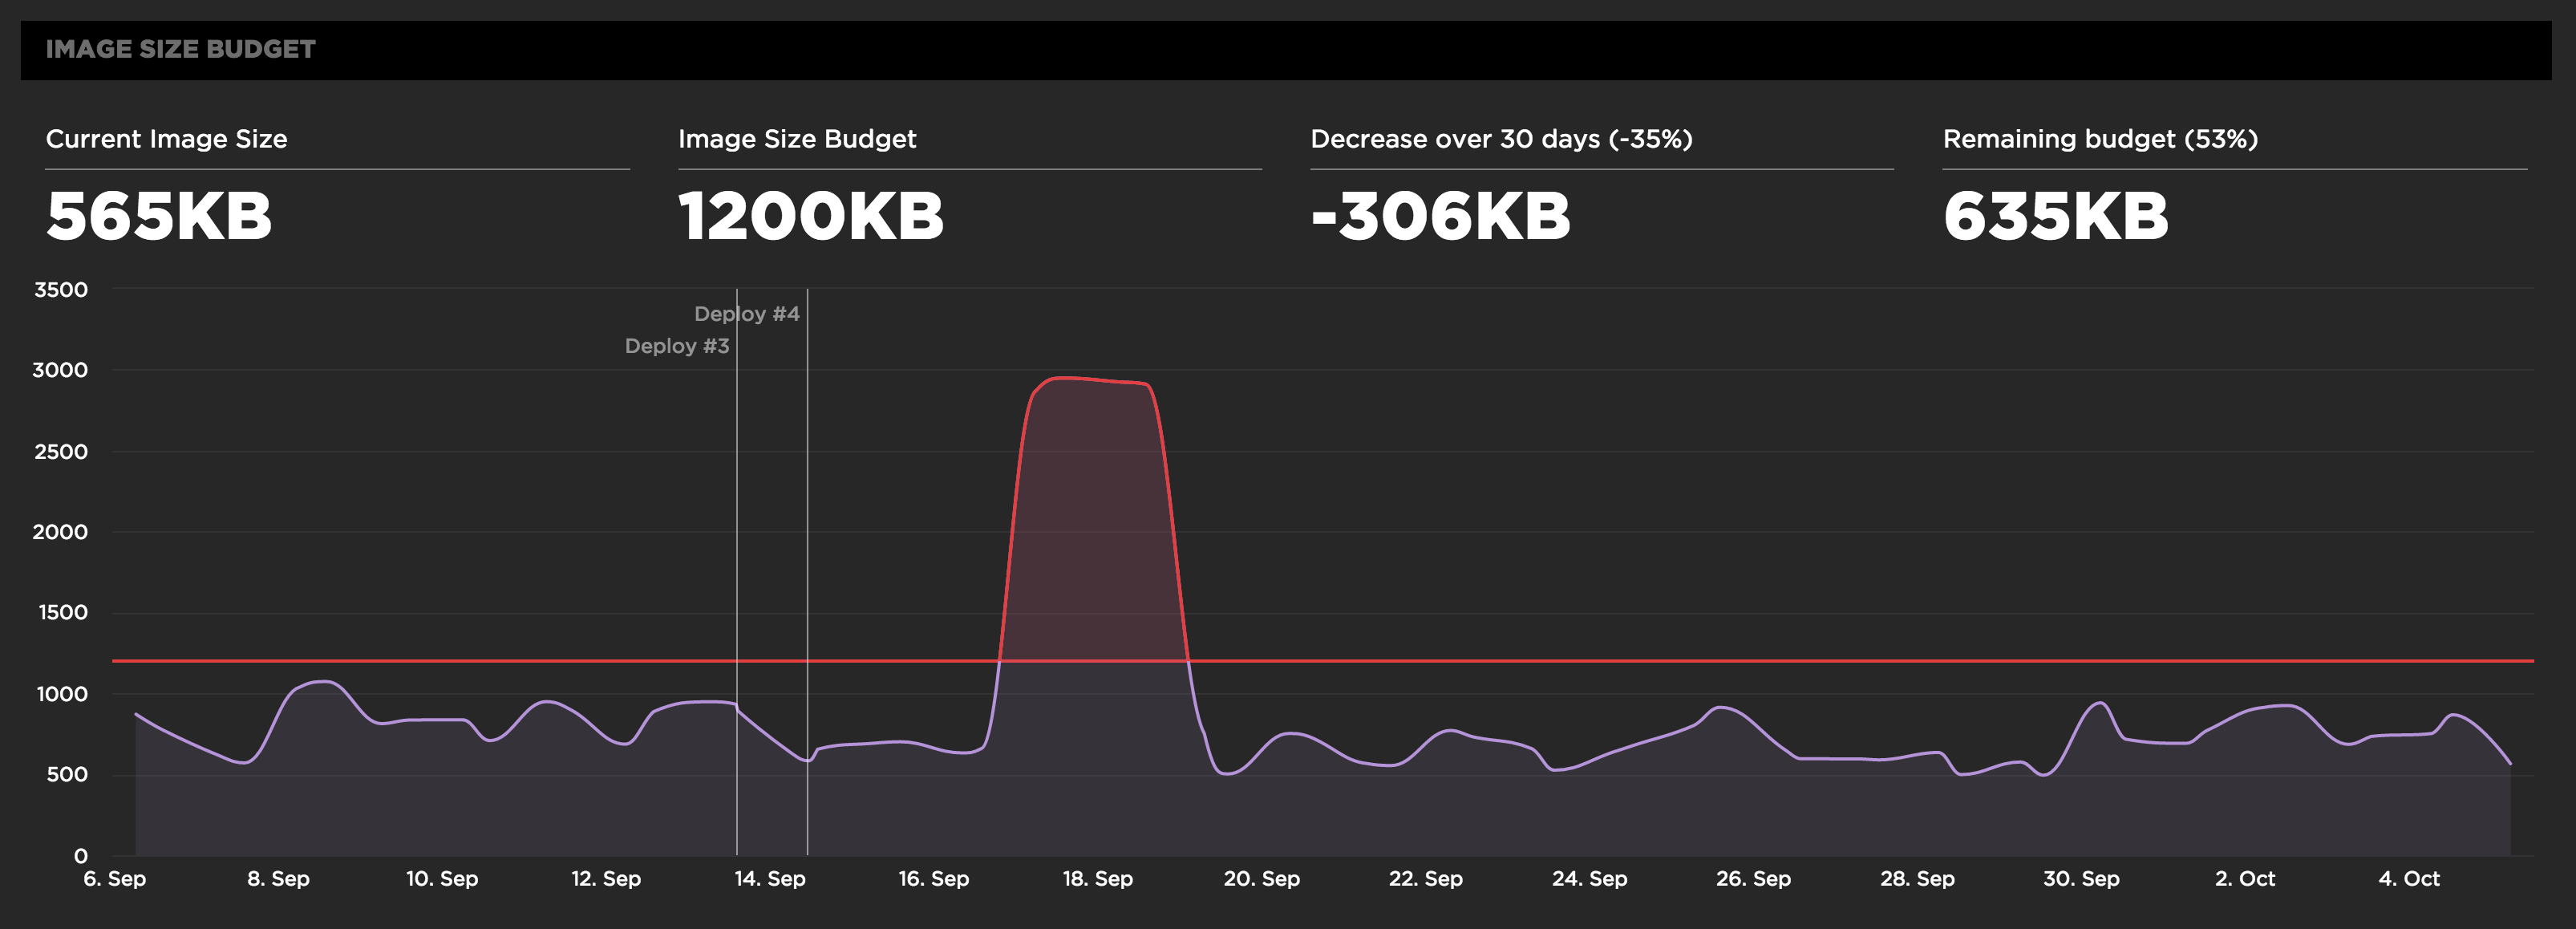
Before setting your performance budgets, you first have to be monitoring your user experience. Only then can you set budgets and thresholds for improving your baseline user experience. This also allows you to quantify the improvements you're making and share success stories across the organization like "We just improved start render by 32% by reducing image requests to half the budgeted amount".
