Performance budgets in action

Performance budgets are an important tool for ensuring your site is delivering a great user experience. Steve first experienced performance budgets while Head Performance Engineer at Google. The practice of using budgets to track performance took off with Tim Kadlec's blog post Setting a Performance Budget. The idea is to identify your performance goals and track the metrics that help you achieve your goals.
At SpeedCurve, we give performance budgets first-class status by tracking them in the Site dashboard. Here's an example of tracking a budget for image size.
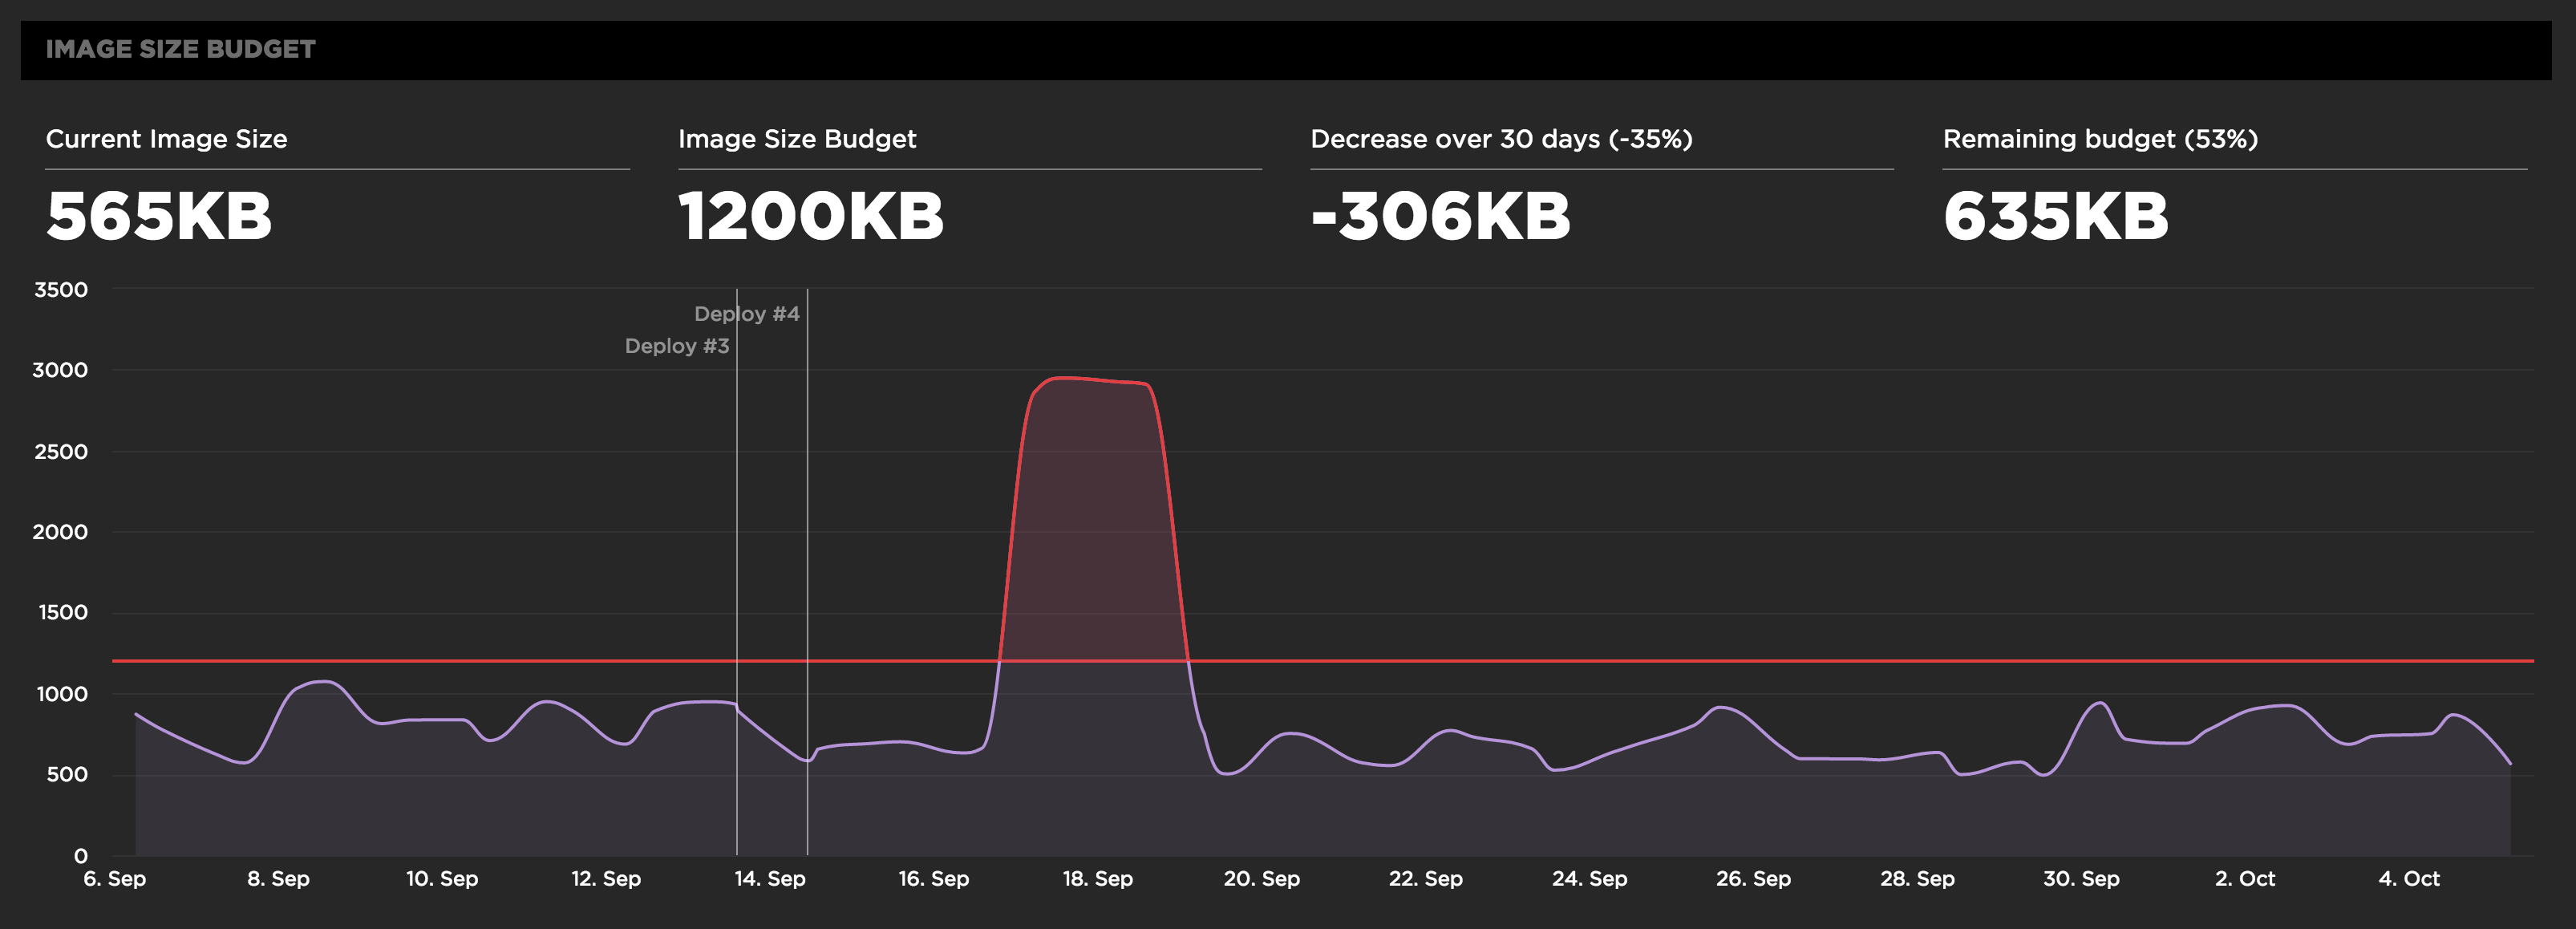
Before setting your performance budgets, you first have to be monitoring your user experience. Only then can you set budgets and thresholds for improving your baseline user experience. This also allows you to quantify the improvements you're making and share success stories across the organization like "We just improved start render by 32% by reducing image requests to half the budgeted amount".
What should my budget be?
There are various ways to approach setting a performance budget depending on the nature of your team, and what's going to make the most sense to them and motivate change:
- Be faster than your competition. Benchmark a variety of metrics and choose a target of 20% faster or less resources.
- Be faster than what’s in production right now. This is great when doing a responsive redesign. Fork your code, rip out the old cruft, set new aggressive budgets and watch for alerts as you add new components and content back in.
- Adopt Human Computer Interface (HCI) guidelines such as those described in Response Times: The 3 Important Limits. Aim for rendering the first meaningful content in under 1000ms.
- Base your budget on user research and design principles, such as Better performance through better design. What are your users actually trying to achieve and how long will they wait?
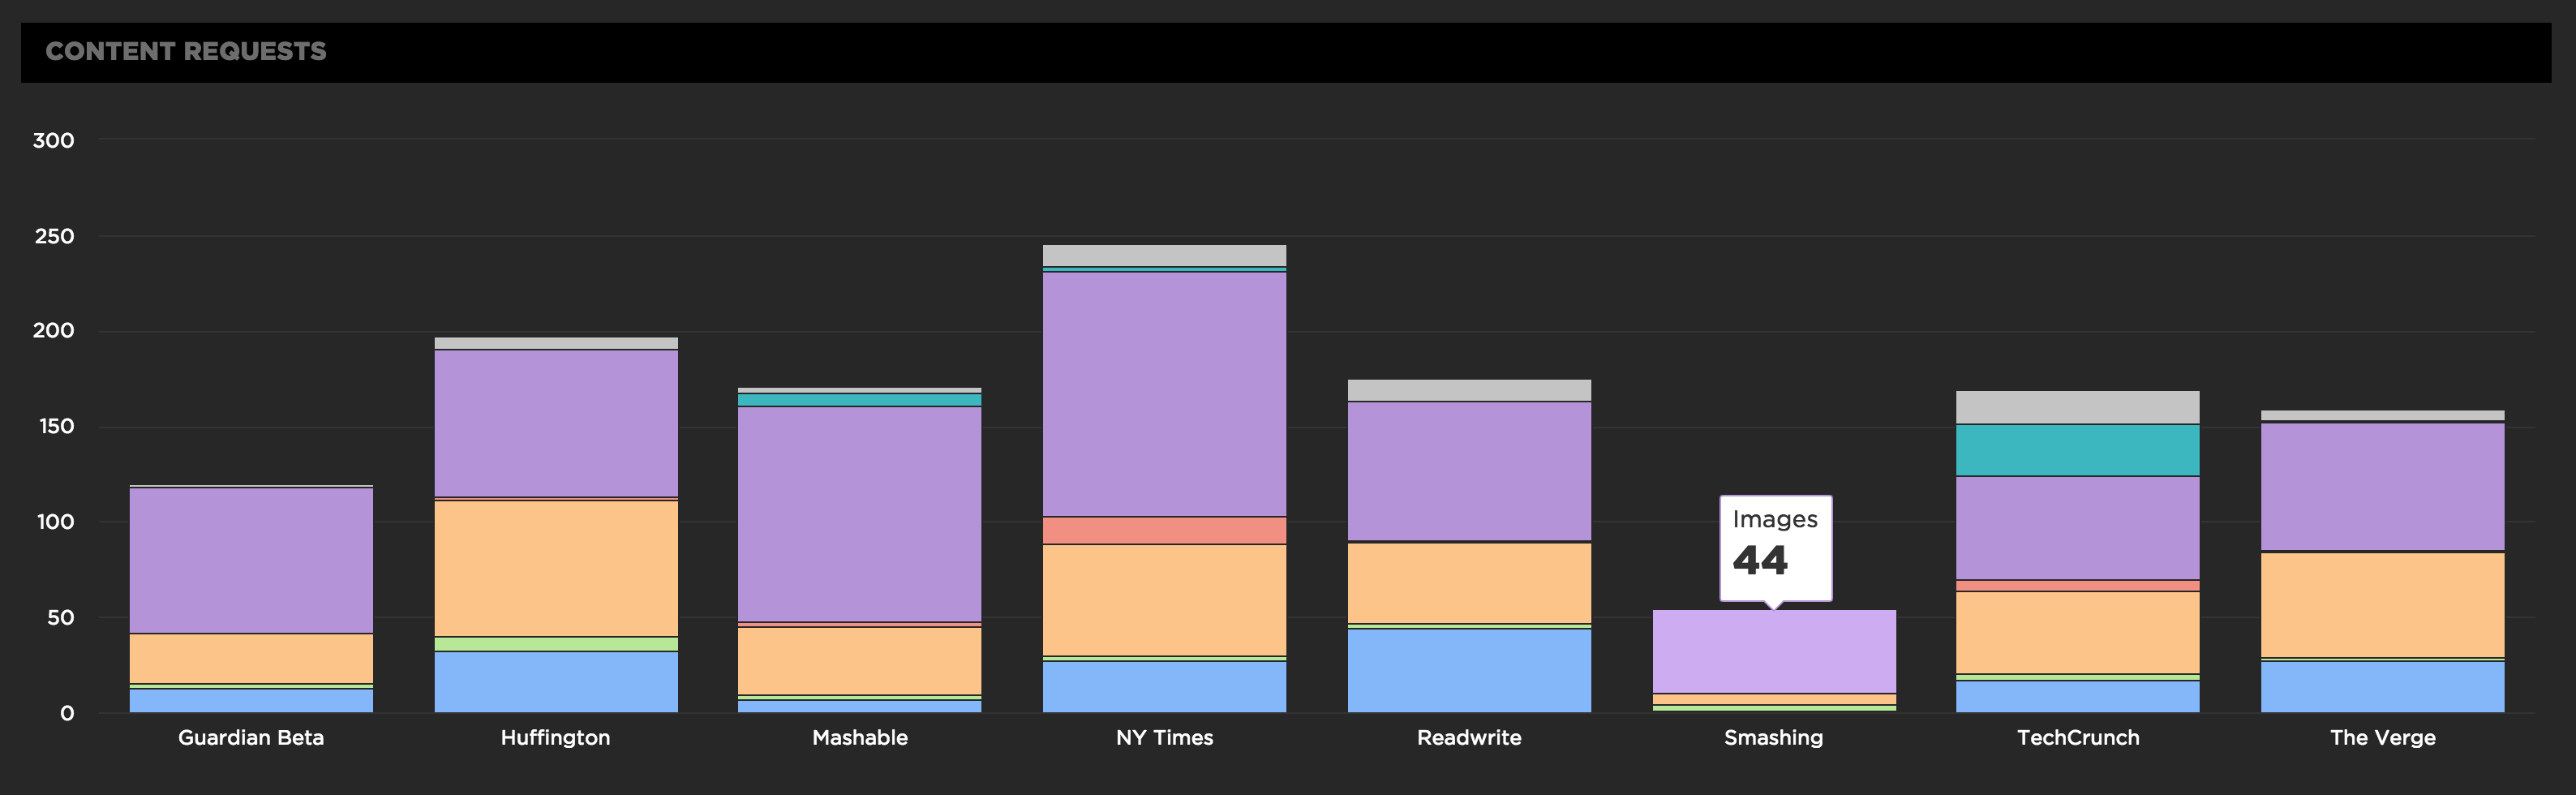
SpeedCurve's Benchmark dashboard is a great way to see how you compare to your competitors for setting budgets. In the chart below, we can see why Smashing Magazine is so much faster - they're simply delivering a lot less JavaScript. If this was your site you could pick a metric like JS requests, set a lower budget and see if you can beat the competition!
Not all metrics are equal
It’s vitally important you evaluate which metrics you’ll budget against. For a long time now we’ve known that metrics like the page onload event are terrible indicators of user experience and yet many performance tools and organisations still use it as a key indicator of performance.
At SpeedCurve we often audit sites and it’s surprising how even very large sites can be misled into delivering a very poor user experience by focusing on optimising for the wrong metric or taking a performance guideline too literally.
The only metrics you should care about and champion across your organization are the ones that represent what a user is actually seeing as the page renders. Other metrics can be useful secondary measures to track the changing nature of your site but don't necessarily correlate to what makes a good user experience. Your users don't care how your website is constructed. What they really care about is how long it takes before they can engage with your awesome content. You need to focus on letting them see that content as quickly as possible!
Herein lies the problem, the majority of metrics are not visual metrics based on what a user is actually seeing but rather events that reflect the processes running in the browser. These two sets of metrics can paint very different pictures and it’s the reason SpeedCurve is built on WebPageTest the leading open source performance tool.
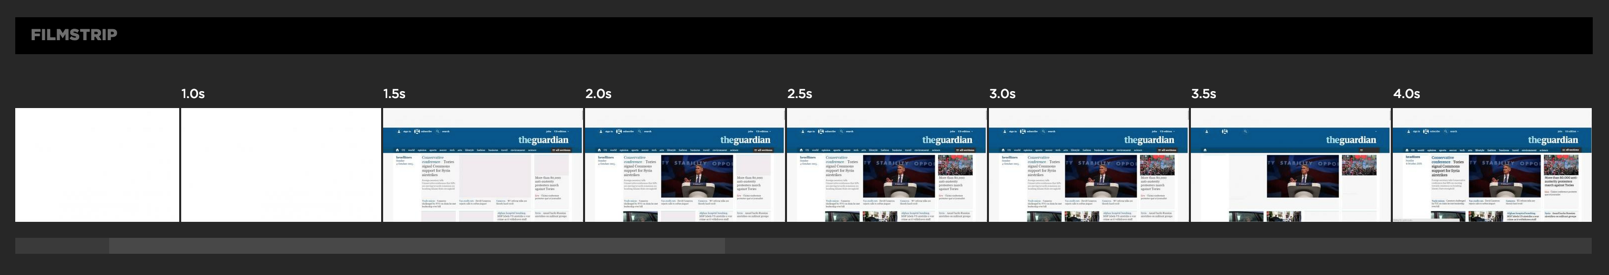
WebPageTest records video and creates filmstrips of how a page loads in a real web browser leading to unique metrics based on visual analysis from a users perspective rather than what a browser thinks it’s doing. It’s an independent measure and provides two unique metrics we can budget against, start render and speed index. These two metrics are a far better representation of the user experience than any of the built-in browser events.
Better yet define your own custom metrics
While start render and speed index are great, ultimately the best metric is the one you define yourself. Like Twitter’s time to first tweet you should be adding a custom metric that represents when the user can actually view and interact with your content. Custom metrics are easy to add with user timing marks and SpeedCurve automatically picks up any marks added to your site without additional configuration. There can be challenges around instrumenting assets like images though and Steve recently discussed these in hero image custom metrics.
Recommended metrics for performance budgets
In order of preference, here are the metrics we recommend you benchmark your user experience against:
- A single UX based custom metric for each template. E.g., the hero image on a product page.
- Speed Index. Paul Irish recommends aiming for under 1000.
- Start render under 1000ms.
Then for each of these metrics pick a budget, set alerts and monitor it as your codebase evolves and (hopefully) improves. You can also add secondary budgets like the size and number of requests to help correlate the construction of your code base with the user experience but the three above are the ones you should really focus on.
Performance budgets in action

See how a SpeedCurve budget alert led Zillow to discover a bug that increased its image size on mobile by 4x in Bigger, Faster, and More Engaging while on a Budget. Interestingly the increase in images didn’t have a noticeable effect on Speed Index and the user experience. Does this mean Zillow could be delivering even more content than it does now as long as the initial content in the viewport renders just as quick? Breaking your performance budgets can lead to really interesting insights on how users interact with your content.

Vox Media, makers of The Verge and SB Nation, benchmarked themselves against the competition and then declared performance bankruptcy. This is a great way to engage with your community and be transparent about the challenges of delivering a rich and fast user experience.
It's oftentimes hard to give a direct answer when someone asks you, "how fast is your site?" so we're educating our team on how we quantify performance at Vox by explaining what each metric means and how they interplay with one another.
Etsy have also done a great job of publicly reporting on performance and meeting the budgets they set for themselves.
Performance budgets are a great way to ensure you deliver an enjoyable, fast user experience. But they only work if you pick the right metrics and set the right thresholds. It's best to focus on metrics that more accurately measure the user experience, such as custom metrics, Speed Index, and start render. All of these metrics are available in SpeedCurve. We focus on measuring what users actually see, and tracking that so you can deliver it even faster.