SpeedCurve is now part of the Embrace family! There are no changes to how you use our products. Our founder Mark shares what this means...
NEW! Heatmaps now available on Favorites Dashboards

We’re thrilled to announce that you can now add heatmaps to your Favorites (custom) dashboards in SpeedCurve!
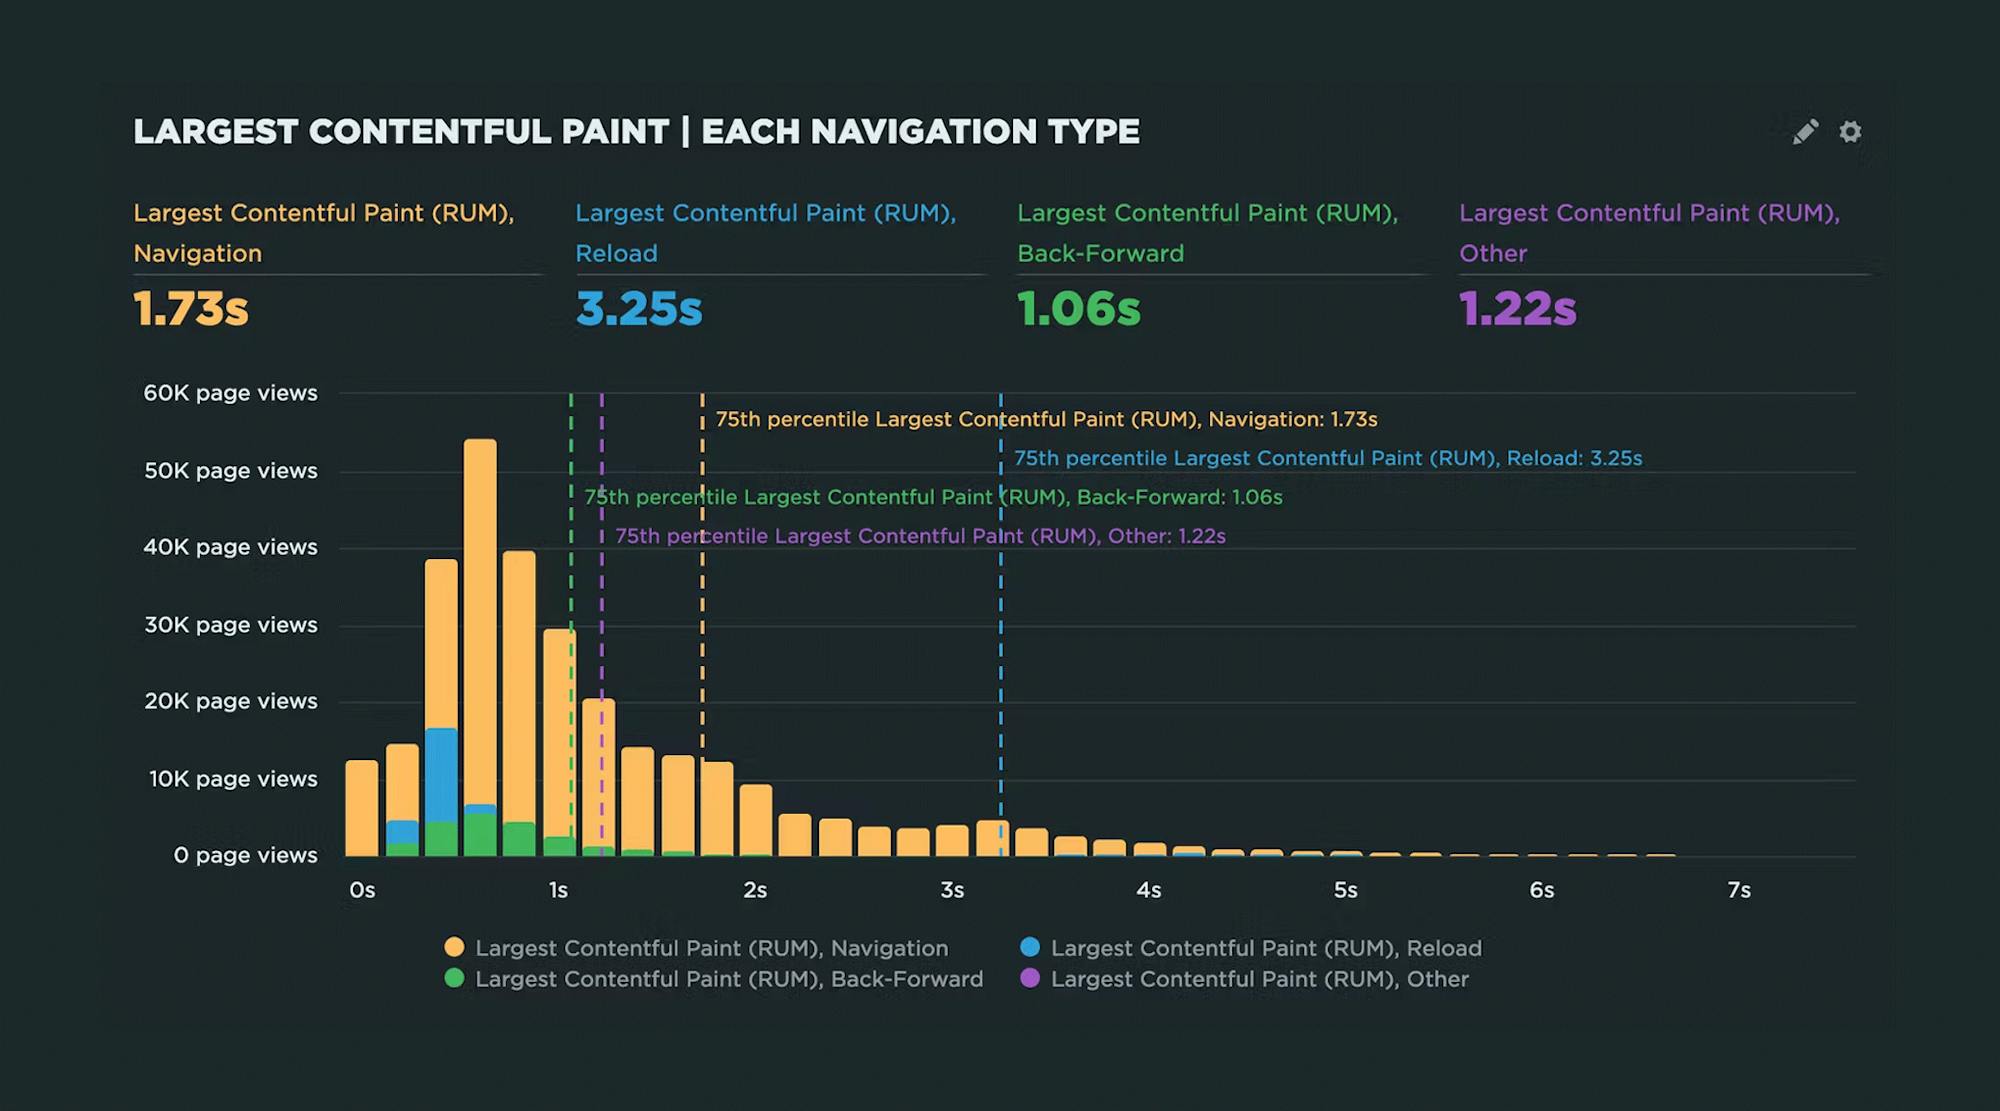
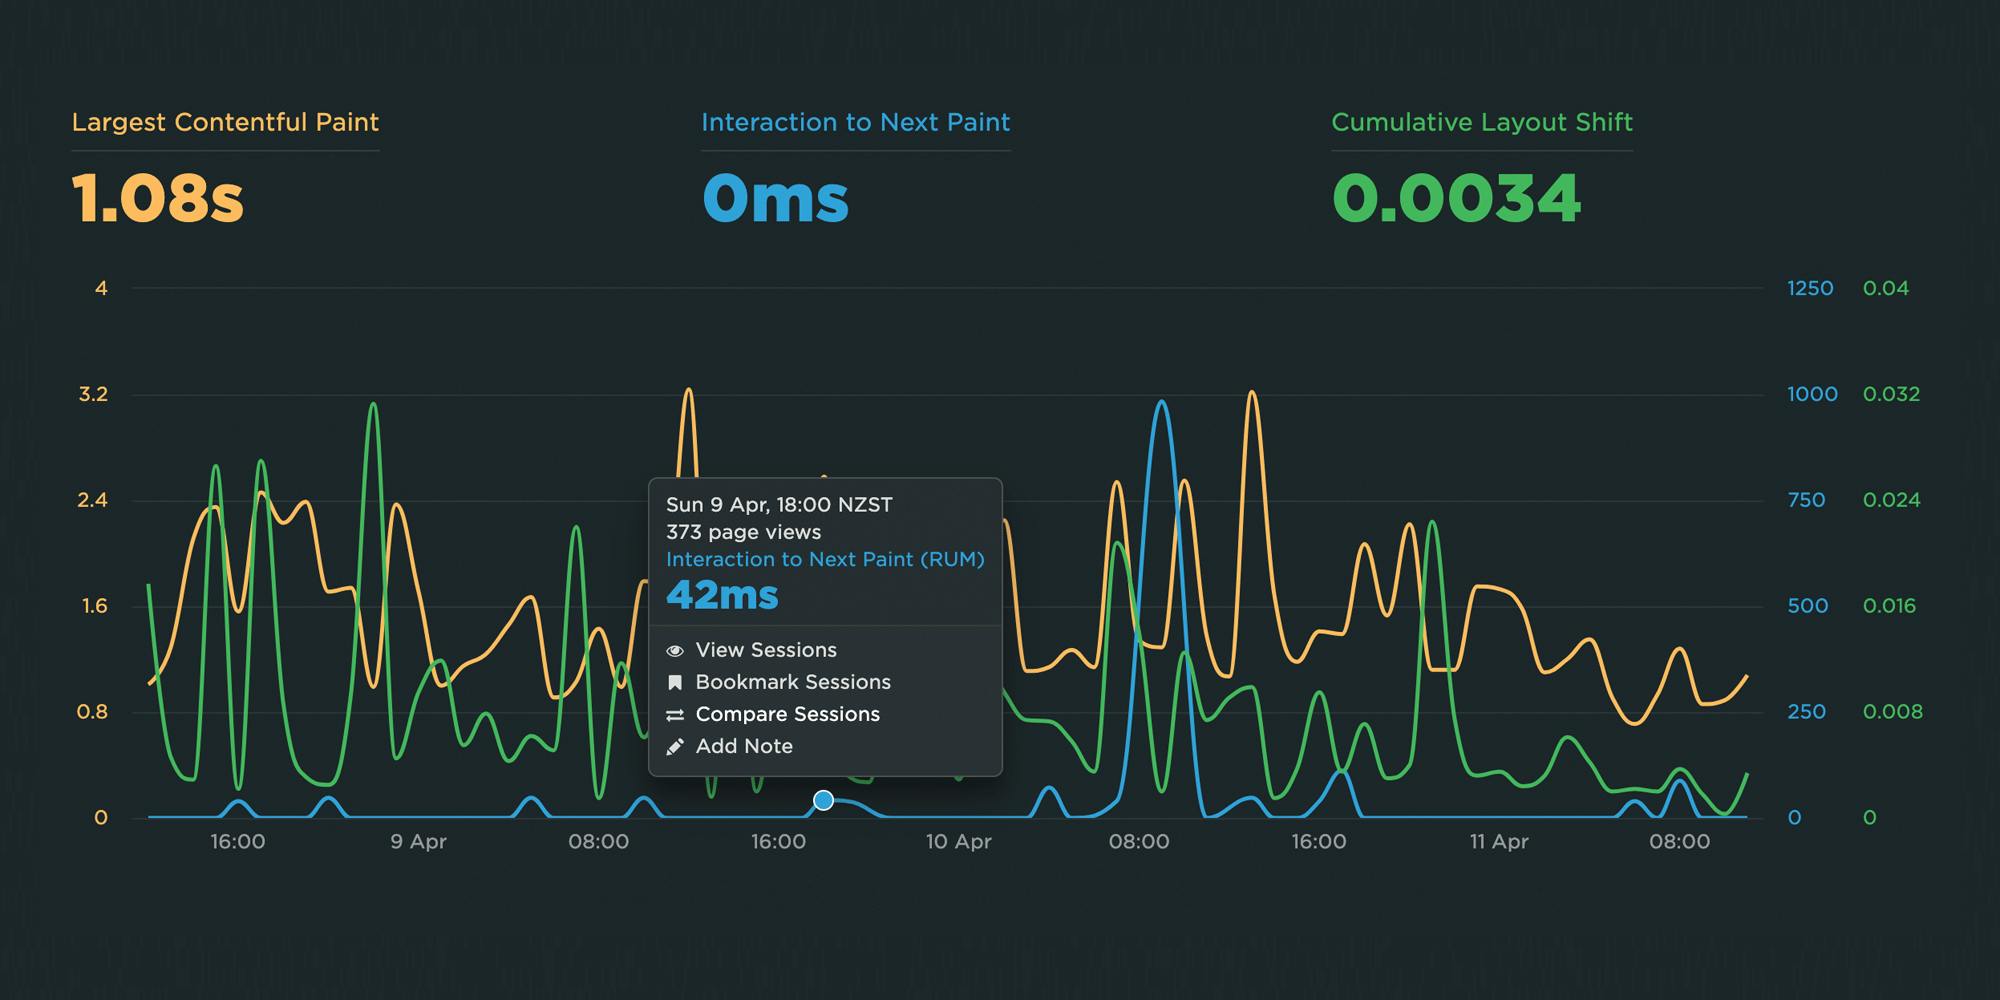
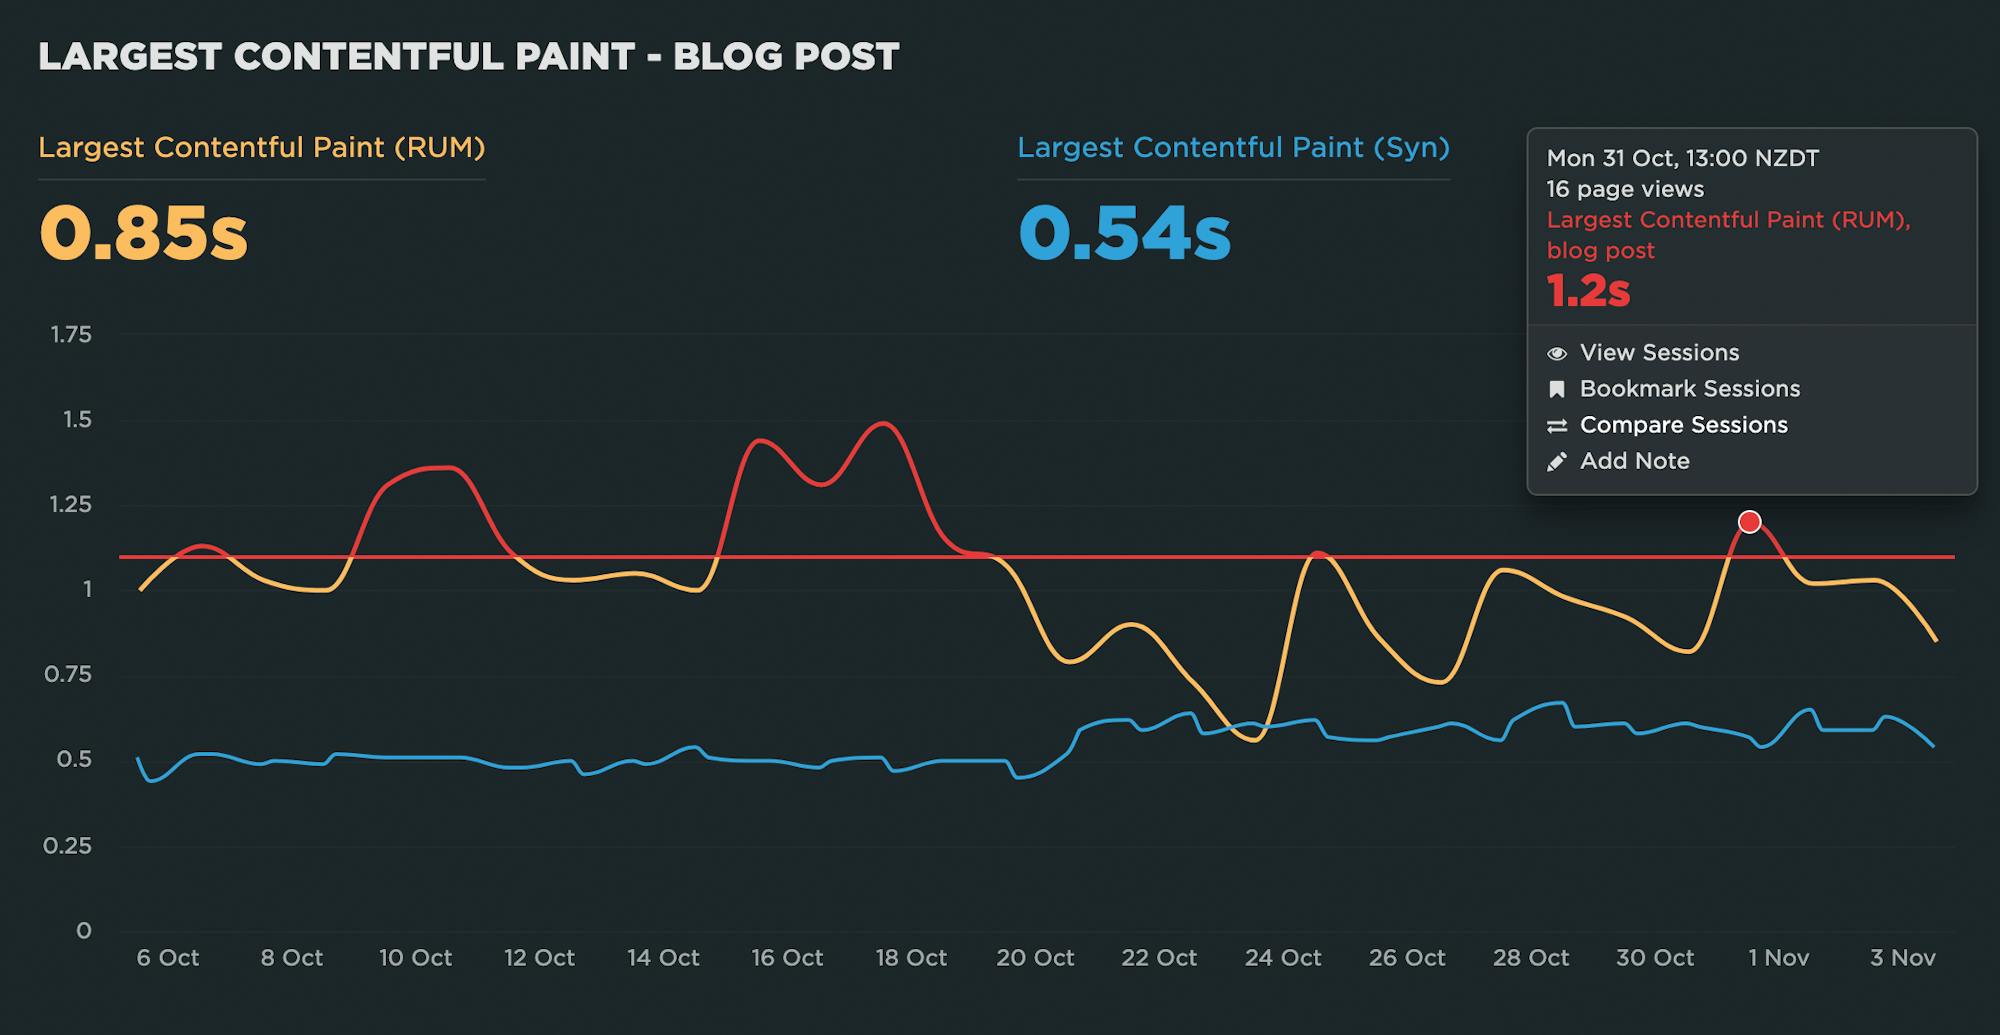
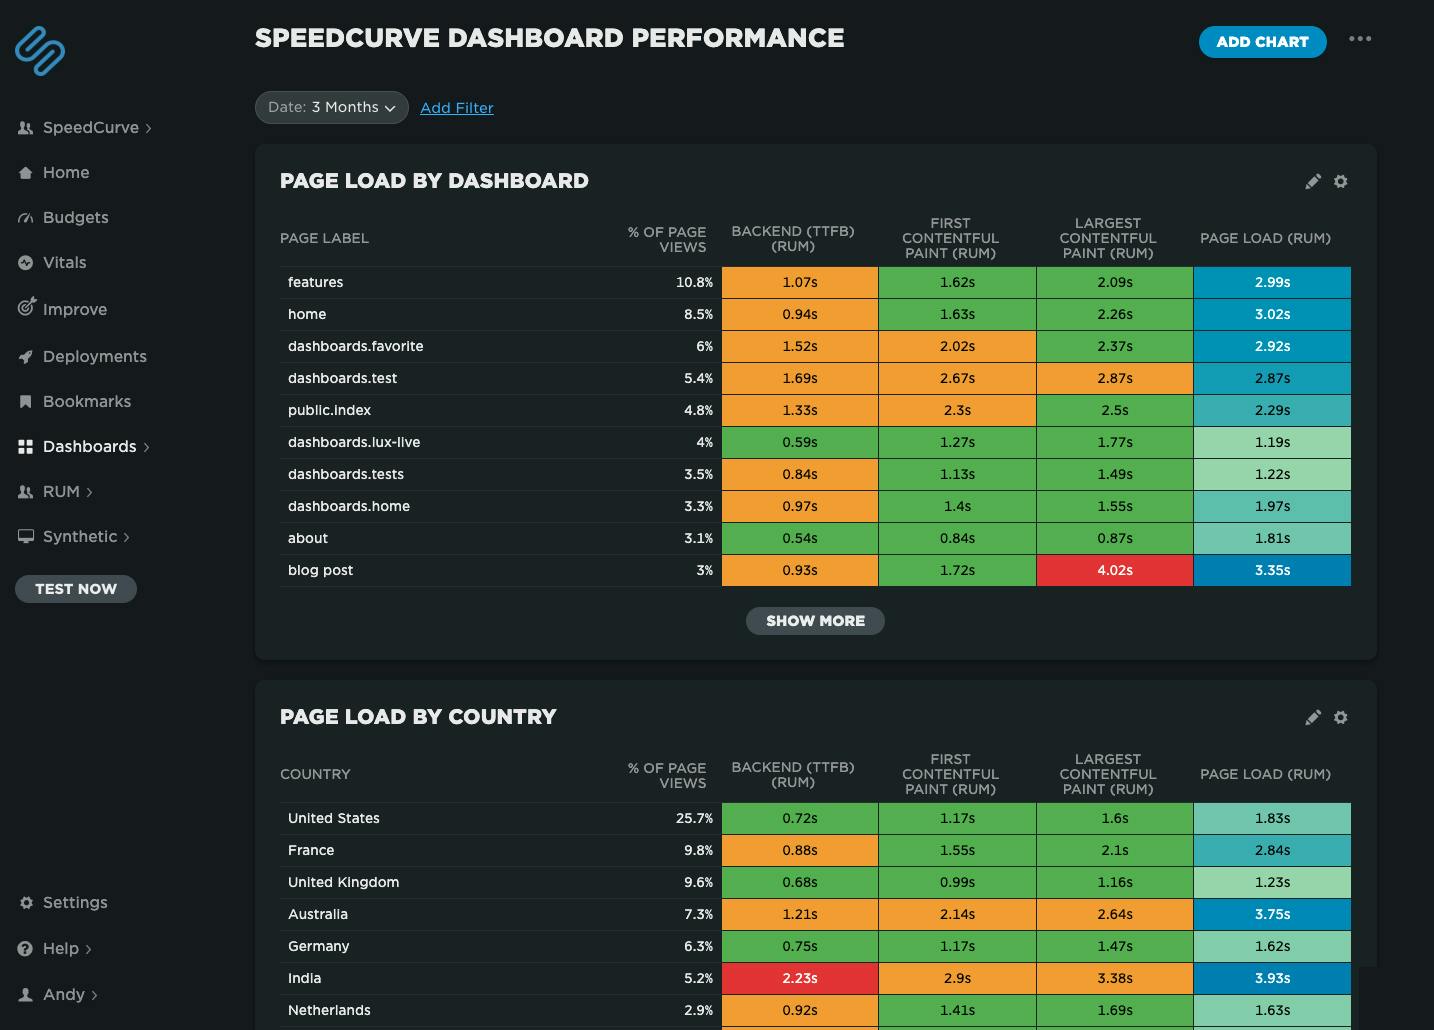 Speedcurve's own performance data for our dashboards. We've got some issues with our blog post page performance, possibly the huge images I've been uploading!
Heatmaps are a powerful way to get an instant overview of where performance issues are hiding across your site. They let you break down your performance metrics (including custom metrics) by different dimensions — including page label, browser, location, and device type — so you can easily spot anomalies and patterns in your web performance data.
For example, you might notice that a specific browser or region consistently loads your site more slowly, or that certain pages are lagging behind the rest. Heatmaps make it easy to visualize and spot those differences at a glance, helping you pinpoint where to focus your optimization efforts.
NEW! Monitor Long Animation Frames and get to the bottom of your JavaScript issues

CPU consumption by the browser is one of the main causes – if not the number one cause – of a poor user experience. The primary culprit? JavaScript execution. Now you can use SpeedCurve to monitor Long Animation Frames (LoAFs) and fix the third parties and other scripts that are hurting your page speed.
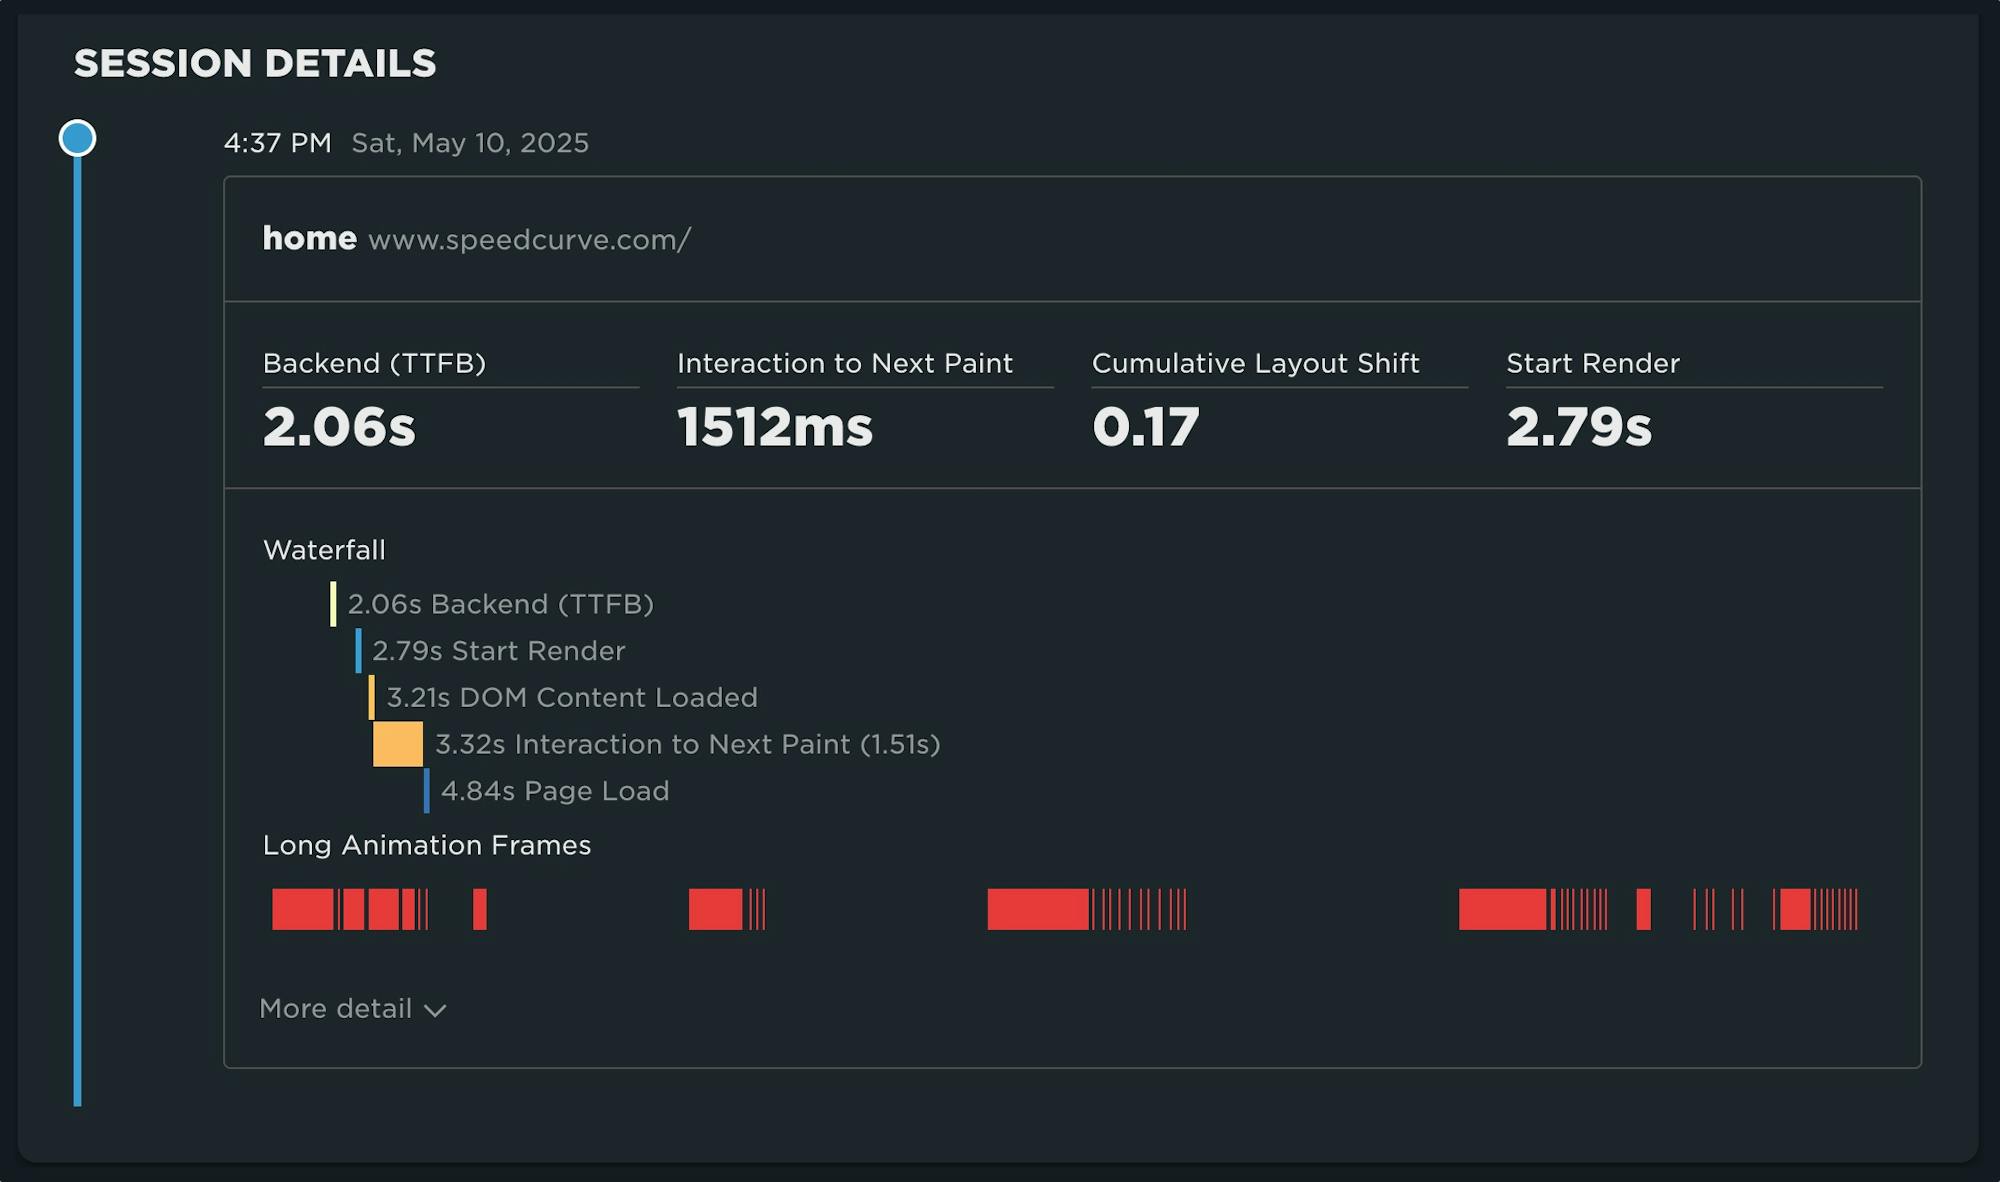
Until recently, we've had little evidence from the field that definitively attributes the root cause of rendering delays. While JavaScript Long Tasks gave us a good indication that there were blocking tasks affecting metrics such as Interaction to Next Paint and Largest Contentful Paint, there was no way to attribute the work or understand how it was ultimately affecting rendering.
Fortunately, we've gotten a lot of help from Chrome in improving the attribution – and ultimately the actionability – of the data we collect in the field with RUM. The introduction of the Long Animation Frames API (LoAF) not only gives us better methods for understanding what's happening on the browser's main thread, in some cases it also gives us attribution to both first- and third-party scripts that occur during a LoAF.
This has been a highly anticipated addition to SpeedCurve, which is available for all our RUM users today. This post covers what's new in the product and points you to a few new resources to help you get up to speed on all things related to LoAF.
NEW! Synthetic test agent updates: Chrome, Firefox and Lighthouse


This month, we've made some updates to our synthetic testing agents. In addition to upgrading the underlying operating system, we've added support for:
- Lighthouse 12.3.0 (previously 10.4.0)
- Chrome 133 (previously 126)
- Firefox 135 (previously 128)
ICYMI: Some of our most exciting product updates of 2024!
Every year feels like a big year here at SpeedCurve, and 2024 was no exception. Here's a recap of product highlights designed to make your performance monitoring even better and easier!

Our biggest achievements this year have centred on making it easier for you to:
- Gather more meaningful real user monitoring (RUM) data
- Get actionable insights from Core Web Vitals
- Simplify your synthetic testing
- Get expert performance coaching when and how you need it
Keep reading to learn more...
NEW: Vitals dashboard updates and filter improvements
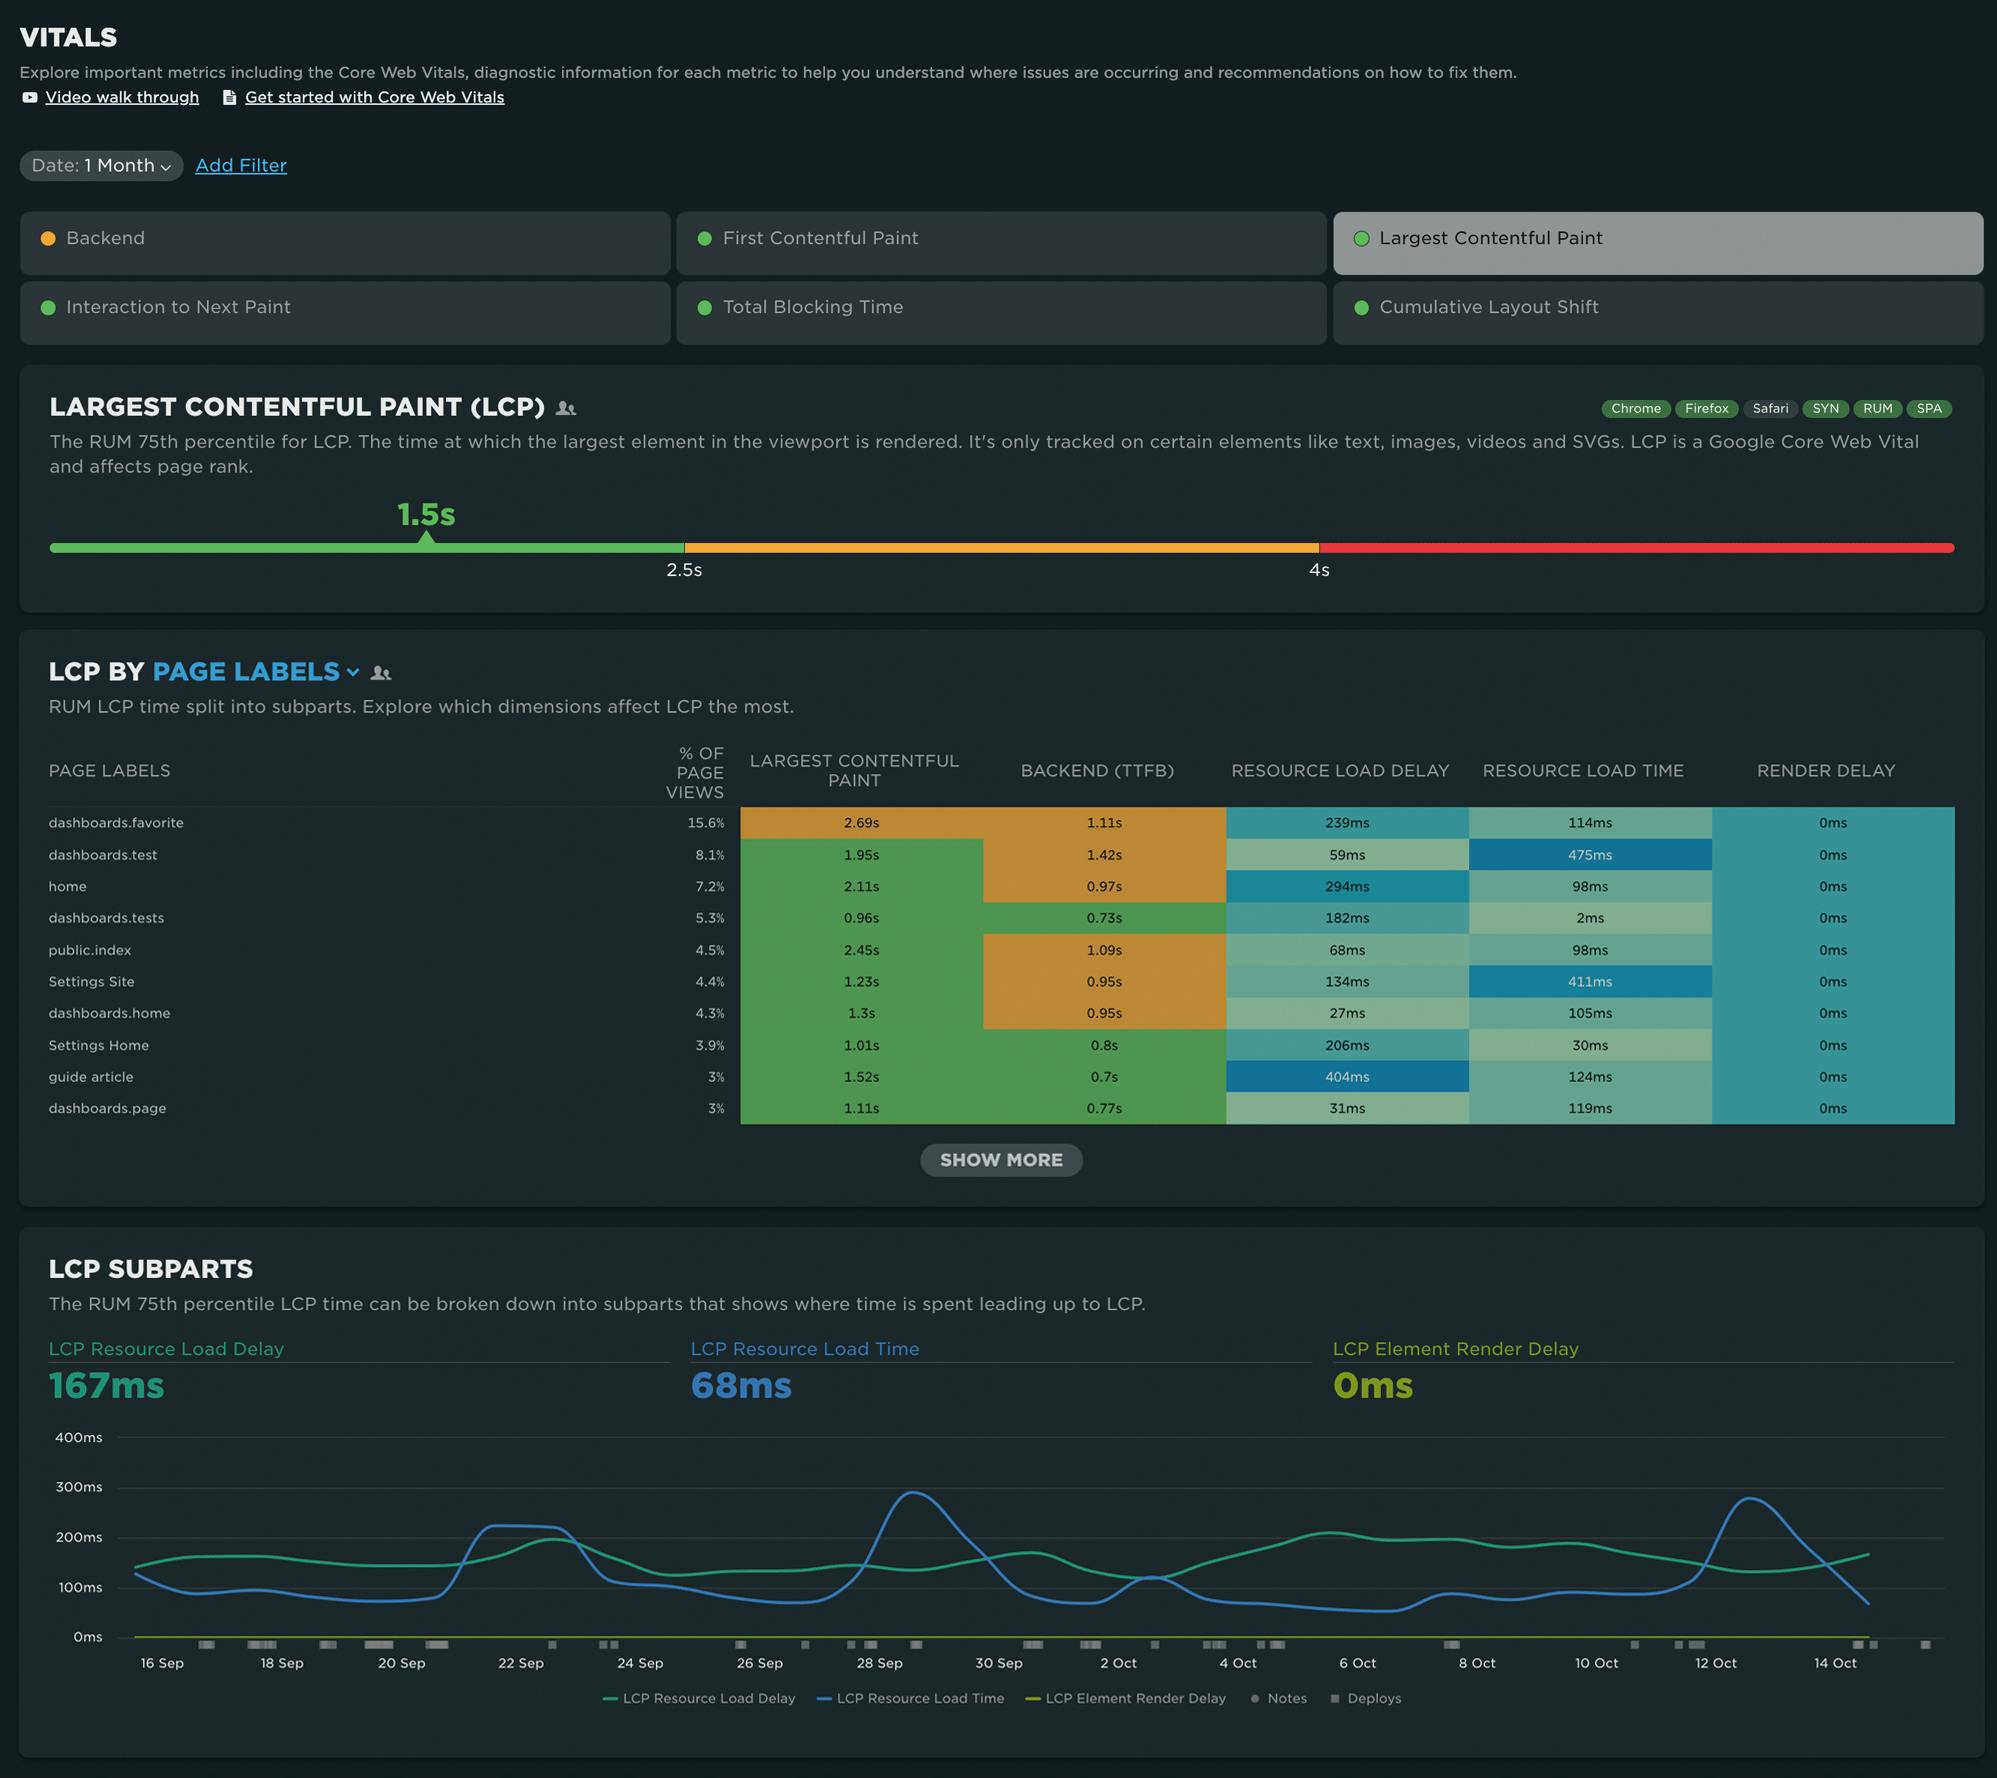
Our development team recently emerged from an offsite with two wonderful improvements to SpeedCurve. The team tackled a project to unify our filtering, and then they over-delivered with a re-Vital-ized dashboard that I'm finding to be one of the most useful views in the product.
Take a look at the recent updates – and a big thank you to our amazing team for putting so much love into SpeedCurve!
NEW: Paper cuts update!
Paper cut: (literal) A wound caused by a piece of paper or any thin, sharp material that can slice through skin. (figurative) A trivial-seeming problem that causes a surprising amount of pain.

We all love big showy features, and this year we've released our share of those. But sometimes it's the small stuff that can make a big difference. We recently took a look at our backlog of smaller requests from our customers – which we labelled "paper cuts" – and decided to dedicate time to tackle them.
Are they all glamorous changes? Maybe not, though some are pretty exciting.
Are they worthy of a press release? Ha! We don't even know how to issue a press release.
Will they make your day better and put a smile on your face? We sure hope so.
In total, our wonderful development team tackled more than 30 paper cuts! These include:
- Exciting new chart types for Core Web Vitals and User Happiness
- Filter RUM data by region
- Create a set of tests for one or multiple sites or custom URLs
- Test directly from your site settings when saving changes
- Usability improvements
- Better messaging for test failures
- And more!
Keep scrolling for an overview of some of the highlights.
NEW: RUM attribution and subparts for Interaction to Next Paint!
Now it's even easier to find and fix Interaction to Next Paint issues and improve your Core Web Vitals.
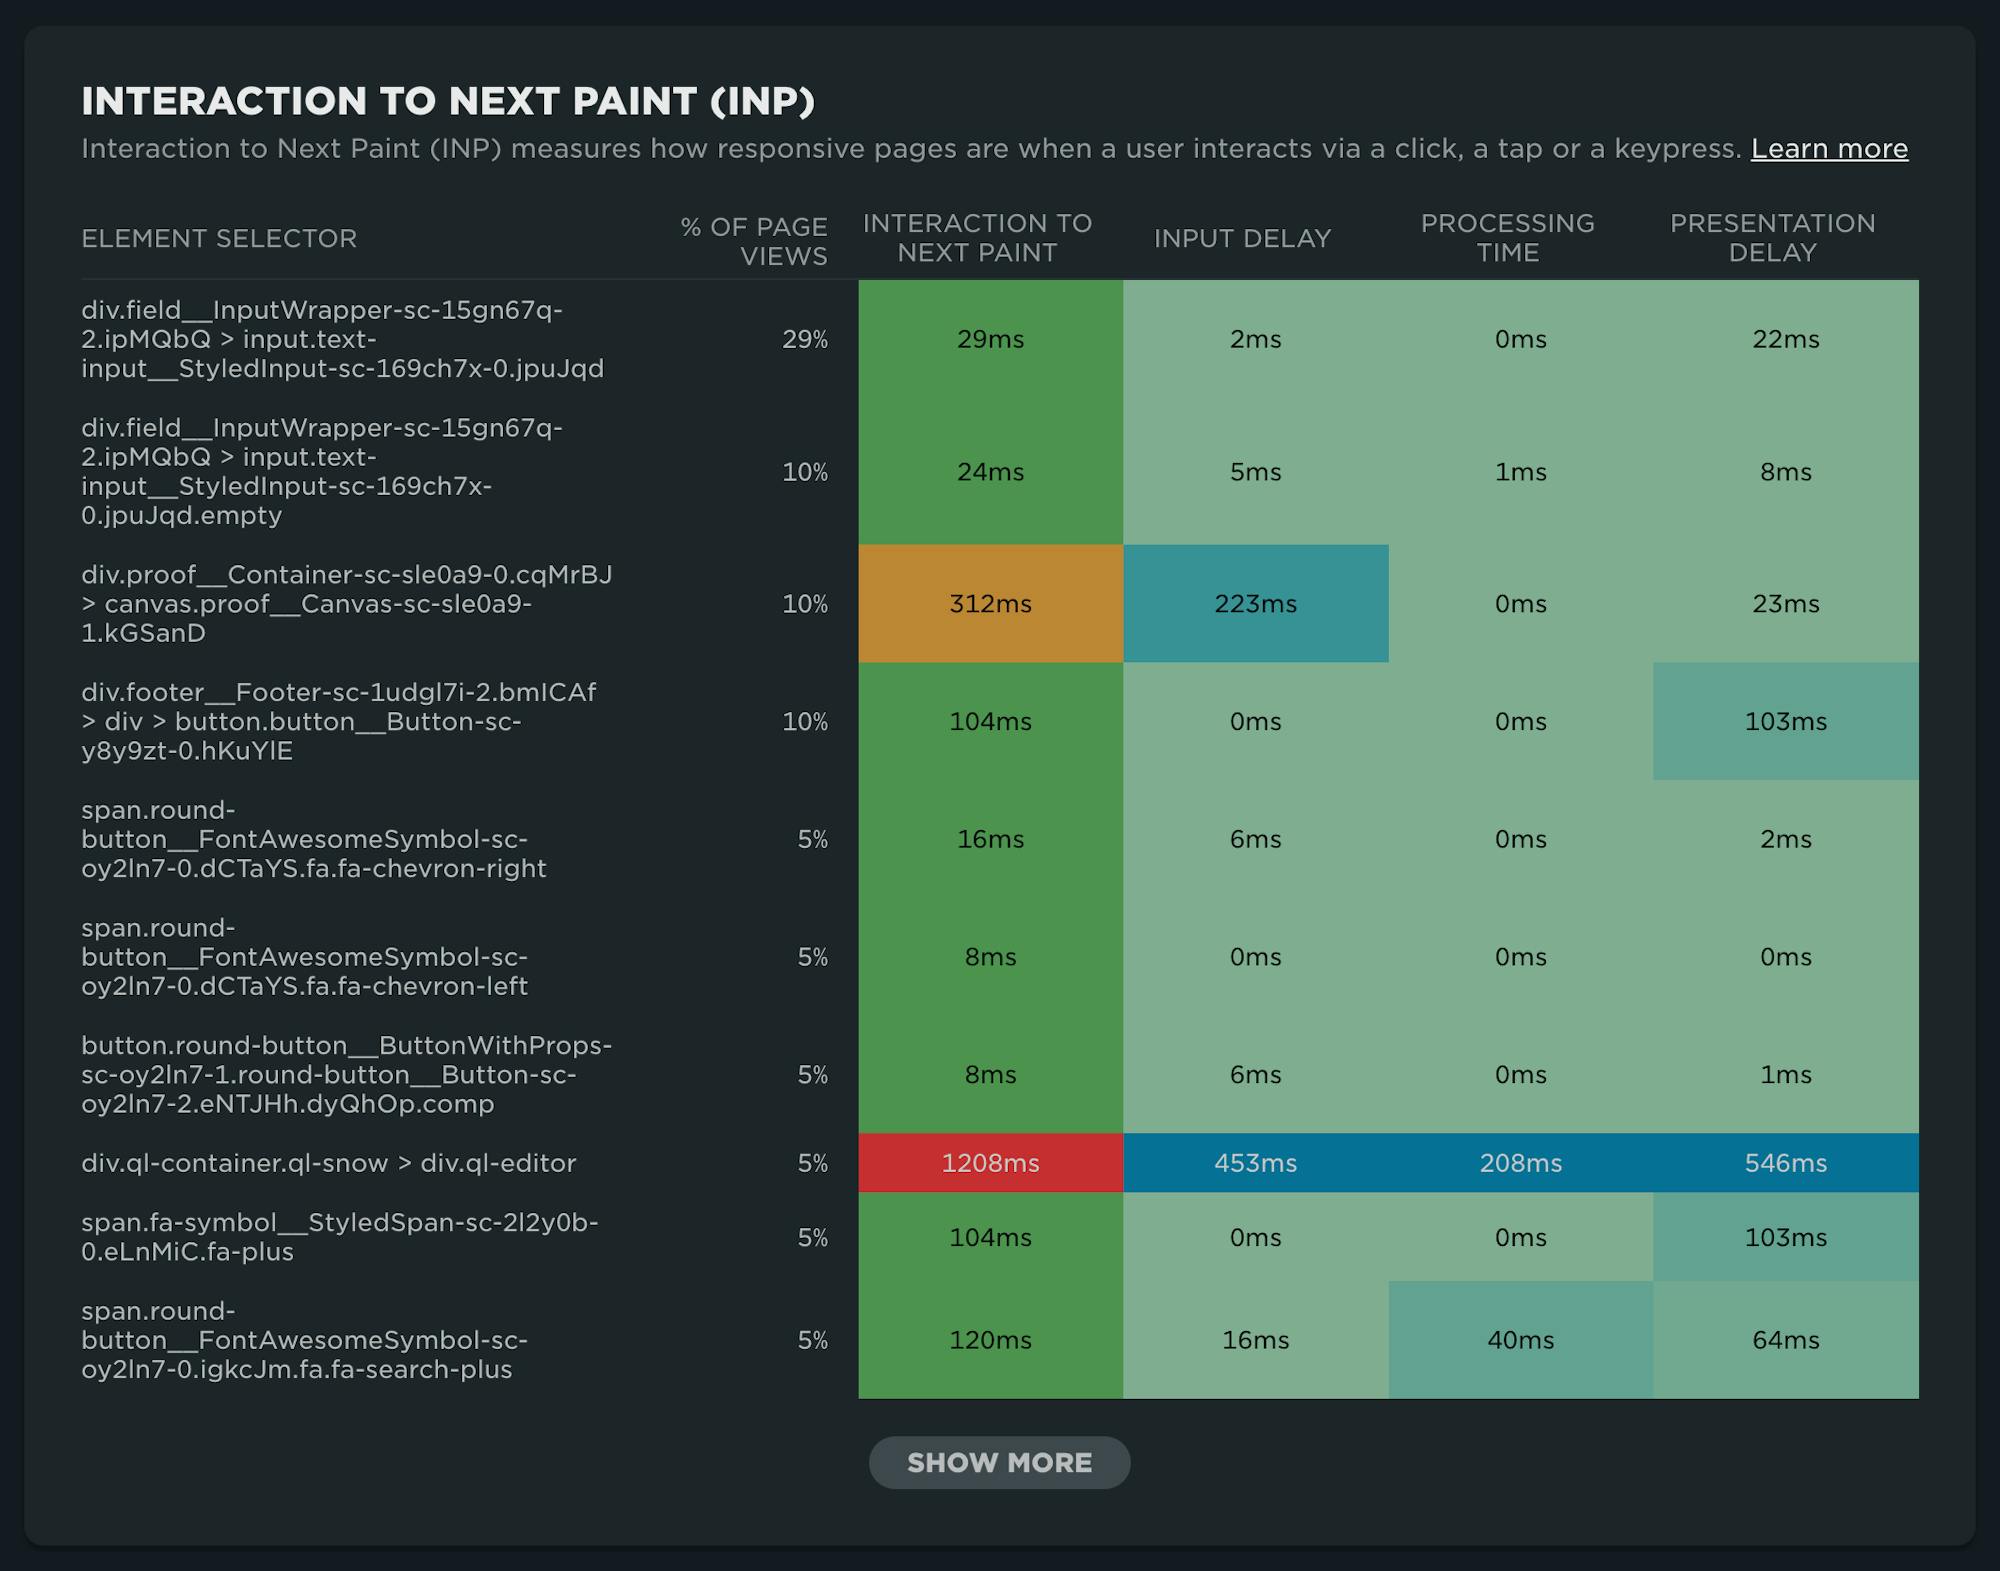
Our newest release continues our theme of making your RUM data even more actionable. In addition to advanced settings, navigation types, and page attributes, we've just released more diagnostic detail for the latest flavor in Core Web Vitals: Interaction to Next Paint (INP).
This post covers:
- Element attribution for INP
- A breakdown of where time is spent within INP, leveraging subparts
- How to use this information to find and fix INP issues
- A look ahead at RUM diagnostics at SpeedCurve
Navigate your way to better performance with prerendering and the bfcache
I was inspired by Tim Vereecke's excellent talk on noise-cancelling RUM at PerfNow this past November. In this talk, he highlighted a lot of the 'noise' that comes along with capturing RUM data. Tim's approach was to filter out the noise introduced by really fast response times that can be caused by leveraging the browser cache, prerendering, and other performance optimization techniques.
I thought Tim's focus on 'human viewable navigations' was a great approach to use when looking at how to improve user experience. But there also may be times when you want to understand and embrace the noise. Sometimes there are opportunities in the signals that we often forget are there.
In this post, I'll demonstrate how you can use SpeedCurve RUM to identify all types of navigations, their performance impact, and potential opportunities for delivering lightning-fast page speed to your users.
We'll cover things like:
- Understanding SPA navigations and performance
- Whether or not to track hidden pages (such as pages opened in background tabs)
- How to take advantage of prerendering and the back-forward cache (aka bfcache)
NEW: On-demand testing in SpeedCurve!

Image by Freepik
On-demand testing has sparked a lot of discussion here at SpeedCurve over the past year. You've always had the ability to manually trigger a round of tests – based on the scheduled tests in your settings – using the 'Test Now' button. But there hasn't been a lot of flexibility to support nuanced use cases, such as...
"I just deployed changes to my site and want to check for any regressions."
"I saw a change to my RUM data and I want to see if I can replicate it with synthetic for further diagnostics."
"I have a paused site that I don't want to test regularly, but would like to test from time to time."
"Please just let me test any URL I want without setting up a site and scheduling testing."
"I need to quickly debug this script without kicking off tests for my entire site."
"I would like to get a first look at a page in order to troubleshoot regressions I saw in RUM."
Based on your feedback, we've just launched new capabilities for on-demand testing. We're pretty excited about these, and we hope you will be, too!
In this post, we'll:
- Highlight the differences between on-demand and scheduled testing
- Cover the various types of on-demand testing, including some of the more common use cases we've heard from SpeedCurve users
- Step you through running an on-demand test
Let's goooooooo!
2023 recap: This year was all about making performance easy (well, easier)


Every year feels like a big year here at SpeedCurve, and 2023 was no exception.
Among other things, we turned ten! Ten years is a lot of time to reflect, and over this past year our team has been thinking a lot about not just the "what" and "how" of web performance, but also the "why". Why should we – and you – care about delivering a fast, delightful experience to all your users? This "why" informs all the choices we make about the "what" and "how" of our tools.
Looking back over the past year, if I were to pick a word that defined our goals, that word would be "easier". It's no secret that the past couple of years have been challenging for the tech community. In the current landscape of smaller teams, aggressive goals, and an ever-increasing tech stack, how can we make it easier for you to create impact?
Our biggest achievements this year have centred on making it easier for you to:
- Fight regressions and keep your sites fast
- Measure the impact of Core Web Vitals on actual user experience
- See correlations between site speed and business metrics
- Visualize your data
- Leverage synthetic and real user monitoring
- Focus on what matters
- Get help when you need it
Keep reading to learn more...
How to automatically test the performance of your GitHub pull requests


As highlighted in our December product update, we've been making a lot of improvements in the area of CI/CD. In addition to the new Deployments dashboards and Notes updates, we've launched a new GitHub integration. Our purpose in building this integration is to lower the barrier for getting web performance feedback for your code changes, directly in the environment you are working in.
Follow along below for an example of how you can use this integration in practice to fight web performance regressions and keep your pages fast.
NEW! December product update

Holy cow, it's been a busy few months! SpeedCurve turned ten, we attended (and gave talks at) performance.now(), Firefox added support for Largest Contentful Paint (LCP), and oh yeah... we just shipped a ton of stuff! (We wanted to wait until the dust settled around Black Friday/Cyber Monday for all of our friends in retail, which led to a pretty monumental release.)
So get comfy and check out our holiday updates.
SpeedCurve Recipes: Multi-step test scripting made easy!
![]()
You may already know that SpeedCurve lets you test multiple URLs for a site across a wide selection of browsers, devices, connection types, and geolocations.
You may also know that SpeedCurve lets you add synthetic scripts to your test settings, which lets you easily do things like simulate a repeat view or block a third party.
But did you also know that we've made it easy to simulate more complex use cases? These include:
- User journeys through your site
- Checkout processes
- Submit a login form
- SPA and AJAX navigations
- Set cookies
Keep reading to learn how Recipes make it easy for you to test a variety of scenarios that can help you understand how your visitors are experiencing your site – and how to improve their experience!
NEW! Lighthouse 10, Core Web Vitals updates, and Interaction to Next Paint
There is a lot of excitement in the world of web performance these days, and April has been no exception! At SpeedCurve, we've been focused on staying on top of the items that affect you the most.
Here is a look at what's new in SpeedCurve:
- Support for Lighthouse 10, including metric scoring changes as well as audits
- Updated RUM Core Web Vitals, including the much-anticipated addition of Interaction to Next Paint (INP)
All of this work driven by the community is having a big impact in our collective goal to make performance accessible for everyone.
Read on to learn more about these exciting changes!
NEW! Home, Site, Page and Tests dashboards
Things have been busy over here at SpeedCurve HQ! Coming off of the back of our latest RUM Compare dashboard release, we are super excited to launch four new dashboards to make your life better, your work easier, and your websites faster.
- Home - Well, now you have one. We needed a place for folks to land when they were jumping into all that SpeedCurve has to offer. The newly released Home page is a great starting place, pulling together views of both RUM and Synthetic data and directing you on where to dig in next.
- Sites - We've rebuilt our Sites dashboard to give you a holistic look across all of the URLs you are monitoring. Start here to understand which areas of your site need the most attention and identify areas you can have the most impact.
- Pages - This detailed view gives you trended information for all the metrics you know and love. Easily identify areas of opportunity and how things are performing over time for specific pages you are monitoring.
- Tests - We've had a lot of requests for this, so we're happy to deliver it. You can now see a list of your latest synthetic tests and spot any failed tests.
Let's take a look!
2022 in review: New dashboards, Core Web Vitals enhancements, third-party tracking & more!

Every year feels like a big year, and 2022 has been no exception. Not only did we celebrate our ninth birthday (!!!) we also:
- Launched a series of new and improved dashboards to help you identify and fix your performance issues more quickly and efficiently (More on those below.)
- Expanded our test agent locations to bring you even more places to test from worldwide
- Jumped into in-person events, and were so happy to catch up with some of you at SmashingConf and performance.now() (You can watch videos of my talk about performance budgets and Andy Davies' talk about third parties.)
Keep reading for a full recap of the past year...
NEW! RUM Compare dashboard
Exploring real user (RUM) data can be a hugely enlightening process. It uncovers things about your users and their behavior that you never might have suspected. That said, it's not uncommon to spend precious time peeling back the layers of the onion, only to find false positives or uncertainty in all that data.
At SpeedCurve, we believe a big part of our job is making your job easier. This was a major driver behind the Synthetic Compare dashboard we released last year, which so many of you given us great feedback on.
As you may have guessed, since then we've been hard at work coming up with the right way to explore and compare your RUM datasets using a similar design pattern. Today, we are thrilled to announce your new RUM Compare dashboard!
With your RUM Compare dashboard, you can easily generate side-by-side comparisons for any two cohorts of data. Some of the many reasons you might want to do this include:
- Improve Core Web Vitals by identifying the tradeoffs between pages that have different layout and construction
- Triage a performance regression related to the latest change or deployment to your site by looking at a before/after comparison
- Explore and compare different out-of-the-box cohorts, such as device types, geographies, page labels, and more
- Analyze A/B tests or experiments to understand which had the most impact on user behavior, as well as performance
- Optimize your funnel by understanding differences between users that convert or bounce from your site and users who don't
- Evaluate CDN performance by exploring the impact of time-of-day traffic patterns
Let's take a tour...
Page labels: Why they are important and how to use them
Labeling your pages in your synthetic and real user monitoring (RUM) tools is a crucial step in your performance monitoring setup. We recently released some exciting new capabilities for labeling your RUM pages that we want to share with you. This is also a great opportunity to reiterate why page labels are important, and to show you how easy it is to apply labels to your pages.
Why should I care about page labels?
There are so many benefits to labeling your pages in both your synthetic and real user monitoring (RUM) tools. Page labels give you the ability to:
- Compare and benchmark similar pages across different sites
- Create more meaningful performance budgets in RUM
- Correlate RUM data with synthetic diagnostics in the same charts (e.g., for Core Web Vitals that are measurable in synthetic and RUM)
- Prioritize performance optimizations according to their projected impact on real users
Ready to learn more? Let's get to it!
July 2022 product update: Web Vitals support, more synthetic test agents & performance heat maps

It's been another busy month here at SpeedCurve! Check out our latest product updates below.
June 2022 product update: Performance recommendations on Vitals dashboard, RUM path filters & more

We've been busy here at SpeedCurve HQ! Here's a roundup of our recent product updates.
