SpeedCurve is now part of the Embrace family! There are no changes to how you use our products. Our founder Mark shares what this means...
Are your JavaScript long tasks frustrating users?

When it comes to long JavaScript tasks, how long is too long?
The general consensus within the web performance community is that any JS scripting task that takes more than 50ms to execute can affect a user's experience. When the browser's main thread hits max CPU for more than 50ms, a user starts to notice that their clicks are delayed and that scrolling the page has become janky and unresponsive. Batteries drain faster. People rage click or go elsewhere.
No one plans to make a page or web app that sucks the life out of their users' devices, so it's super important to monitor the effect your JS is having. (Yes... I'm looking at you, front-end JS libraries and third-party ads!)
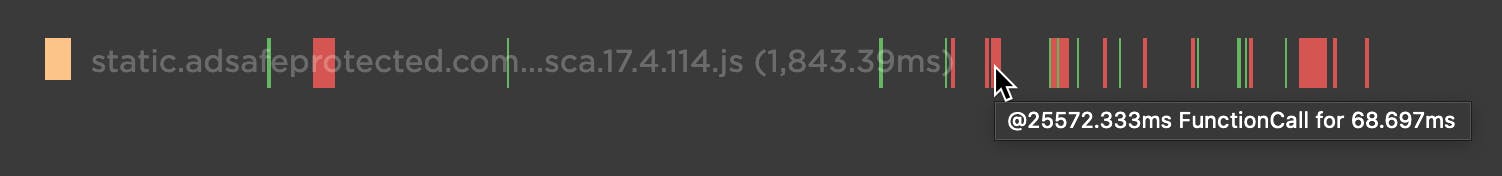
Our waterfall chart shows every long task over 50ms as a red block.
New JavaScript CPU metrics
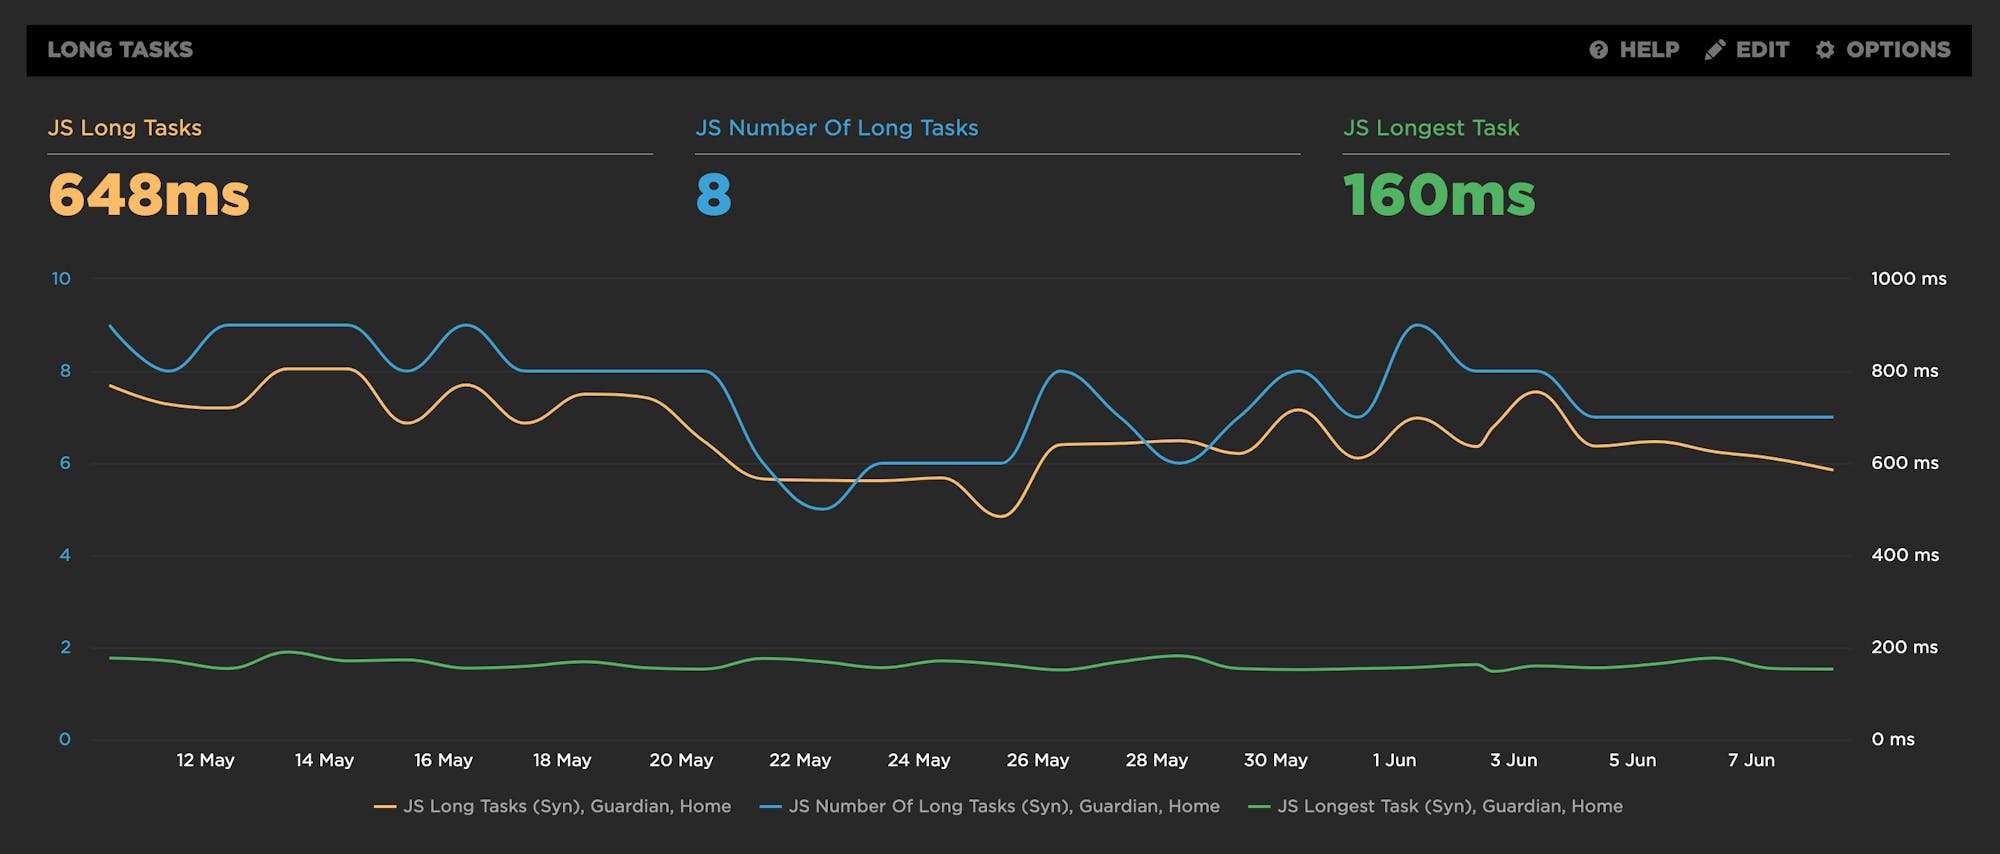
We've recently added a bunch of new JavaScript CPU metrics that help you understand if your scripts are blocking the main thread and getting in the way of a super smooth experience for your users:
- Long Tasks – The total time of all your JS tasks over 50ms added together – from navigation start till the page is fully loaded.
- Number of Long Tasks – The total number of individual JS long tasks.
- Longest Task – There's a lot that can hide in the details of long task time. One really long task that frustrates your user is an order of magnitude worse than a bunch of long tasks that are just over the 50ms threshold each. For that reason, we track not only the number of long tasks in a page but also the duration of the longest task in the page. (We've seen individual JS long tasks taking over 1,000ms! That's a whole second where the browser just locked up, sat on its hands, and refused to do anything while a poor user mashed on the keyboard and wiggled the mouse wondering what happened.)
New! Tracking first- and third-party request groups

Getting visibility into the impact that known third parties have on the user experience has long been a focus in our community. There are some great tools out there – like 3rdParty.io from Nic Jansma and Request Map from Simon Hearne – which give us important insight into the complexity involved in tracking third-party content.
When we released our re-imagined Third Party Dashboard last year, we were excited to be providing site owners with another great tool for managing the unmanageable. Among other things, we took an approach that included:
- grouping requests,
- exposing Long Tasks attributed to third parties, and
- tracking blocking CPU time.
This provided even more insight into the different ways JavaScript could be causing real headaches for users.
We received a lot of feedback from our customers, who loved the new third-party functionality but REALLY wanted to see similar functionality for their "first party" content as well. We heard this message loud and clear, and today we're happy to announce a few changes to our Synthetic monitoring tool that address this need while preserving the functionality you already know and love.
Getting started with web performance? Here's what you need to focus on.

A while back, our friends at Shopify published this great case study, showing how they optimized one of their newer themes from the ground up – and how they worked to keep it fast. Inspired by that post, I wanted to dig a bit deeper into a few of the best practices they mentioned, which fall loosely into these three buckets:
- Analyze your pages – understand the critical rendering path and page composition.
- Create performance budgets and fight regression.
- Build a performance culture that embraces collaboration between design and dev.
Keep reading to learn how you can apply these best practices to your own site and give your pages a speed boost.
Measuring Jank and UX

Ten years ago the network was the biggest problem when it came to making websites fast. Today, CPU is the main concern. This happened because networks got faster while JavaScript moved in the other direction growing 3x in size in the last six years. This growth is important because JavaScript consumes more CPU than all other browser activities combined. While JavaScript and other activities block the CPU, the browser can't respond to user input creating the sensation of a slow, jittery, or broken page, AKA "jank".
To help focus our attention on CPU, several new performance metrics have been defined and evangelized over the last year or three. In this post I'm going to focus on these:
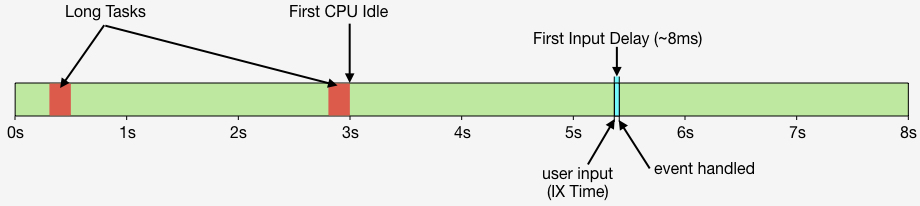
- First CPU Idle measures when the page is no longer janky. Specifically, it is the first span of 5 seconds where the browser main thread is never blocked for more than 50ms after First Contentful Paint. A value of 2-4 seconds is typical.
- First Input Delay measures the gap between when a user interacts with the page (e.g, clicks or scrolls) and when the browser is able to act on that input. First Input Delay values are much lower - a good target is 10ms, but 25ms is common.
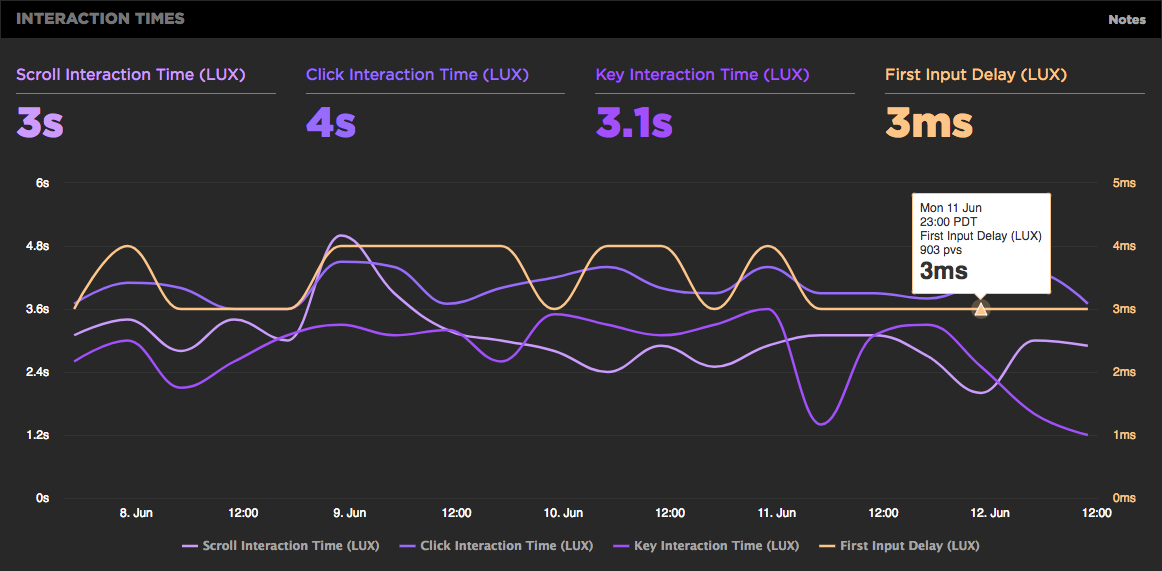
- First Interaction Time is when the first user input takes place. This varies widely depending on the type of site and page. A good search results page might have a low First Interaction Time because users scroll and click quickly. A media site might have a high First Interaction Time because users start reading content (headlines, stories) before interacting with the page. At SpeedCurve we call this "IX Time".
- Total Long Task CPU Time is the sum of all long tasks that occur in the page. A "long task" is a browser event that blocks the main thread for more than 50ms.
Here's a figure to help visualize these metrics.
New LUX JavaScript Dashboards
As organizations work to improve performance for users around the world on slower networks and devices, the focus on JavaScript continues to grow. LUX's new JavaScript dashboards help to identify the problems and solutions for creating a fast, joyous user experience.
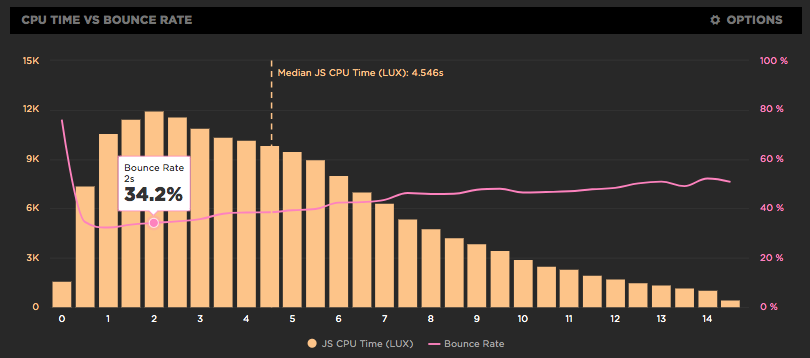
LUX is SpeedCurve's real user monitoring product. We launched it two years ago with four dashboards: Live, Users, Performance, and Design. Today we've added two more LUX dashboards: JavaScript and JS Errors. These new dashboards let you see the impact JavaScript has on your site and on your users with new metrics, including First CPU Idle and First Input Delay, and new features, such as correlation charts that show you how CPU time correlates with bounce rate.
JavaScript dominates browser CPU
Loading scripts asynchronously is critical for getting pages to render more quickly. We care about rendering because that's what users see; if rendering is slow users have a negative experience. But it's not just about what users see - how the site feels is also important. That's why we focus so much on CPU time. If the CPU is blocked, then browsers are delayed responding to user interactions like scrolling and clicking on links. In other words, the page feels janky. And what consumes the most CPU in browsers? You guessed it: JavaScript!
New LUX metrics
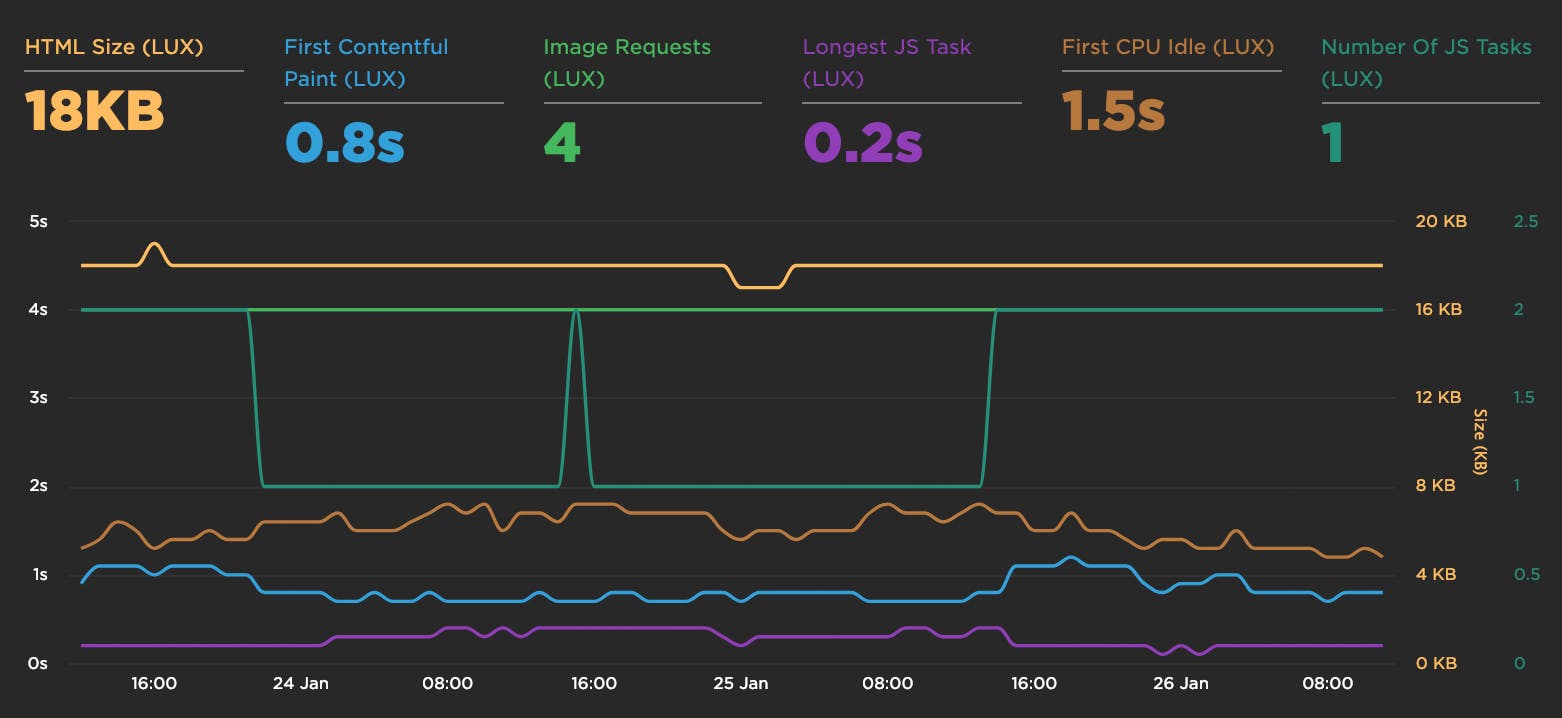
Over the winter holiday we added a bunch of new metrics to LUX:
- First Contentful Paint
- First CPU Idle
- Longest Long Task
- Number of Long Tasks
- Connection type
- HTML transfer size
- Total # of image requests
First Input Delay shows how quickly your site responds to user interaction
We're excited to announce the availability of the First Input Delay metric as part of LUX, SpeedCurve's RUM product.
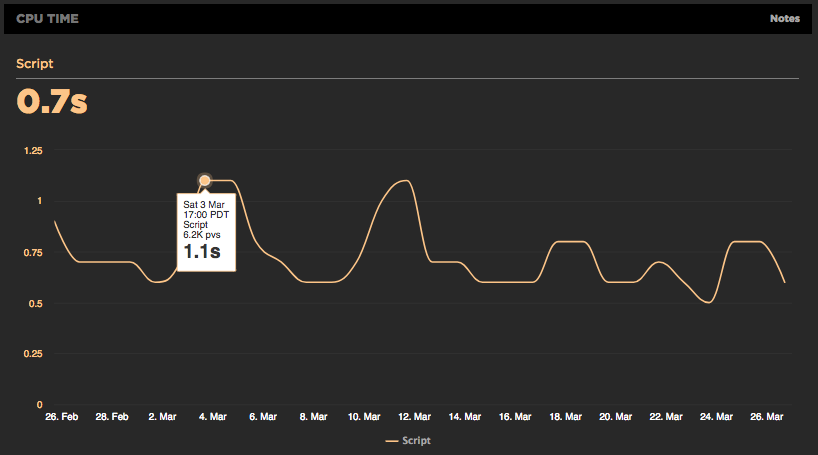
Using RUM to track CPU time
It's exciting working at SpeedCurve and pushing the envelope on performance monitoring to better measure the user's experience. We believe when it comes to web performance it's important to measure what the user sees and experiences when they interact with your site. A big part of our focus on metrics has been around rendering including comparing TTI to FMP, Hero Rendering, and critical blocking resources.
The main bottleneck when it comes to rendering is the browser main thread getting blocked. This is why we launched CPU charts for synthetic testing over a year ago. Back then it wasn't possible to gather CPU information using real user monitoring (RUM), but the Long Tasks API changes that. Starting today, you can track how CPU impacts your users with SpeedCurve's RUM product.
Track down front-end CPU hogs
Often when monitoring and debugging site performance we focus on network activity and individual resources, but what about the CPU? As more and more sites switch to using large Javascript frameworks and manipulating the page using Javascript, the execution time this code takes and the available CPU can instead become the performance bottleneck.
CPU usage for all Chrome tests
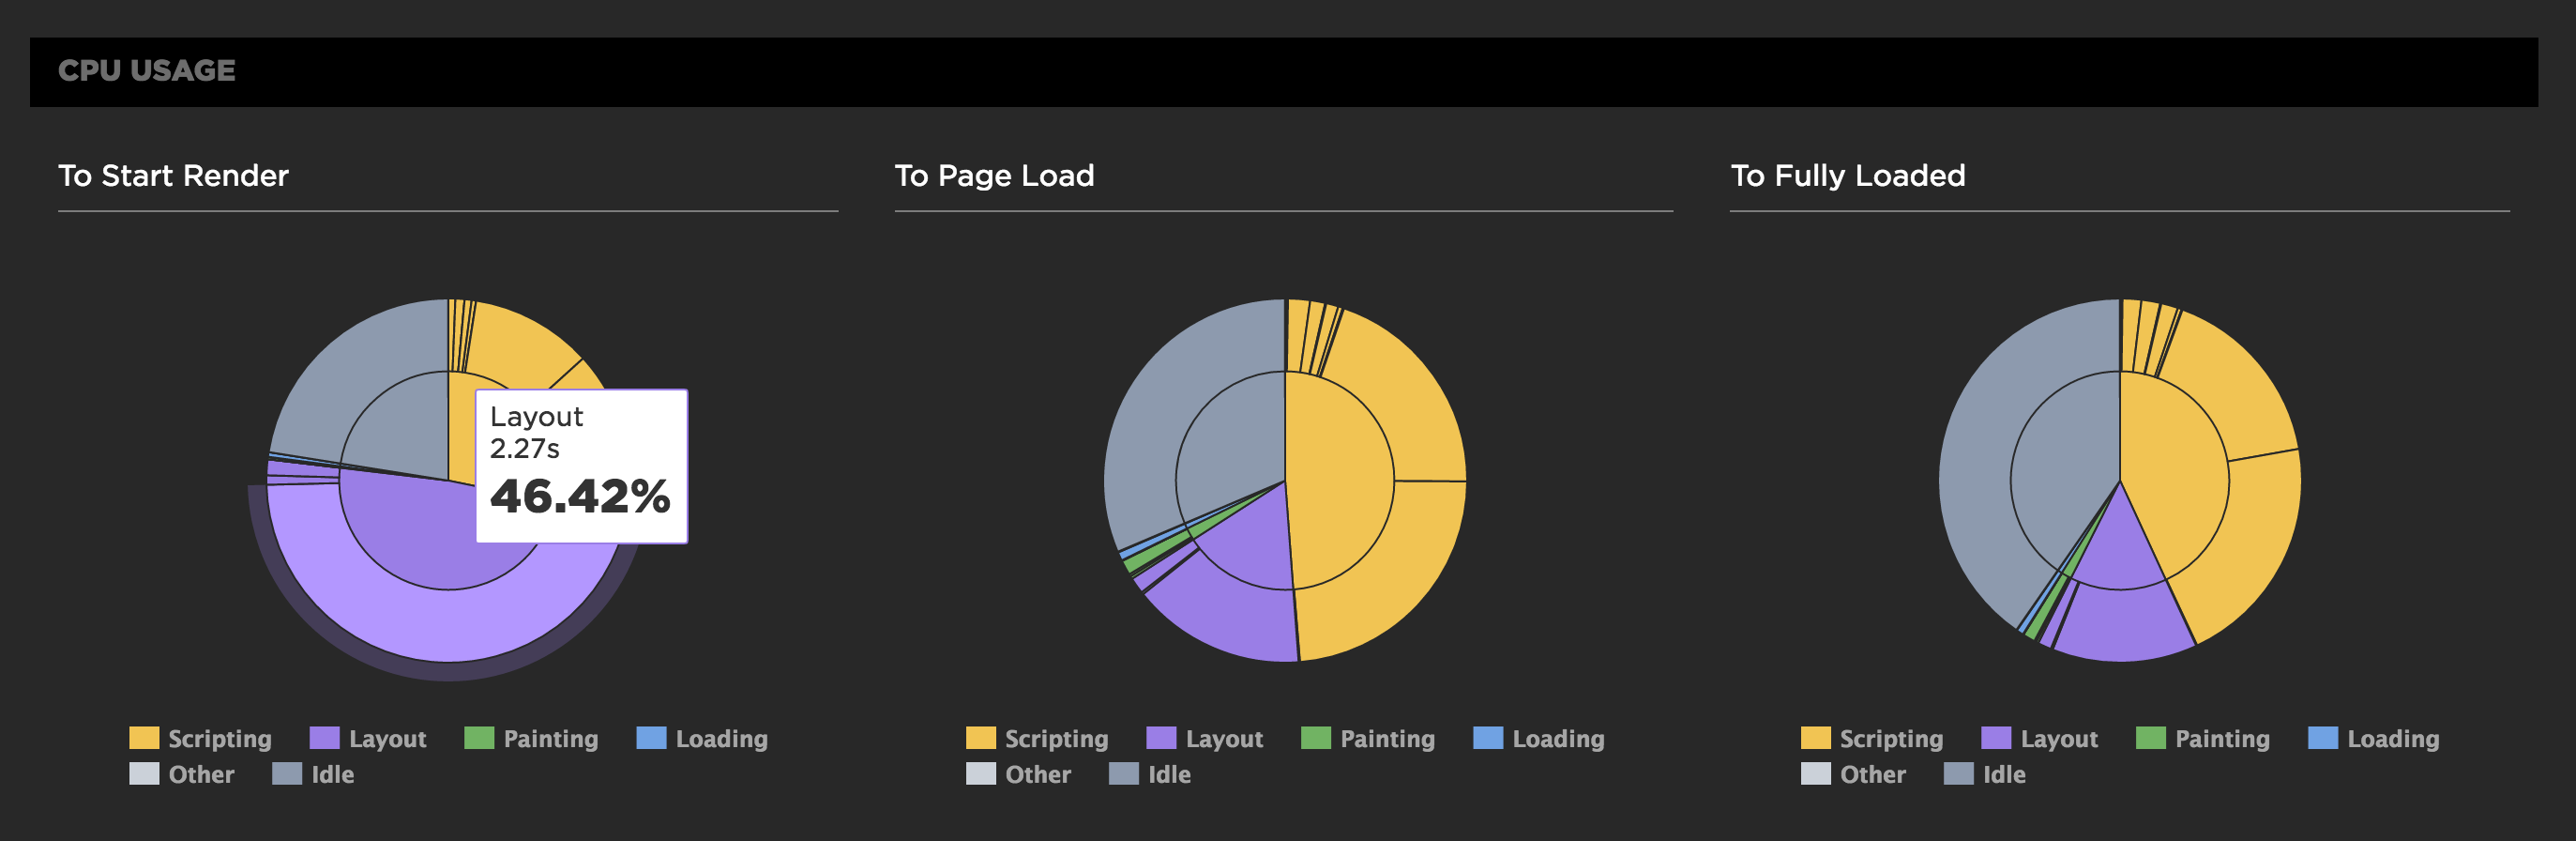
For any of SpeedCurve's Chrome-based tests, including emulated devices, we capture the Chrome Dev Tools timeline. From the browser main thread usage in the timeline we extract how busy the CPU is and what it's spending time on. Is it busy executing Javascript functions or busy laying out elements and painting pixels?
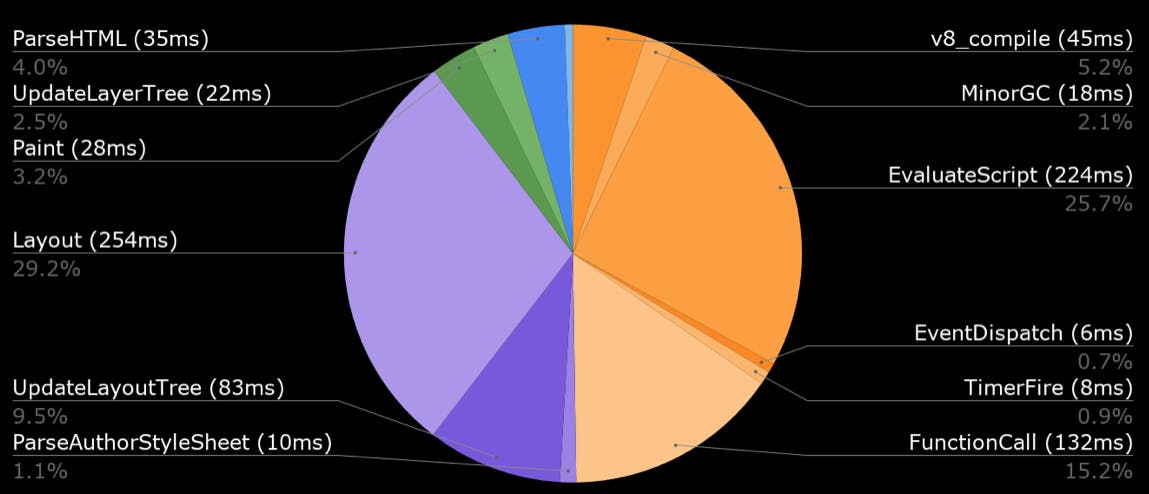
We also measure the CPU usage to different key events in the rendering of the page. SpeedCurve's focus is on the user experience and getting content in front of people as fast as possible, so we show you what the CPU is doing up till the page starts to render. This reflects CPU usage during the browser critical rendering path and can highlight various issues. If there's lots of CPU idle time then you're not delivering your resources efficiently. You want to get the CPU busy nice and early rendering the page, rather than sitting idle waiting for slow resources.
In the test below we see in the first pie chart that the CPU is spending a lot of time on layout up to the start render event, which is quite a different picture from the Fully Loaded CPU usage.