SpeedCurve is now part of the Embrace family! There are no changes to how you use our products. Our founder Mark shares what this means...
15 page speed optimizations that sites ignore (at their own risk)

A recent analysis of twenty leading websites found a surprising number of page speed optimizations that sites are not taking advantage of – to the detriment of their performance metrics, and more importantly, to the detriment of their users and ultimately their business.

I spend a lot of time looking at waterfall charts and web performance audits. I recently investigated the test results for twenty top sites and discovered that many of them are not taking advantage of optimizations – including some fairly easy low-hanging fruit – that could make their pages faster, their users happier, and their businesses more successful.
More on this below, but first, a few important reminders about the impact of page speed on businesses...
Performance audit: Lego.com

I love LEGO. My kids love LEGO, too, which means that every year I find myself spending a fair bit of time on the LEGO website during the holidays. So I thought it would be fun to spend some time poking around behind the scenes and give the site a holiday performance audit. Keep reading to find out what I learned, and some lessons you may want to apply to your own pages.
Industry page speed benchmarks (March 2022)
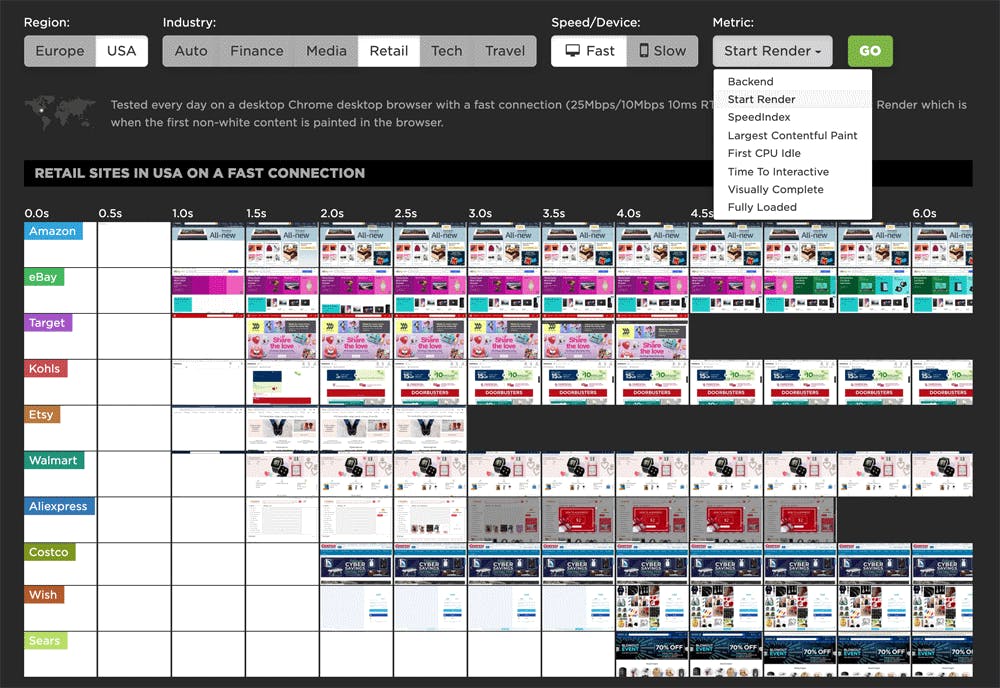
Page Speed Benchmarks is an interactive dashboard that lets you explore and compare web performance data for leading websites across several industries – from retail to media – over the past year. This dashboard is publicly available (meaning you don't need a SpeedCurve account to explore it) and is a treasure trove of meaningful data that you can use for your own research.
The dashboard allows you to easily filter by region, industry, mobile/desktop, fast/slow, and key web performance metrics, including Google's Core Web Vitals. (Scroll down to the bottom of this post for more testing details.)
At the time of writing this post, these were the home pages with the fastest Start Render times in key industries:
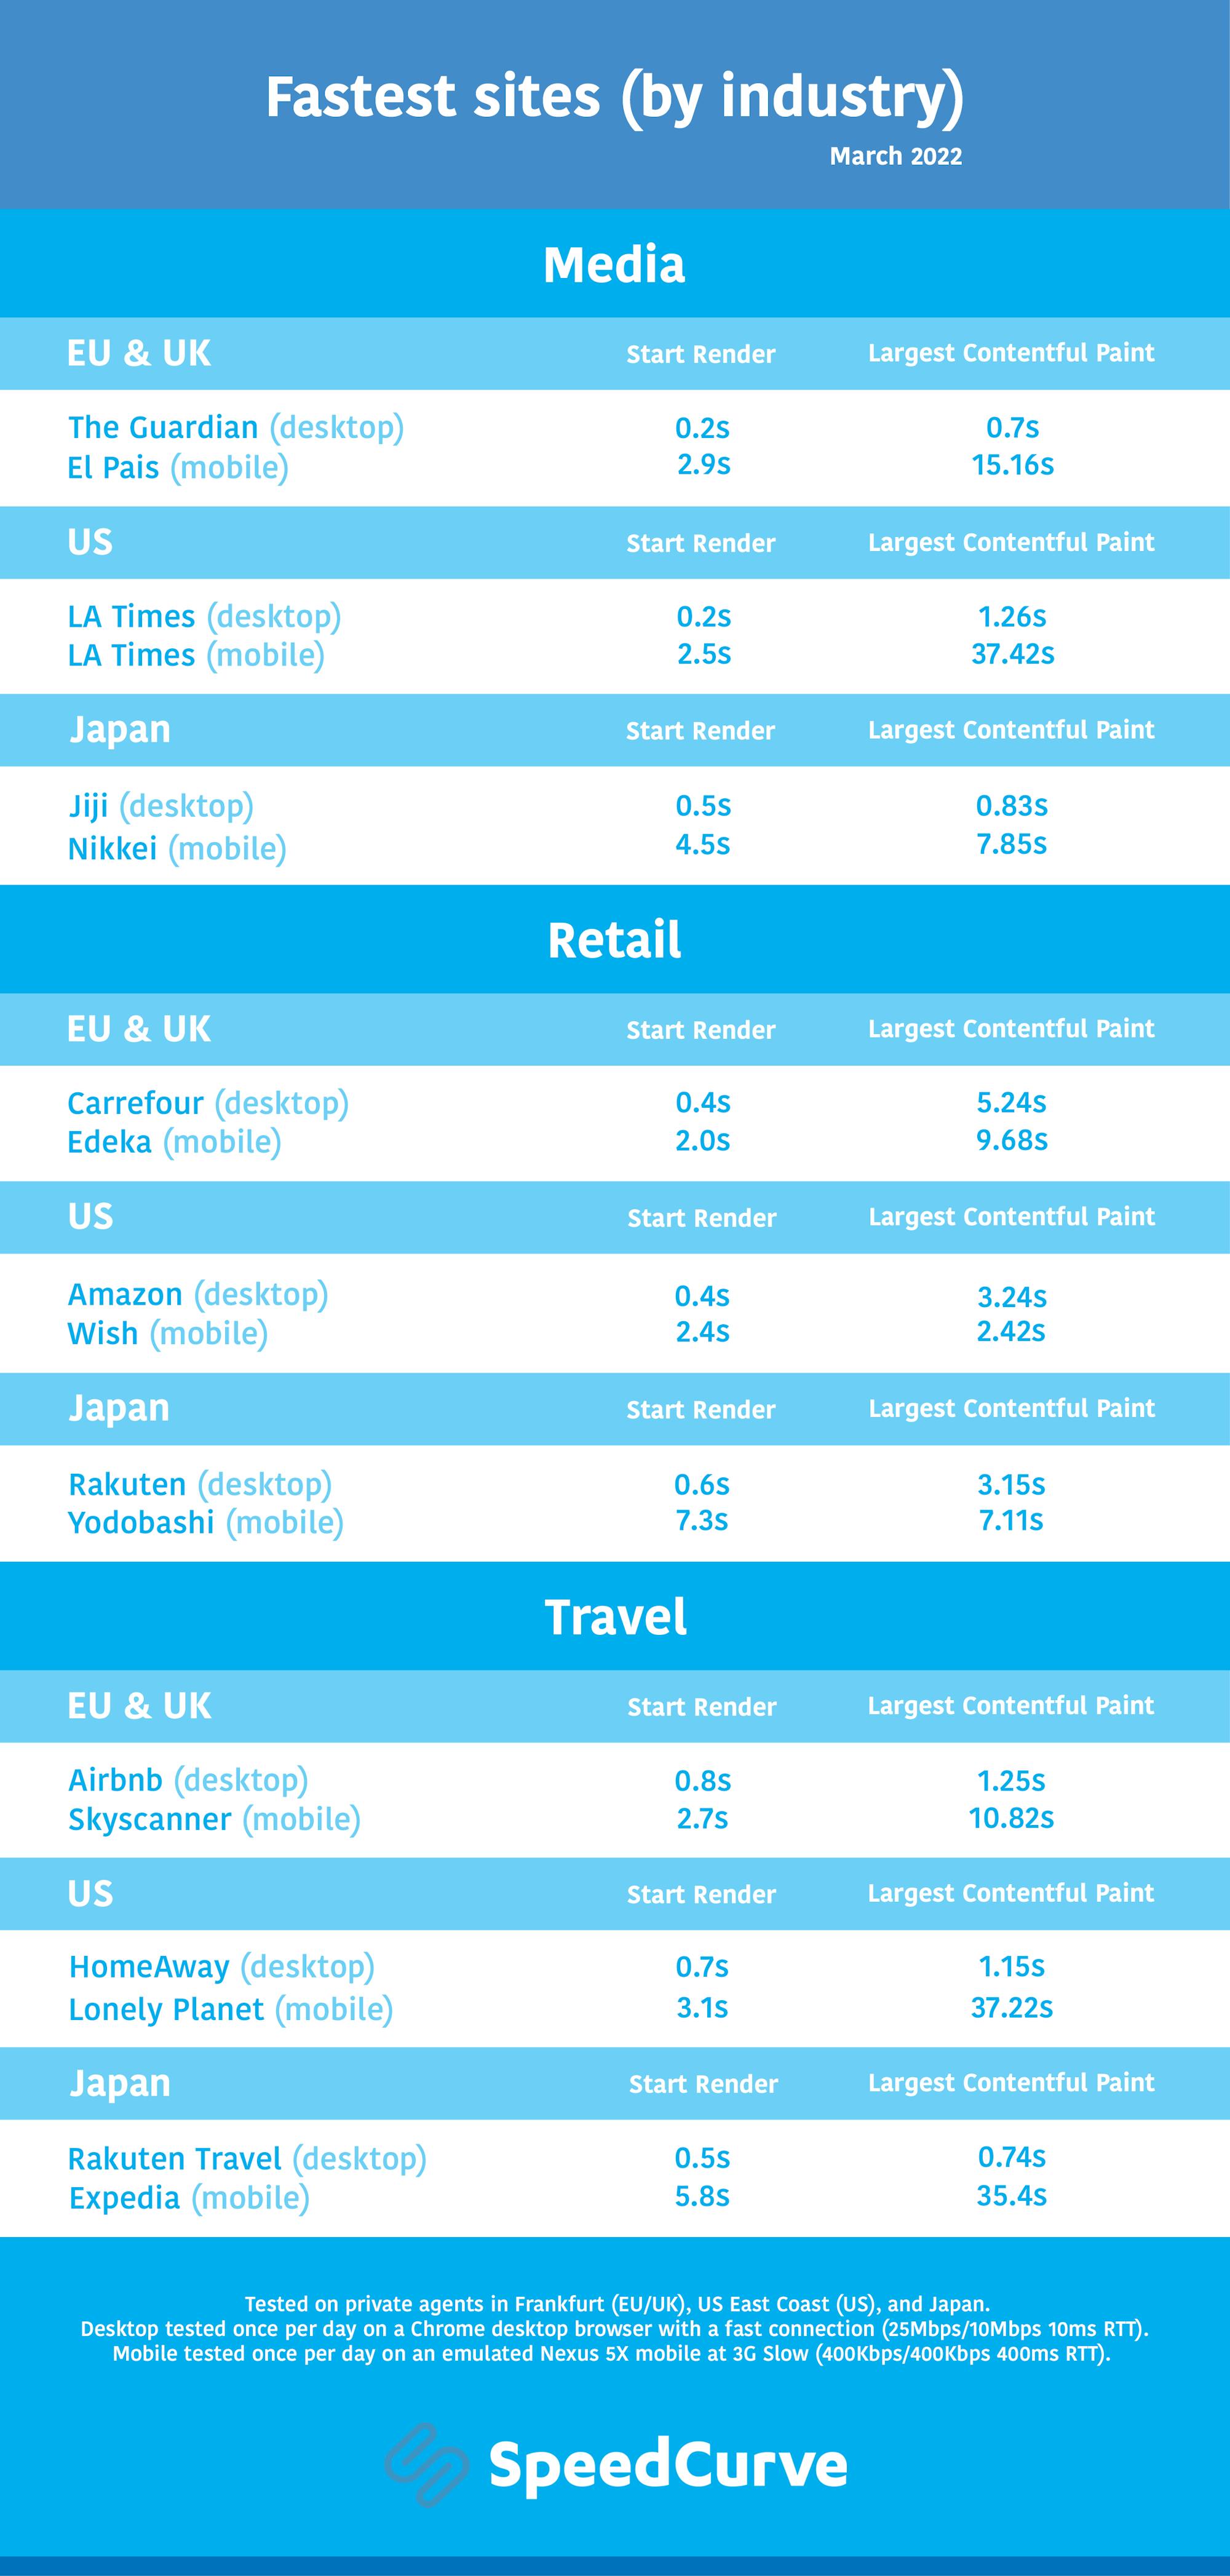
As you can see, I've included Largest Contentful Paint alongside Start Render in this chart, for reasons I explain below.
Introducing a new resource for the performance community: Page Speed Benchmarks!
Here are some common questions I’m asked when I talk with people about performance:
- Which metrics should I care about?
- What types of devices and connections should I test on?
- Which third parties should I be most concerned about?
- How fast should I be?
- What are some good sites I can use for benchmarking?
Today, I’m very excited to announce the release of a new project that helps answer those questions – and more!
Page Speed Benchmarks is an interactive dashboard that lets you explore and compare web performance data for leading websites across several industries – from retail to media.
With Page Speed Benchmarks, you can do things like:
- See what the different metrics actually mean in terms of user-perceived performance
- Compare how the same page renders on fast vs slow devices and connections
- Understand what makes fast sites fast (and slow sites slow)
- Get insights into how third parties can perform on different sites
- Identify sites you can use for your own competitive benchmarking
If you already like tools like the HTTP Archive, I think you'll love how you can use Page Speed Benchmarks to complement the insights you're already getting. Keep reading to find out how we set up these benchmarks, and how you can mine our test data – even if you're not a SpeedCurve user – for your own performance research.
