SpeedCurve is now part of the Embrace family! There are no changes to how you use our products. Our founder Mark shares what this means...
Are your retail landing pages killing conversions?

You've probably started to notice retail campaigns for Halloween, Thanksgiving, and even Christmas! Online campaigns are pricey, so the landing page should be the MOST scrutinized page of your site — but too often it's an afterthought.
I tracked the rendering times of campaign landing pages for leading retailers to see how they compare — who's fast, who's slow, and what's causing their page speed bottlenecks.
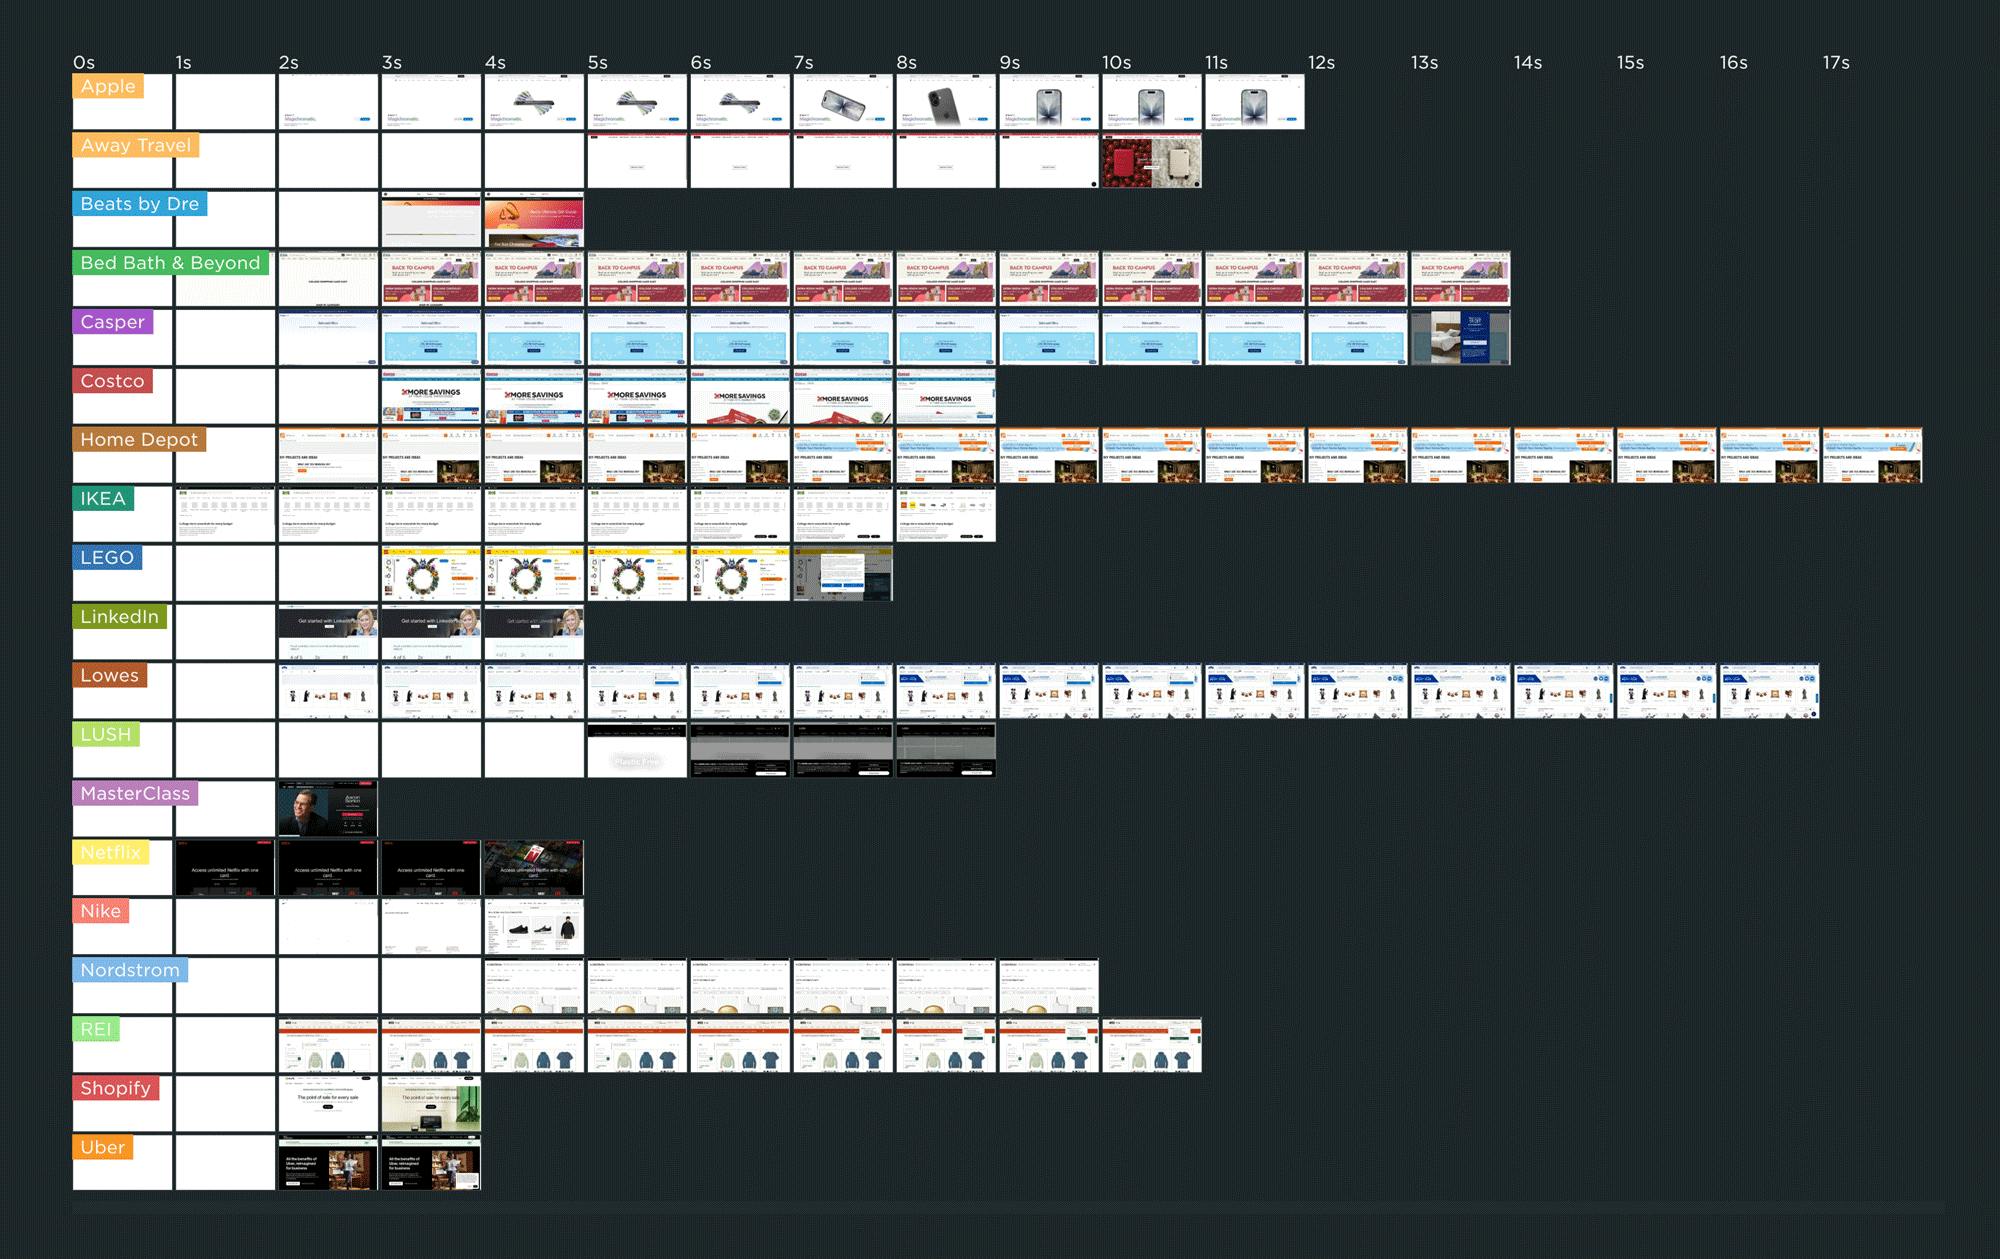
As you can see in this competitive benchmarking leaderboard, rendering speeds varied across pages ranging from Apple to Uber. The fastest campaign page — which belonged to IKEA.com — started to render in about 1 second, which is great to see.
But for many of the other pages, it was common to wait 3 or 4 seconds — or longer! — to see meaningful content.
In this post, we'll cover:
- Why the speed of your campaign landing pages matters... possibly even more than most of the other pages on your site
- Why performance issues on campaign landing pages often go unnoticed
- Common performance issues on landing pages
- A deep dive into the landing page for one of the sites I tracked
- Who should be responsible for the performance of the landing pages on your site?
- What you can do to make sure your campaign landing pages stay fast
How do Long Animation Frames affect user behavior?

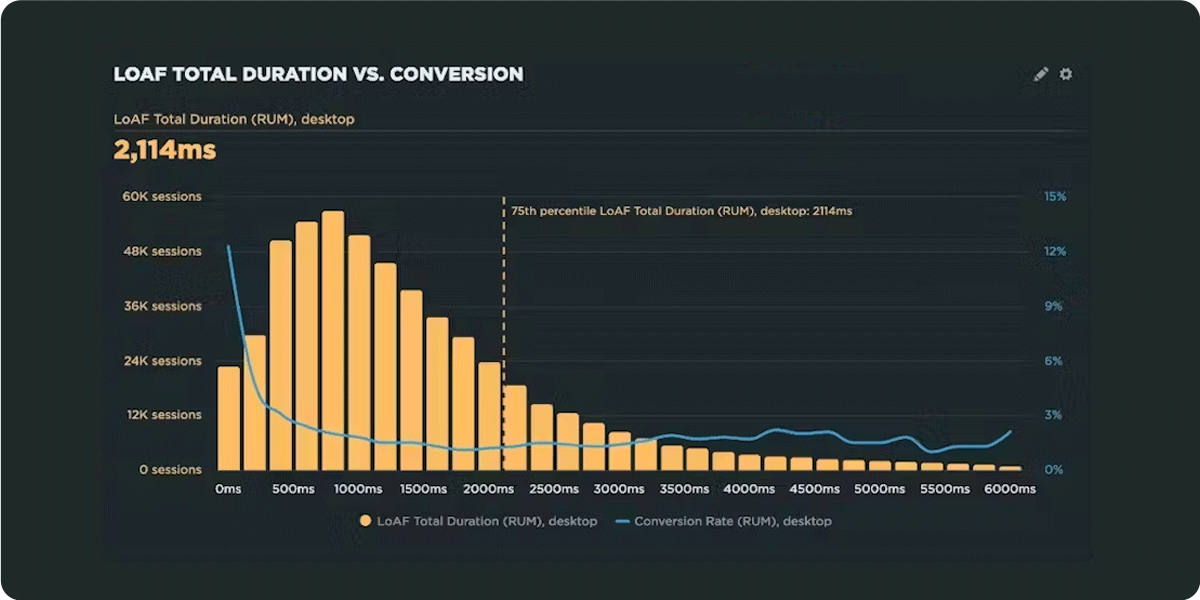
What's the point of a performance metric that doesn't align with user behavior – and ultimately business outcomes? Looking at four different retail sites, we compared each LoAF metric for desktop and mobile and correlated it to conversion rate. We saw some surprising trends alongside some expected patterns.
We recently shipped support for Long Animation Frames (LoAF). We're buzzing with excitement about having better diagnostic capabilities, including script attribution for INP and our new experimental metric, Total Blocking Duration (TBD).
While Andy has gone deep in the weeds on LoAF, in this post let's put the new set of metrics to the test and see how well they reflect the user experience. We'll look at real-world data from real websites and find an answer to the question: How do Long Animation Frames affect user behavior?
The Definitive Guide to Long Animation Frames (LoAF)

With Long Animation Frames (commonly referred to as LoAF, pronounced 'LO-aff') we finally have a way to understand the impact of our code on our visitors' experiences.
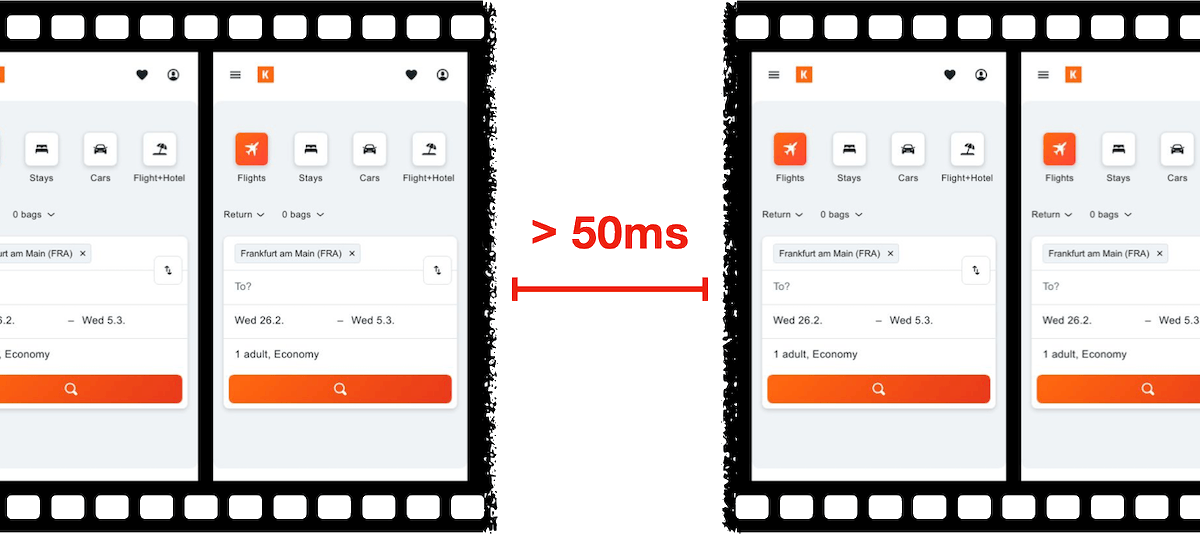
Long Animation Frame – a frame that took longer then 50ms from its start to when it started painting
LoAF allows us to understand how scripts and other tasks affect both hard and soft navigations, as well as how scripts affect interactions. Using the data LoAF provides, we can identify problem scripts and target changes that improve our visitors' experience. We can also finally start to quantify the impact of third-party scripts as they execute in our visitors' browsers.
Keep reading to learn:
- Why animation frame rate matters
- Anatomy of a Long Animation Frame
- Key LoAF milestones and what we can do with milestone data
- Script attribution (and why script details might sometimes be unavailable)
- How to match script data to Interaction to Next Paint, including sub-parts
- How to capture LoAF entries
- Getting started with LoAF
- LoAF support in SpeedCurve
NEW! Monitor Long Animation Frames and get to the bottom of your JavaScript issues
CPU consumption by the browser is one of the main causes – if not the number one cause – of a poor user experience. The primary culprit? JavaScript execution. Now you can use SpeedCurve to monitor Long Animation Frames (LoAFs) and fix the third parties and other scripts that are hurting your page speed.
Until recently, we've had little evidence from the field that definitively attributes the root cause of rendering delays. While JavaScript Long Tasks gave us a good indication that there were blocking tasks affecting metrics such as Interaction to Next Paint and Largest Contentful Paint, there was no way to attribute the work or understand how it was ultimately affecting rendering.
Fortunately, we've gotten a lot of help from Chrome in improving the attribution – and ultimately the actionability – of the data we collect in the field with RUM. The introduction of the Long Animation Frames API (LoAF) not only gives us better methods for understanding what's happening on the browser's main thread, in some cases it also gives us attribution to both first- and third-party scripts that occur during a LoAF.
This has been a highly anticipated addition to SpeedCurve, which is available for all our RUM users today. This post covers what's new in the product and points you to a few new resources to help you get up to speed on all things related to LoAF.
Five ways cookie consent managers hurt web performance (and how to fix them)
Cookie consent popups and banners are everywhere, and they're silently hurting the speed of your pages. Learn the most common problems – and their workarounds – with measuring performance with content manager platforms in place.

I've been spending a lot of time looking at the performance of European sites lately, and have found that the consent management platforms (CMPs) consistently create a false reality for folks when trying to understand performance using synthetic monitoring. Admittedly, this is not a new topic, but I feel it's important enough that it warrants another PSA.
In this post, I will cover some of the issues related to measuring performance with CMPs in place and provide some resources for scripting around consent popups in SpeedCurve.
How to use Server Timing to get backend transparency from your CDN

80% of end-user response time is spent on the front end.
That performance golden rule still holds true today. However, that pesky 20% on the back end can have a big impact on downstream metrics like First Contentful Paint (FCP), Largest Contentful Paint (LCP), and any other 'loading' metric you can think of.
Server-timing headers are a key tool in understanding what's happening within that black box of Time to First Byte (TTFB).
In this post we'll explore a few areas:
- Look at industry benchmarks to get an idea of how a slow backend influences key metrics, including Core Web Vitals
- Demonstrate how you can use server-timing headers to break down where that time is being spent
- Provide examples of how you can use server-timing headers to get more visibility into your content delivery network (CDN)
- Show how you can capture server-timing headers in SpeedCurve
10 things I love about SpeedCurve (that I think you'll love, too)

This month, SpeedCurve enters double digits with our tenth birthday. We're officially in our tweens! (Cue the mood swings?)
I joined the team in early 2017, and I'm blown away at how quickly the years have flown by. Every day, I marvel at my great luck in getting to work alongside an amazing team to build amazing tools to help amazing people like you!
In the spirit of celebration, I thought it would be fun to round up my ten favourite things to do in SpeedCurve (that I think you'll like, too). Keep scrolling to learn how to:
- Fight regressions and stay fast
- See the impact of performance on your business
- Benchmark your site against your competitors
- Track third parties to make sure they're not quietly hurting performance
- Make sure you're tracking the best metrics for your pages
- Get a prioritized list of performance recommendations
- Bookmark and compare synthetic tests and RUM sessions so you can quickly find and fix performance issues
- Run A/B tests so you see how code changes affect your performance and user engagement metrics
- Get customized weekly reports
- Motivate your team with a wall-mounted monitor showing your favourite charts
UPDATE: Bookmark and compare synthetic tests
One of the huge benefits of tracking web performance over time is the ability to see trends and compare metrics. Last year we added new functionality that makes it easy for you to bookmark and compare different synthetic tests in your test history. We recently added some additional enhancements to make comparing tests even easier.
With the 'Compare' feature, you can generate side-by-side comparisons that let you not only spot regressions, but easily identify what caused them:
- Compare the same page at different points in time
- Compare two versions of the same page – for example, one with ads and one without
- Understand which metrics got better or worse
- Identify which common requests got bigger/smaller or slower/faster
- Spot any new or unique requests – such as JavaScript and images – and see their impact on performance
Along the way, we've also made it much more intuitive for you to drill down into your detailed synthetic test results. Let's take a look...
New! Tracking first- and third-party request groups
Getting visibility into the impact that known third parties have on the user experience has long been a focus in our community. There are some great tools out there – like 3rdParty.io from Nic Jansma and Request Map from Simon Hearne – which give us important insight into the complexity involved in tracking third-party content.
When we released our re-imagined Third Party Dashboard last year, we were excited to be providing site owners with another great tool for managing the unmanageable. Among other things, we took an approach that included:
- grouping requests,
- exposing Long Tasks attributed to third parties, and
- tracking blocking CPU time.
This provided even more insight into the different ways JavaScript could be causing real headaches for users.
We received a lot of feedback from our customers, who loved the new third-party functionality but REALLY wanted to see similar functionality for their "first party" content as well. We heard this message loud and clear, and today we're happy to announce a few changes to our Synthetic monitoring tool that address this need while preserving the functionality you already know and love.
New! User Happiness metric, CI plugin, and an inspiring third-party success story
Here at SpeedCurve, the past few months have found us obsessing over how to define and measure user happiness. We've also been scrutinizing JS performance, particularly as it applies to third parties. And as always, we're constantly working to find ways to improve your experience with using our tools. See below for exciting updates on all these fronts.
As always, we love hearing from you, so please send your feedback and suggestions our way!

Third party blame game

Our third party metrics and dashboard have had an exciting revamp. With new metrics like blocking CPU, you can now see exactly who is really to blame for a crappy user experience. We've also given you the ability to monitor individual third parties over time and create performance budgets for them.
It's not you, it's me
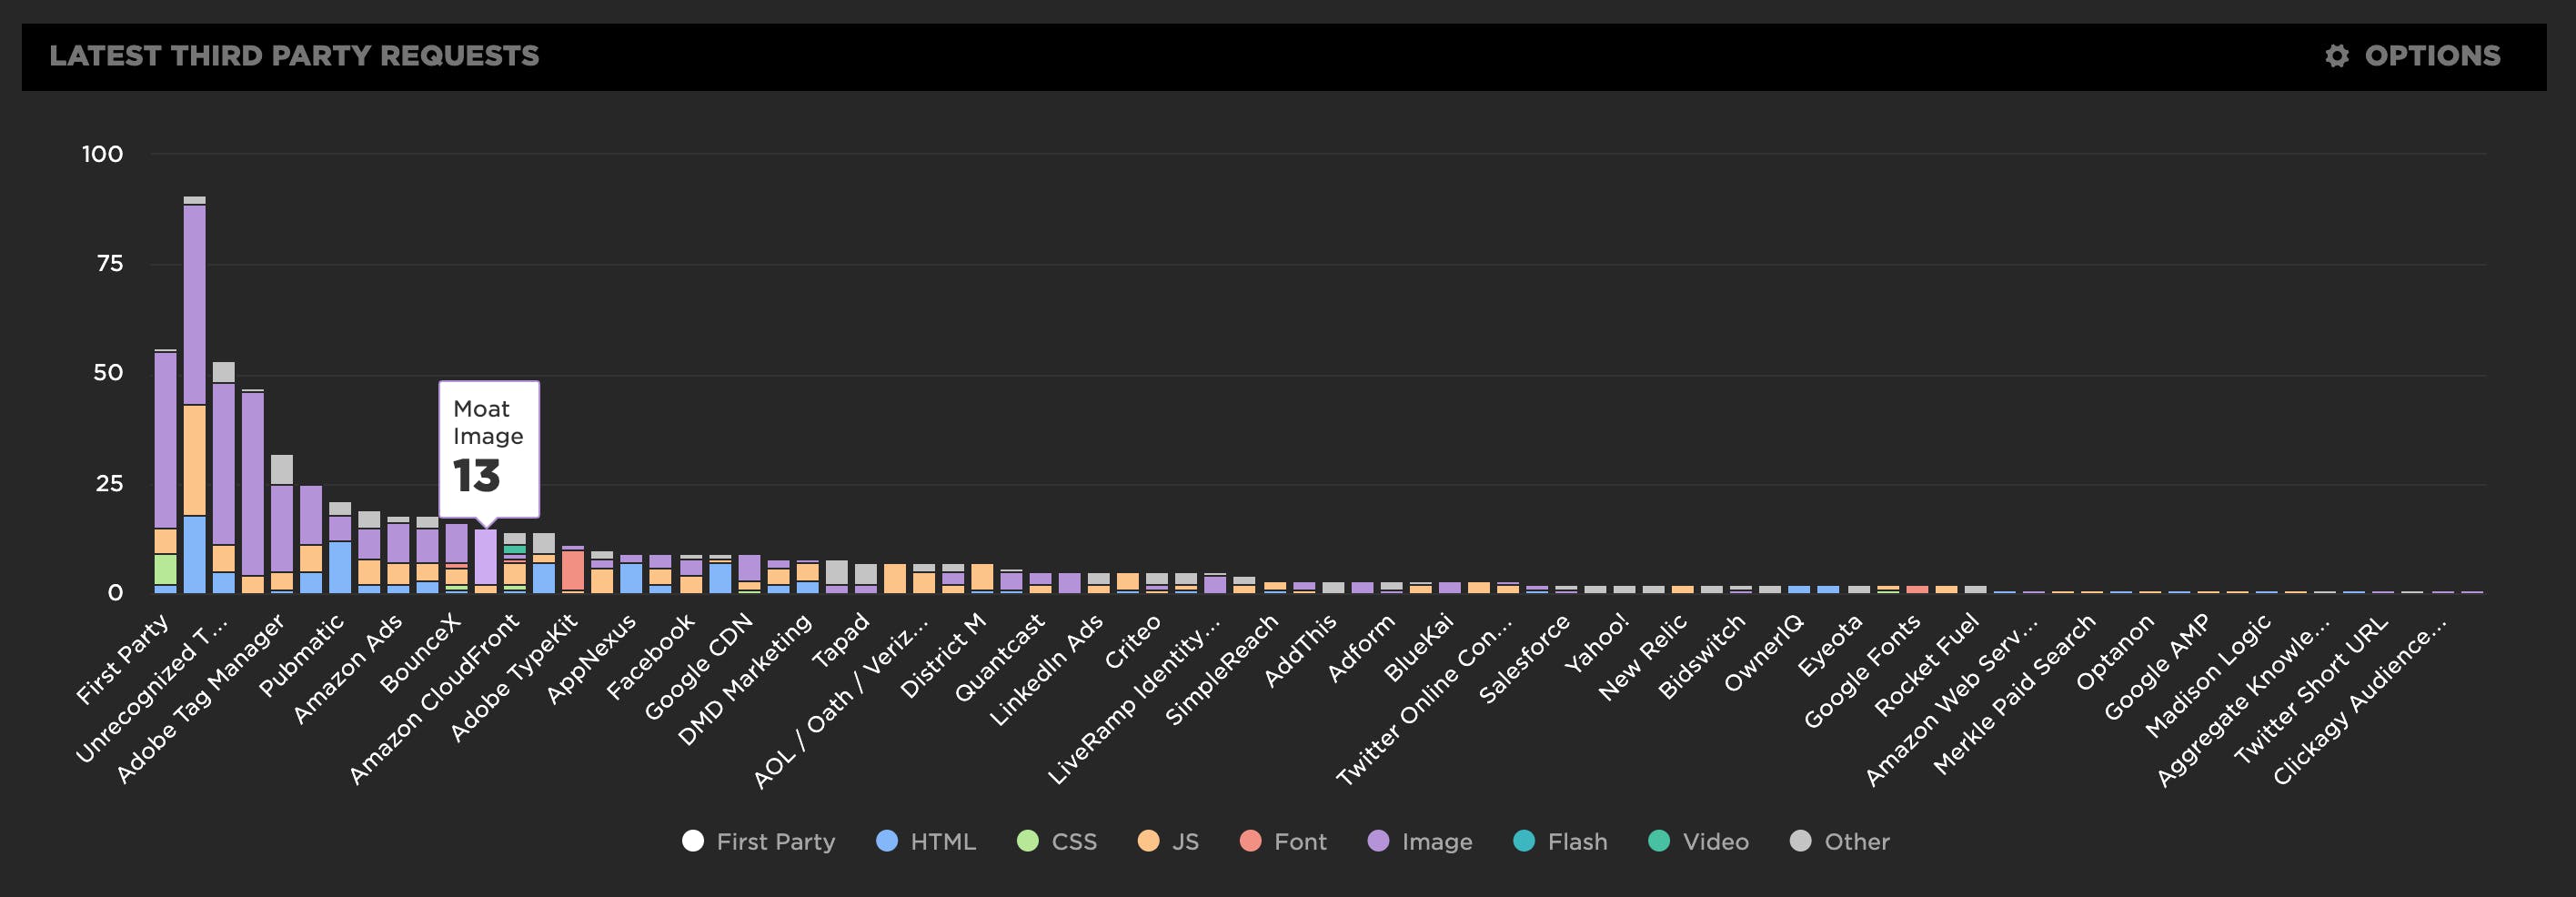
Or is it really you, and not me? We now automatically group all the requests in our third party waterfall chart, letting you easily identify all the third party services used on your website.
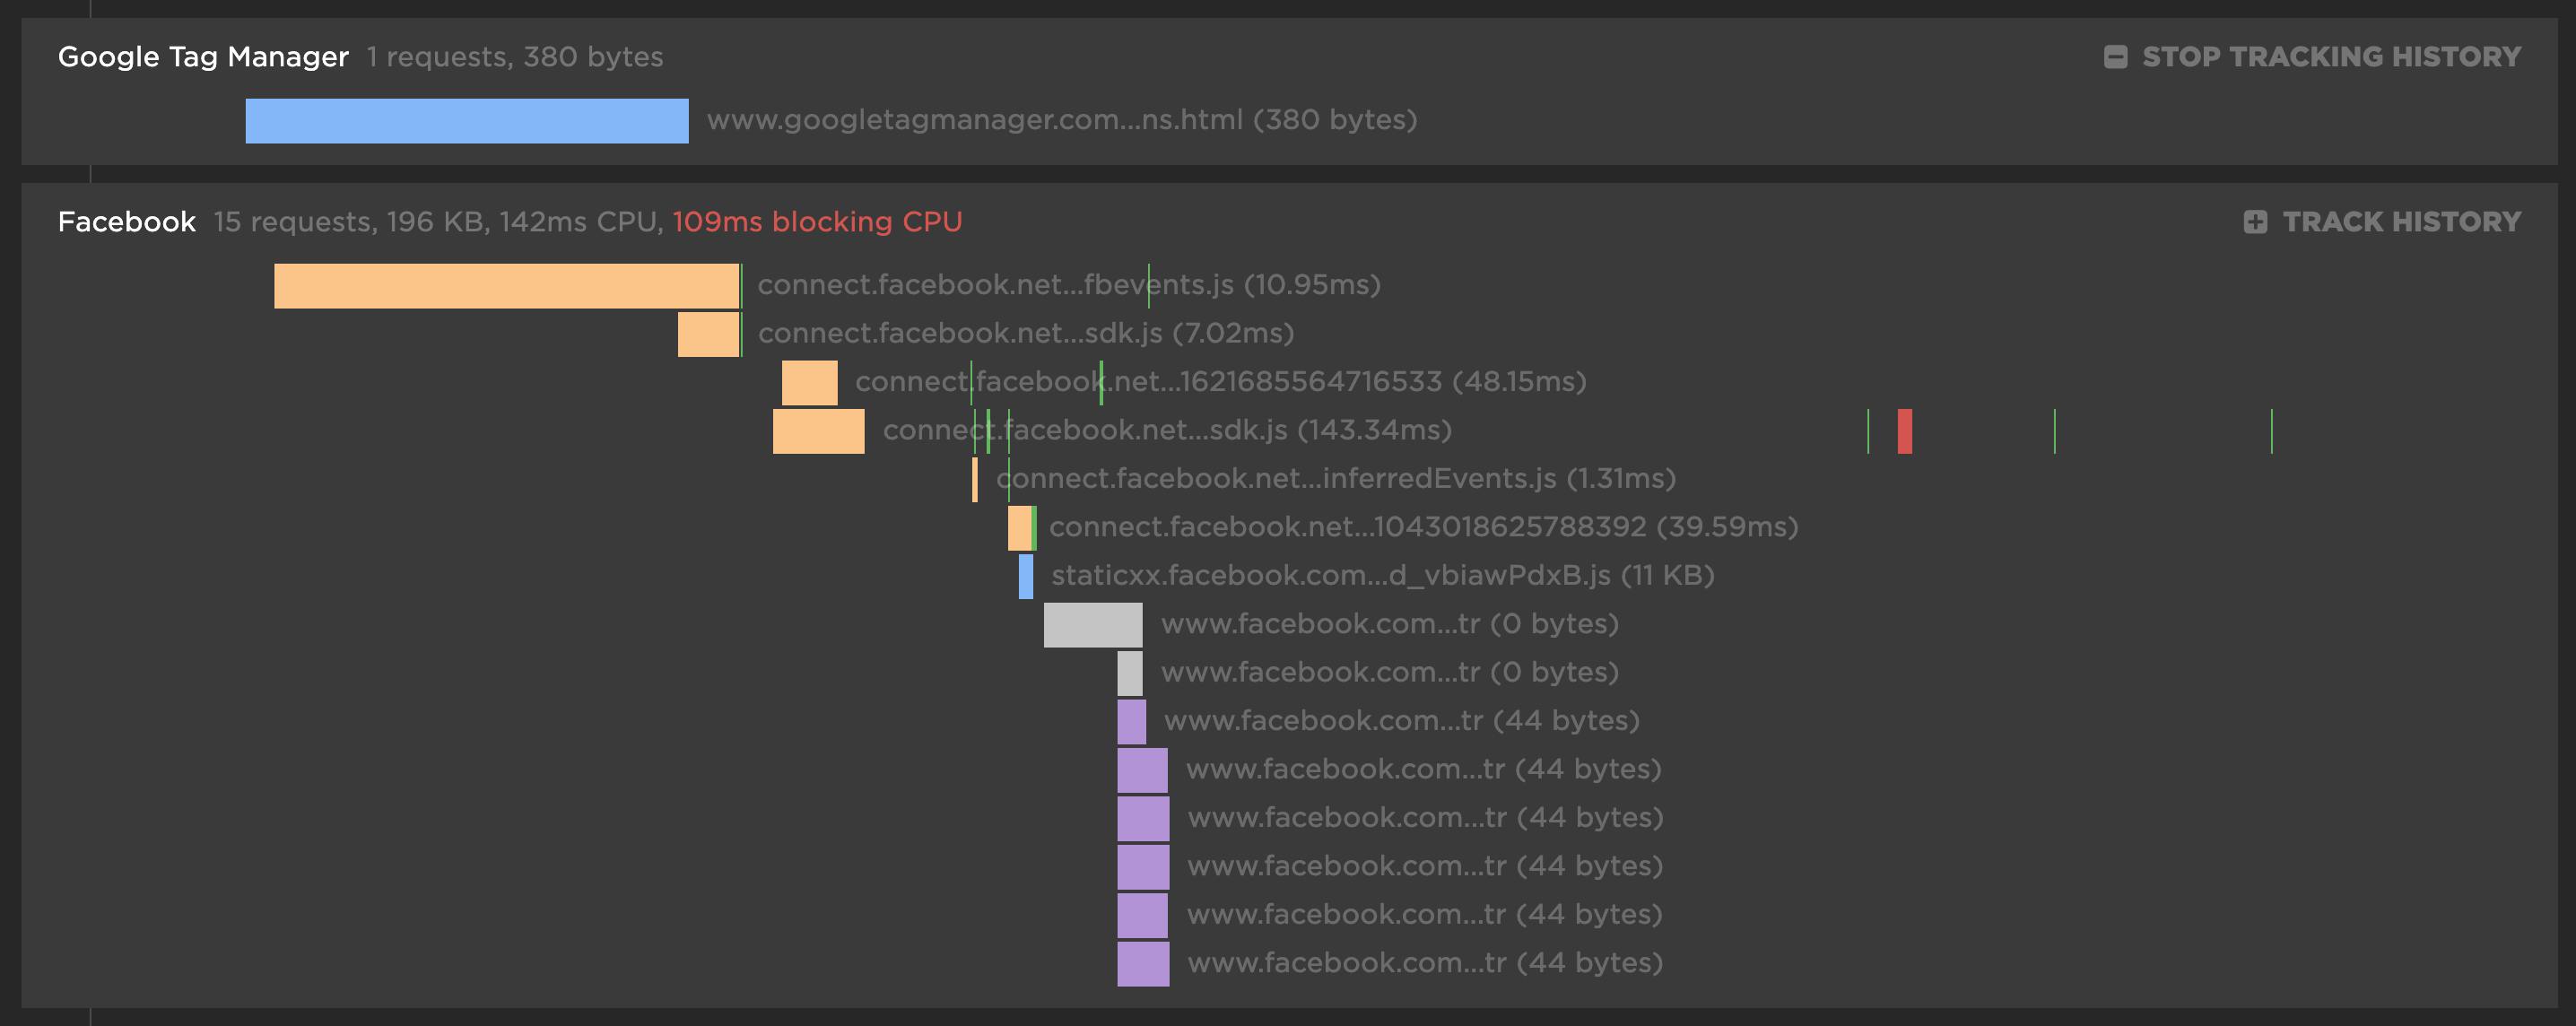
For each third party, you get the number of requests and size for each content type. There's also a first party comparison you can toggle on/off to see what proportion of your requests come from first party vs third party.
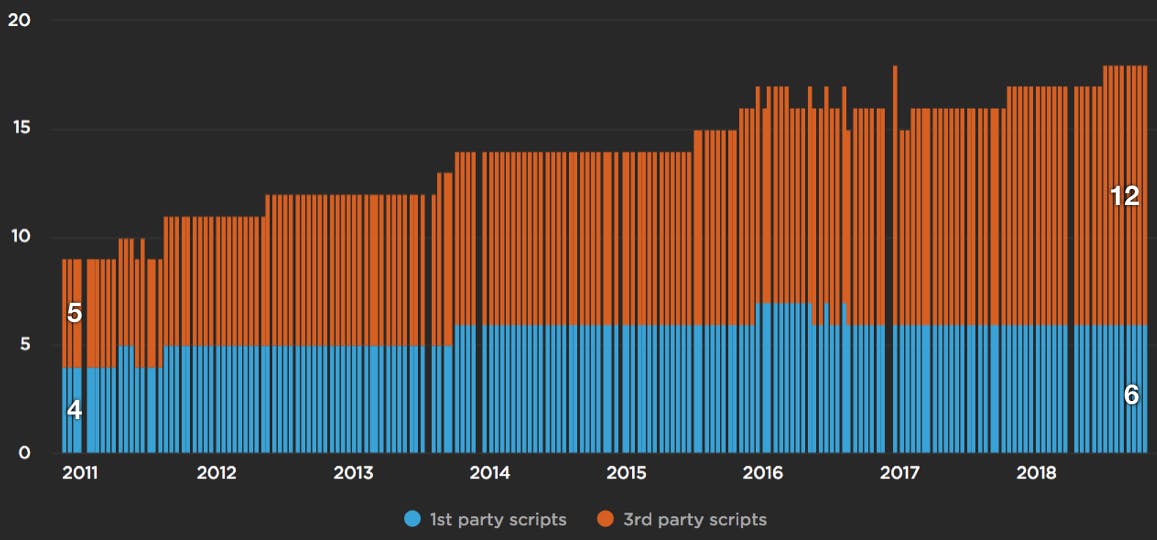
JavaScript growth and third parties

JavaScript is the main cause for making websites slow. Ten years ago it was network bottlenecks, but the growth of JavaScript has outpaced network and CPU improvements on today's devices. In the chart below, based on an analysis from the HTTP Archive, we see the number of requests has increased for both first and third party JavaScript since 2011.
UX Focus for Waterfalls and Third Parties
At SpeedCurve, we want to help designers and developers have better insight into the user experience they're delivering. For websites, this means understanding when the critical parts of the page render and what might be blocking rendering.
We've redesigned our waterfall chart to really highlight the relationship between the assets on the page and their affect on the user experience. Now as you move you mouse over the waterfall chart we show you exactly what a user is seeing at that millsecond while the page loads. This makes it much easier to identify any Javascript or CSS that might be blocking the page from rendering. I recently used this new combined waterfall and filmstrip view to identify a common issue with hero images being delayed.
