New! Tracking first- and third-party request groups

Getting visibility into the impact that known third parties have on the user experience has long been a focus in our community. There are some great tools out there – like 3rdParty.io from Nic Jansma and Request Map from Simon Hearne – which give us important insight into the complexity involved in tracking third-party content.
When we released our re-imagined Third Party Dashboard last year, we were excited to be providing site owners with another great tool for managing the unmanageable. Among other things, we took an approach that included:
- grouping requests,
- exposing Long Tasks attributed to third parties, and
- tracking blocking CPU time.
This provided even more insight into the different ways JavaScript could be causing real headaches for users.
We received a lot of feedback from our customers, who loved the new third-party functionality but REALLY wanted to see similar functionality for their "first party" content as well. We heard this message loud and clear, and today we're happy to announce a few changes to our Synthetic monitoring tool that address this need while preserving the functionality you already know and love.
Tracking first vs. third parties
Providing the overall breakdown of first-party versus third-party content remains the key focus of this curated dashboard. We’ve renamed the dashboard to 'First & Third Party' to make that crystal clear.
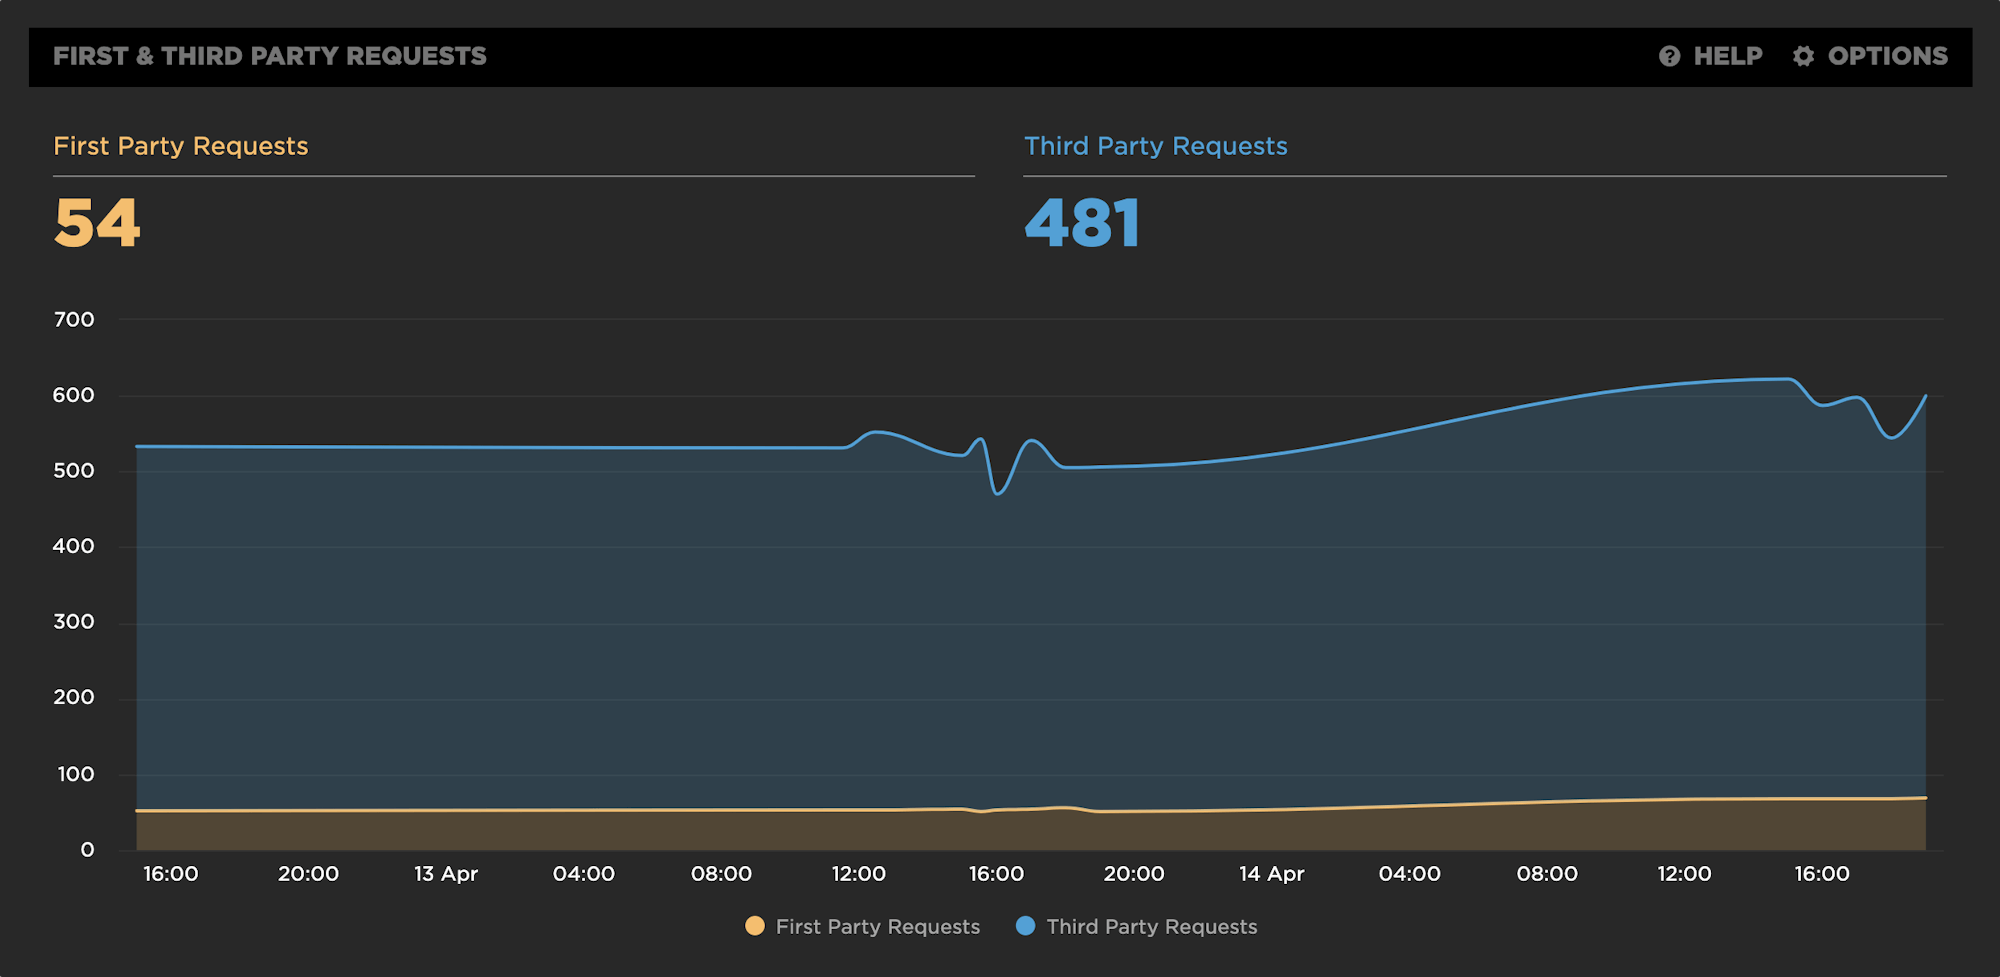
We hear from customers daily who want the ability to create performance budgets specific to first/third-party metrics they were seeing in the dashboard. This option now exists, allowing you to easily track and create a summary view and a performance budget for either party. The metrics included in this summary for both first and third parties are:
- Requests
- Size
- JavaScript CPU, and
- JavaScript Long Task details (count, sum and longest task).
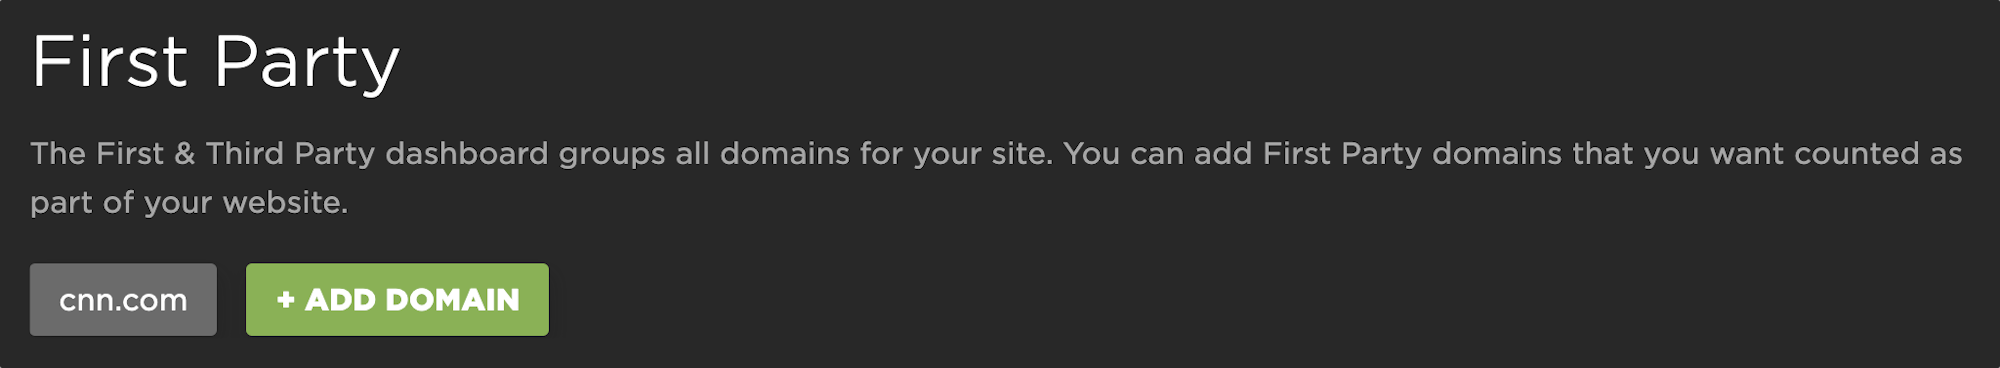
First-party classification will continue to be managed in your settings:
Tracking known third-party requests
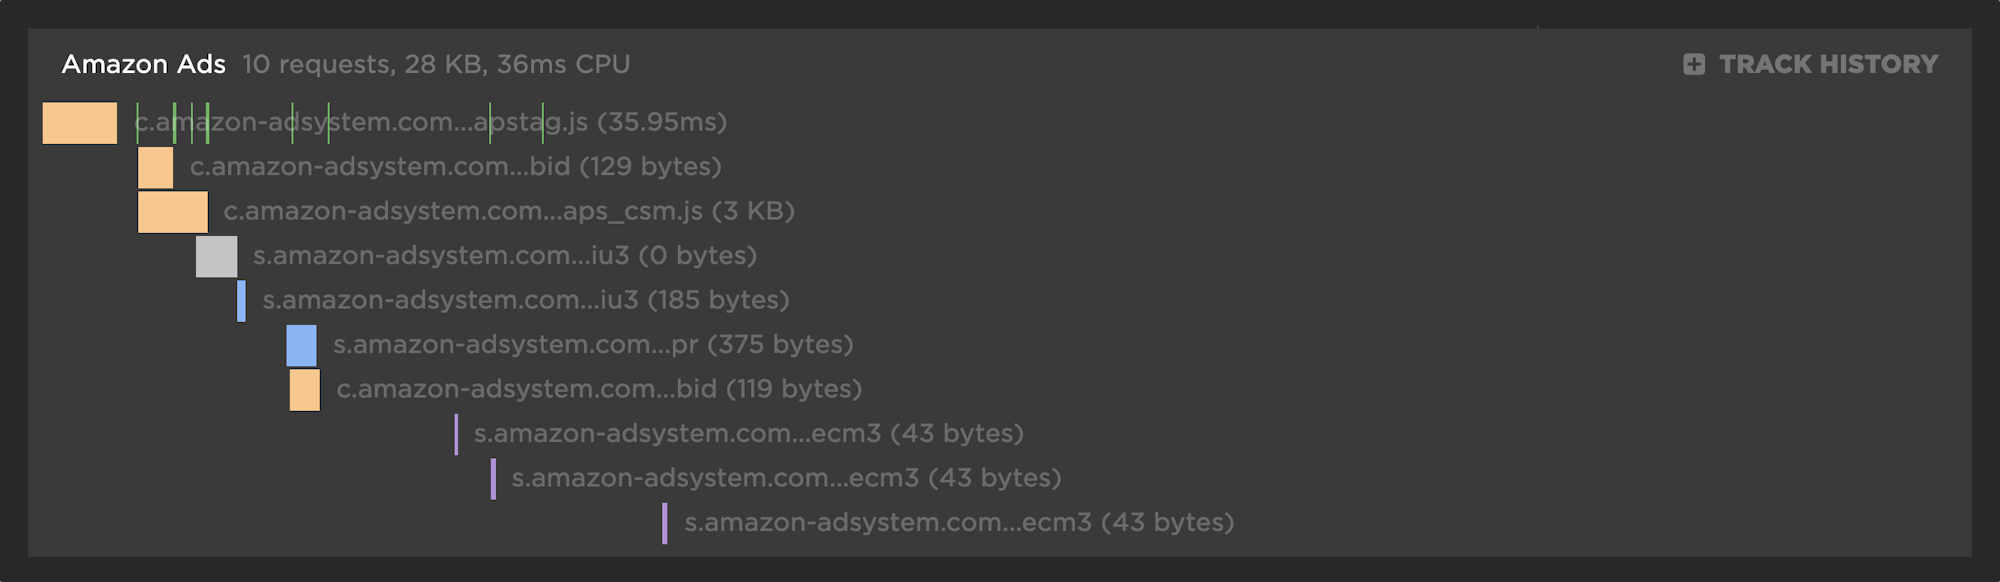
While nothing has really changed here, it's worth another explanation for first-time users. We automatically categorize a number of third-party assets and group those in the waterfall view of the dashboard. You can track any of these groups over time by simply clicking on 'TRACK HISTORY' in the waterfall chart. This will automatically add a new chart to your dashboard, which will trend the Long Tasks, Blocking Requests and Size of that third party. Additionally, you can now use this trended data set in your Favorites dashboards – and yes, you can set performance budgets that are specific to that group.
Tracking custom request groups
Now comes the exciting part! Creating a custom request group empowers you to track the group of resources you care about most, regardless of whether they are a first or third party. The two most common scenarios for tracking custom request groups are classifying unrecognized third parties and tracking specific first party requests.
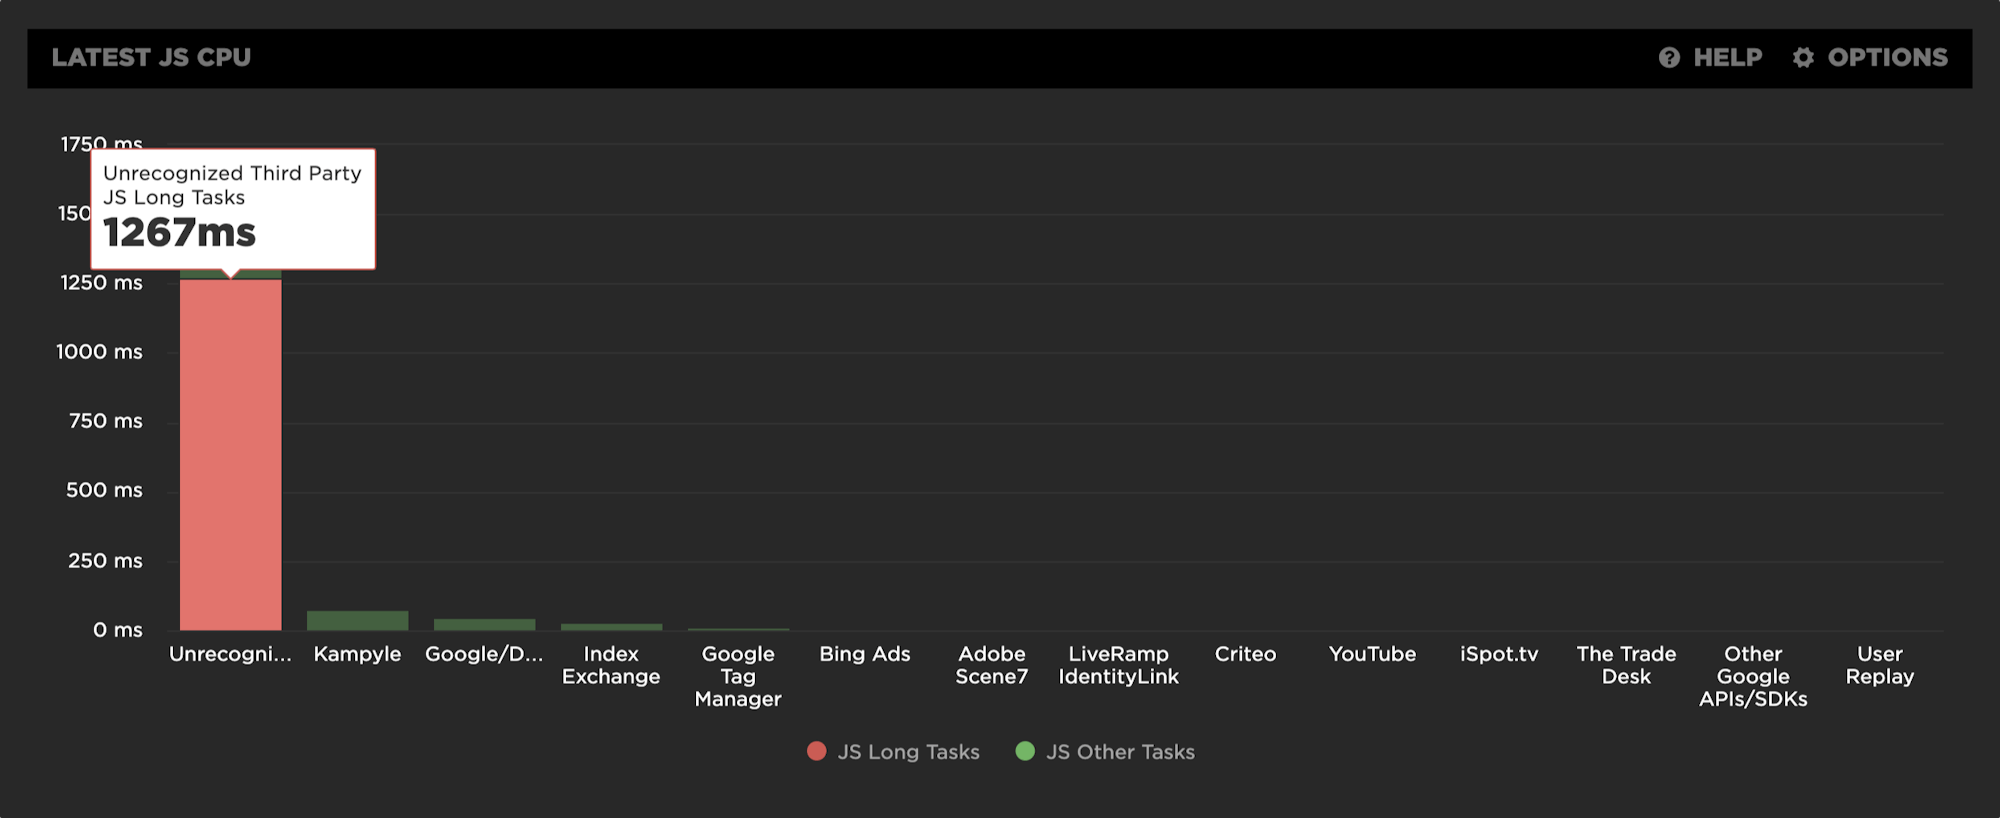
Unrecognized third parties
If you have a domain in the waterfall that we don’t recognize as a third party and you haven't told us belongs in the first-party group, it will show up as "unrecognized". Chances are you'll recognize it and want to group it appropriately.
First-party request groups
A very common request that people have is the ability to create a custom request group so you can track first-party components – such as a custom JavaScript bundle, a set of images, and fonts – or other content you want to manage as a group.
How to manage both of the above use cases
Here's how to manage unrecognized third parties, as well as first-party request groups:
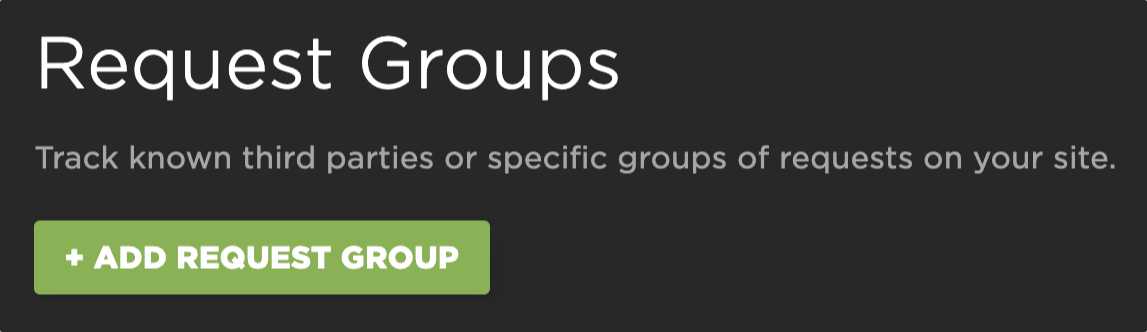
1. Go to 'Request Groups' in your settings:
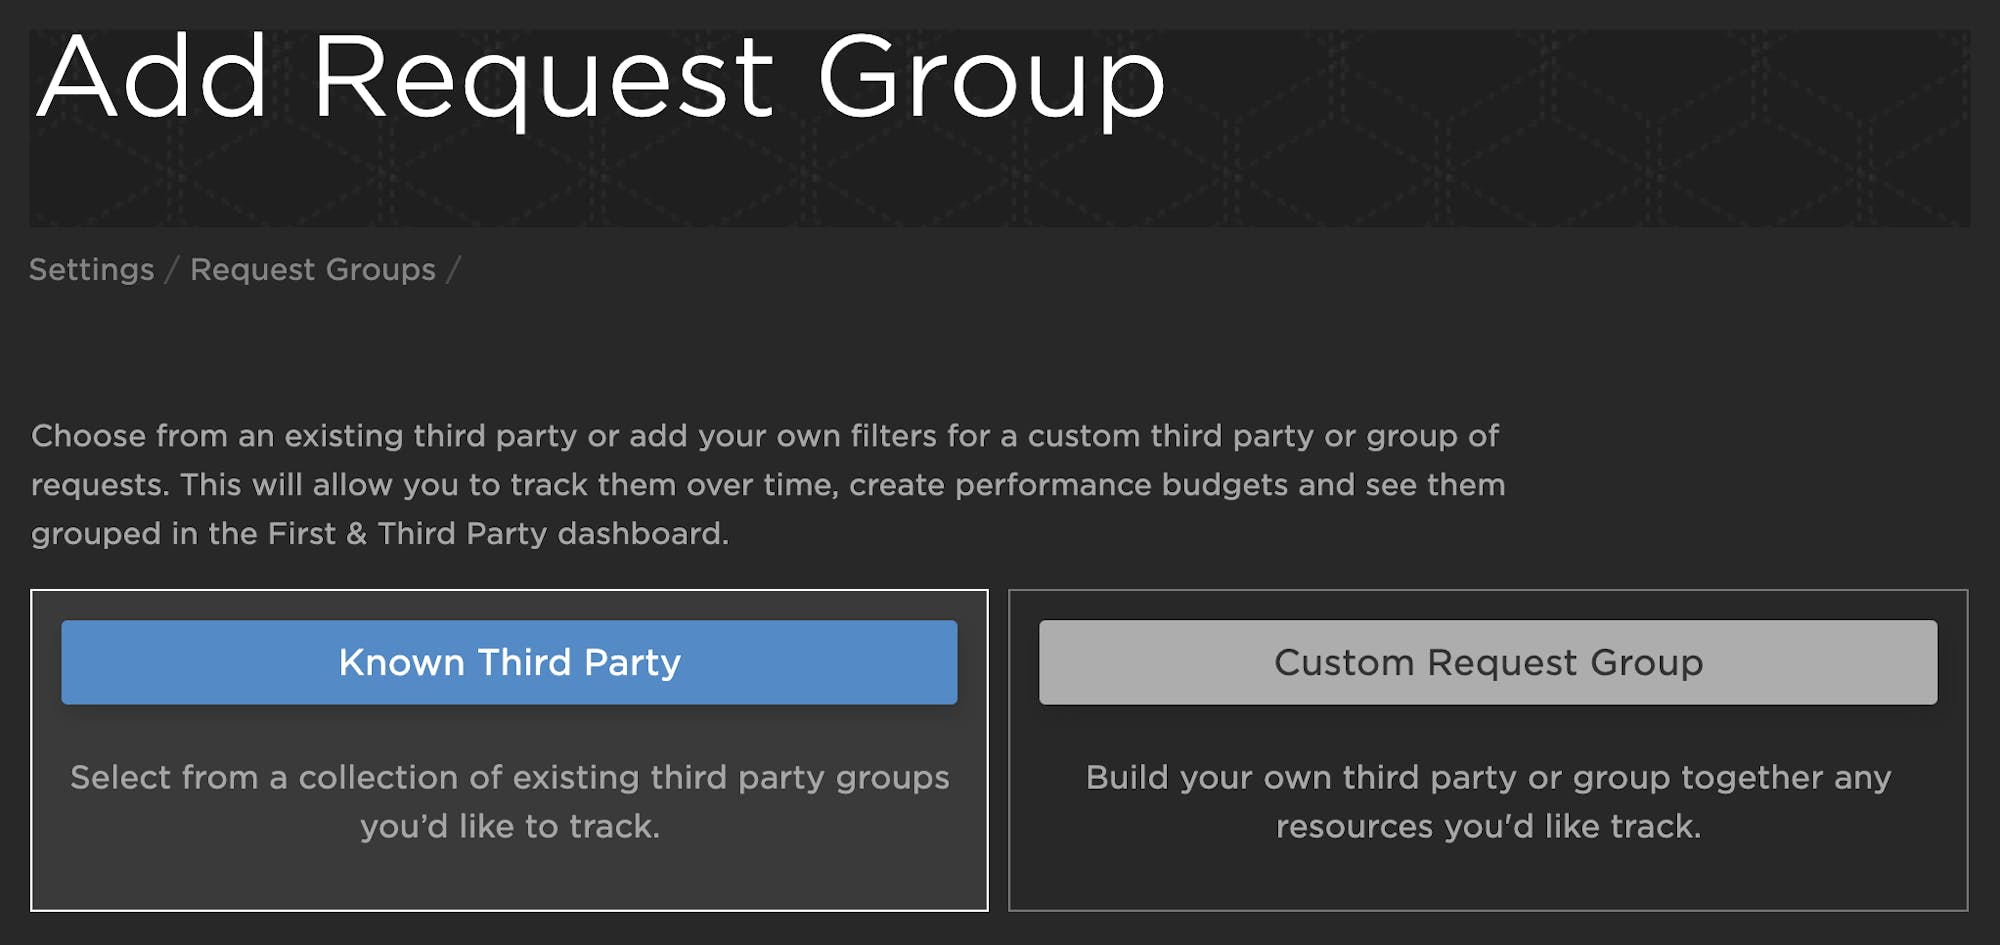
2. When you add a request group, you’ll see the option to add a 'Known Third Party' (discussed above, but also can be managed here) OR a 'Custom Request Group'.
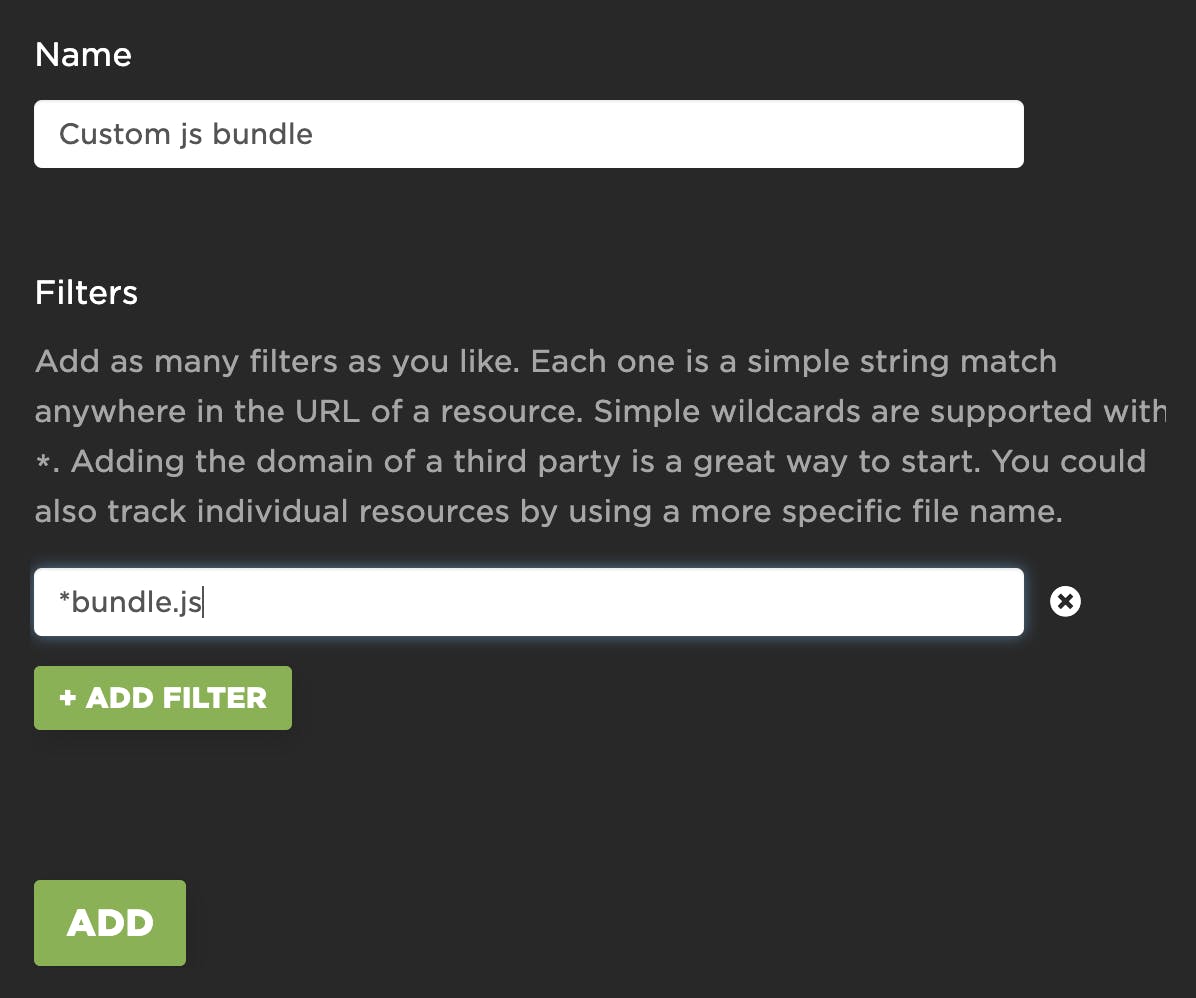
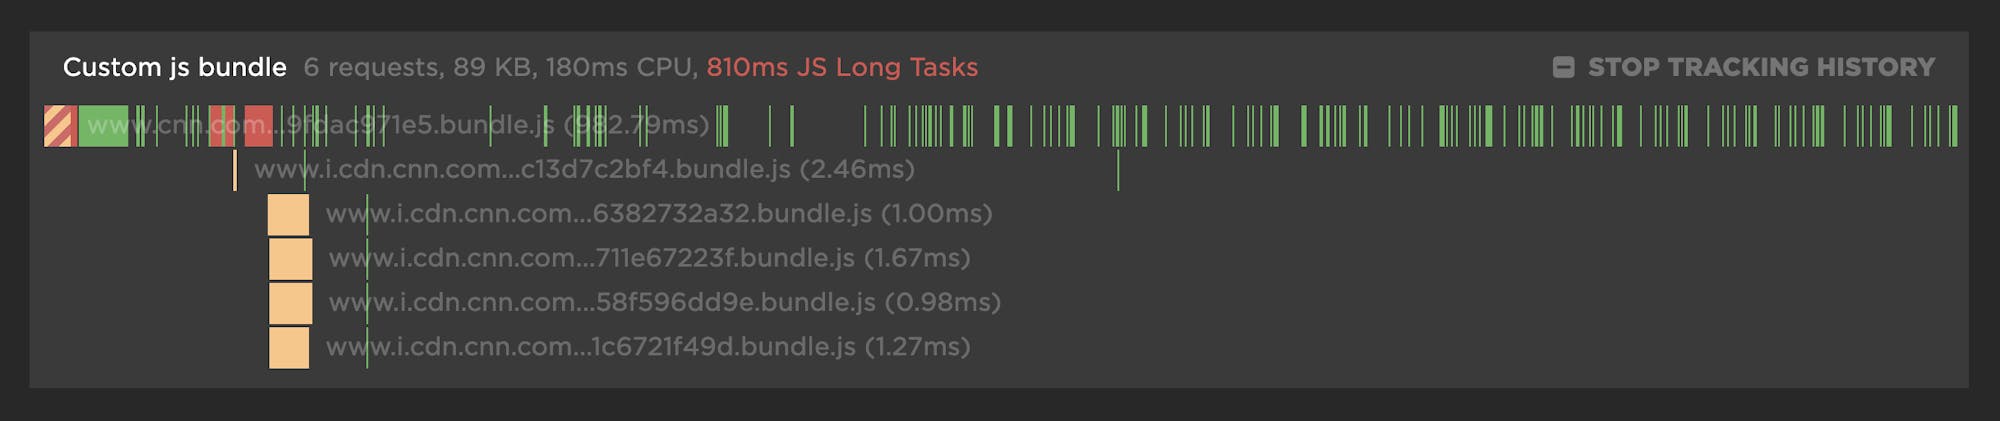
3. Setting up a custom request group is very simple. In this example, we are creating a filter to track a specific JavaScript bundle you want to track alongside your total first-party content:
4. When you return to your First & Third Party Dashboard, you'll see those requests being tracked and trended over time as a group at the top of your dashboard as well as in the waterfall below. Note that the main waterfall in your test results also has the ability to show these resources groups, simply by enabling the capability in your options.
Bringing it all together
Now we have the ability to manage these groups of requests and take action. Tracked request groups are available to you in your Favorites.
Here are a few examples of things you may care about that are now possible to track:
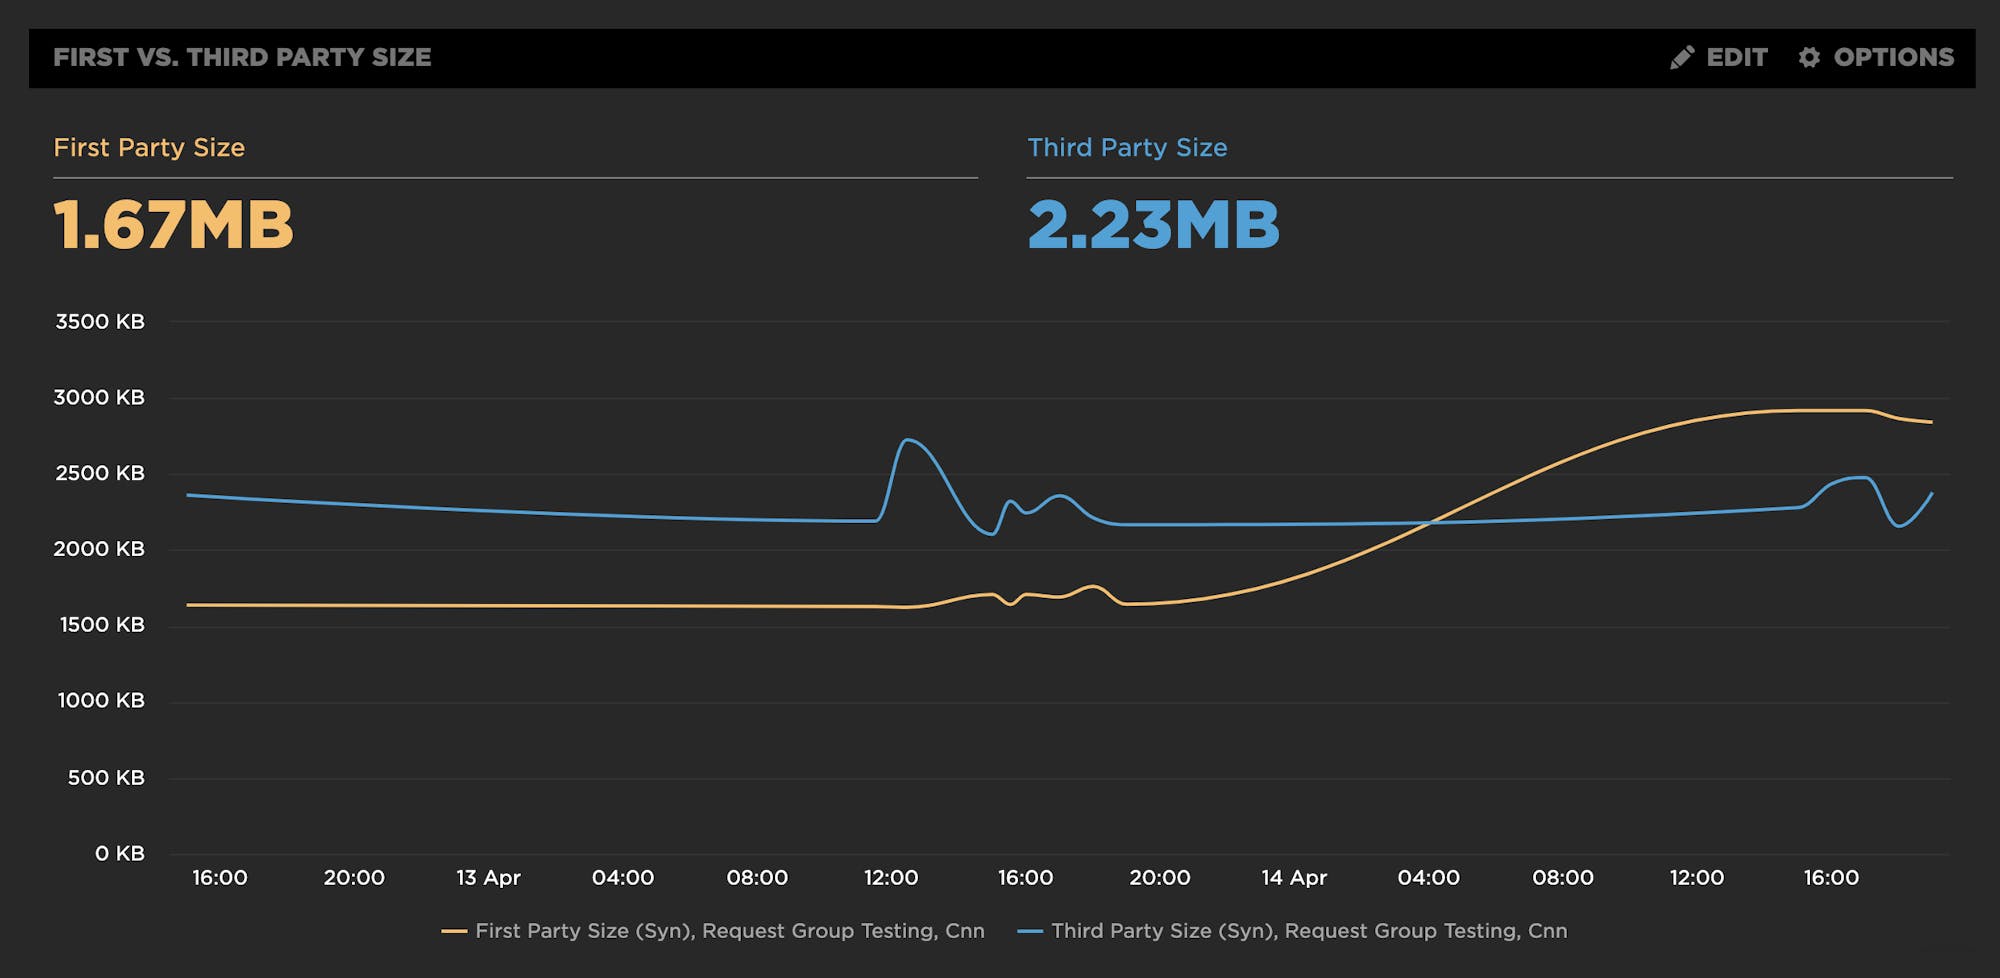
First vs Third Party Size
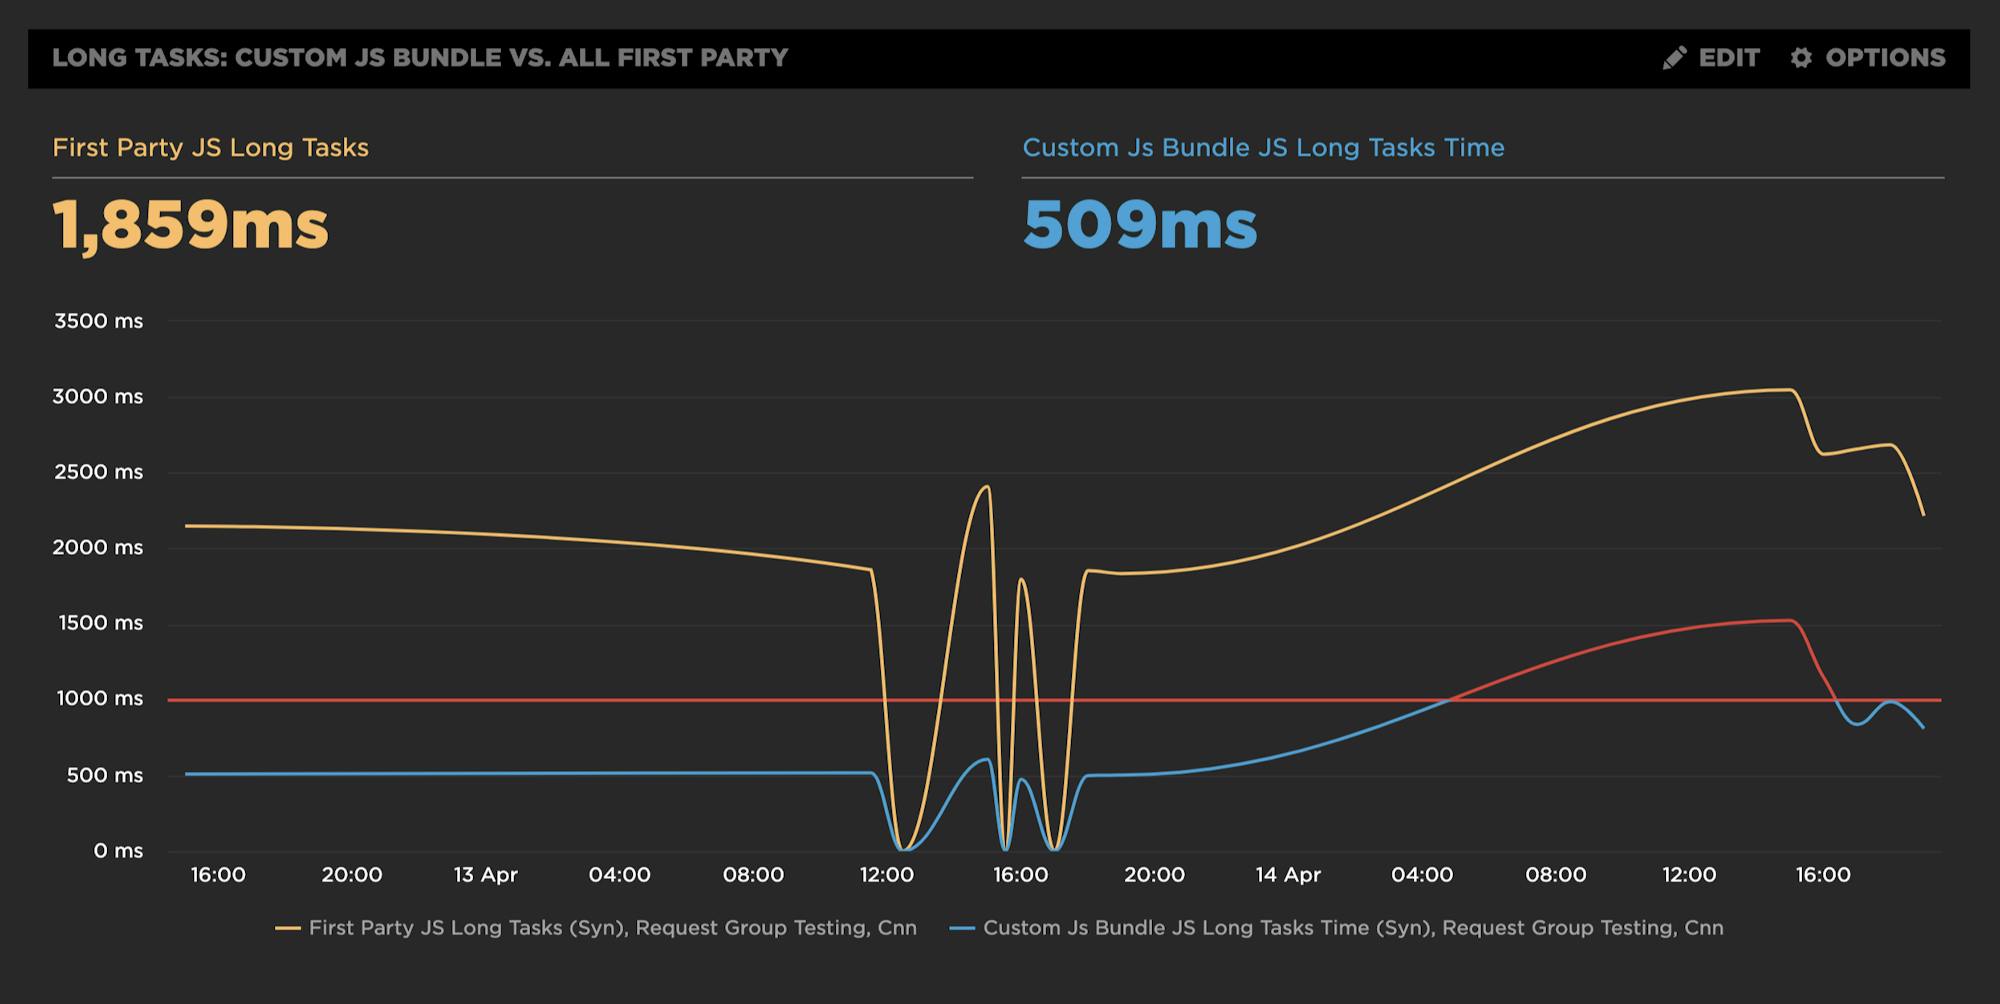
Long Tasks for a Custom JS Bundle vs All First Party Long Tasks
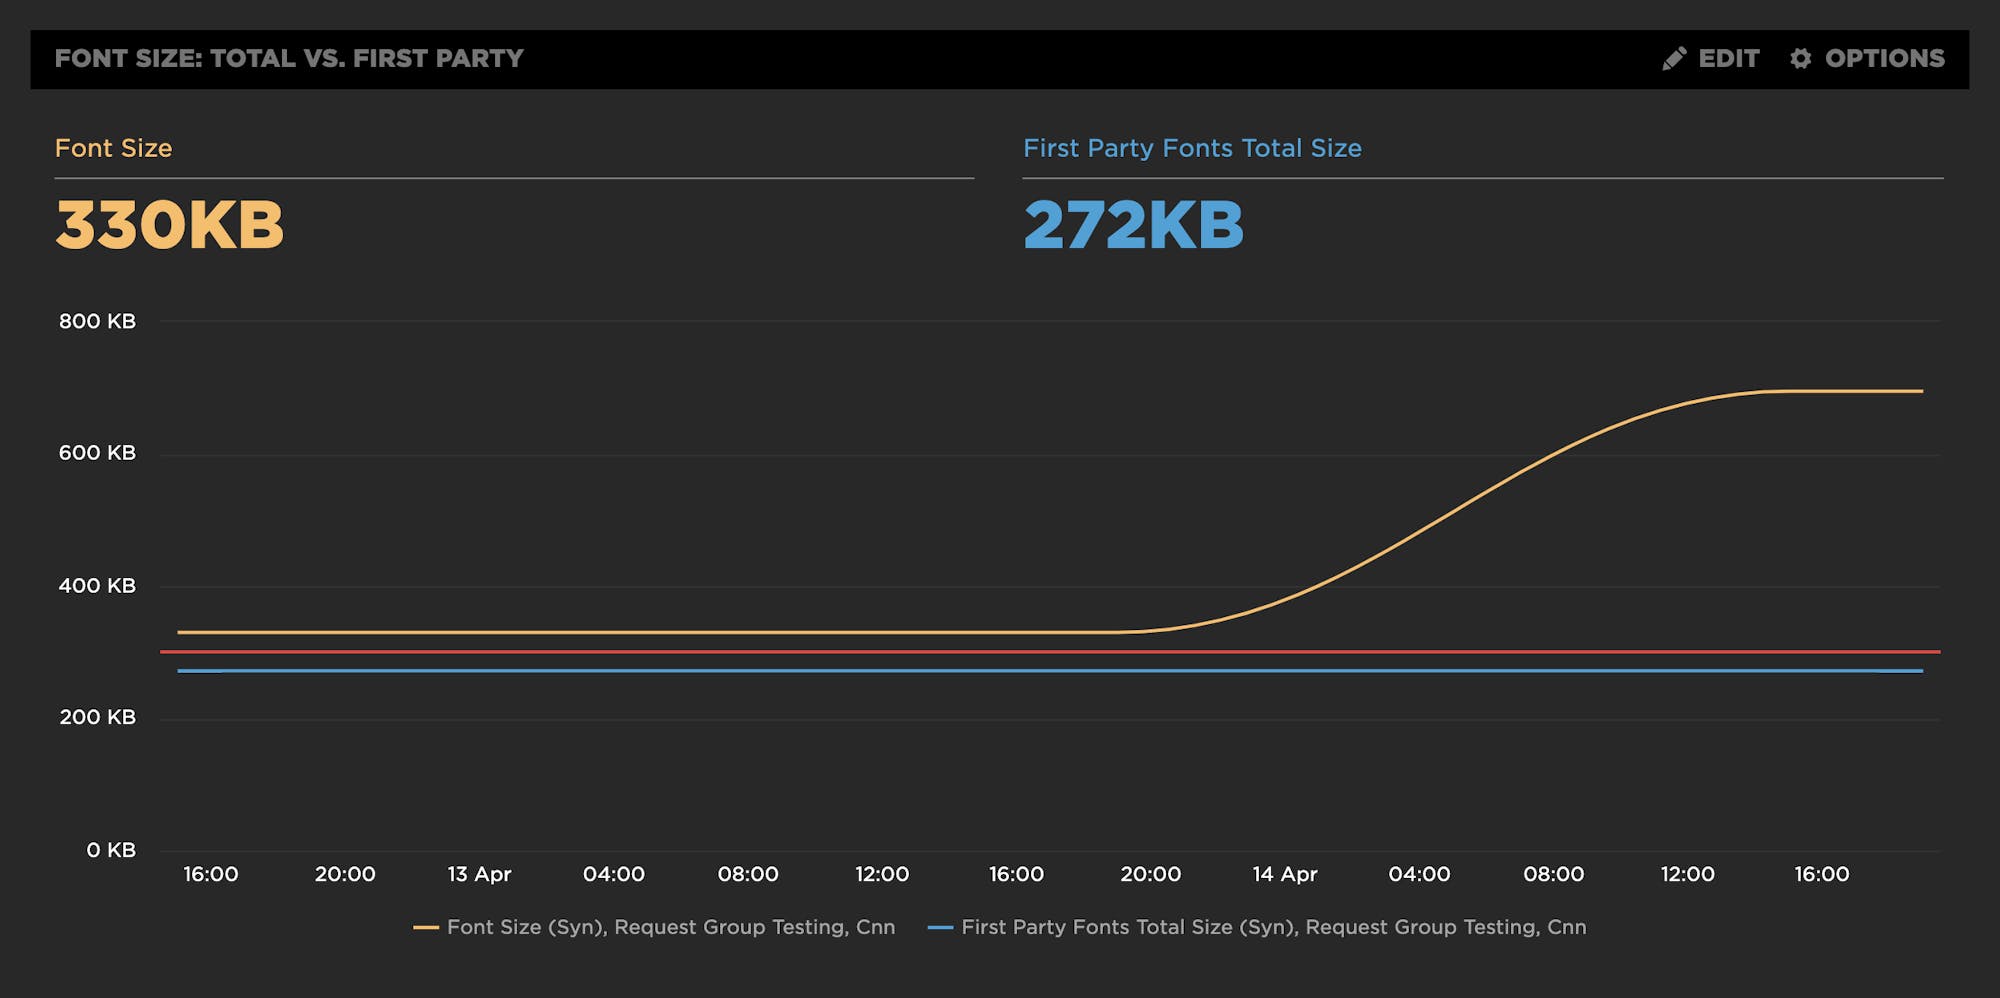
Size of a custom group of First Party Fonts vs Total Font Size
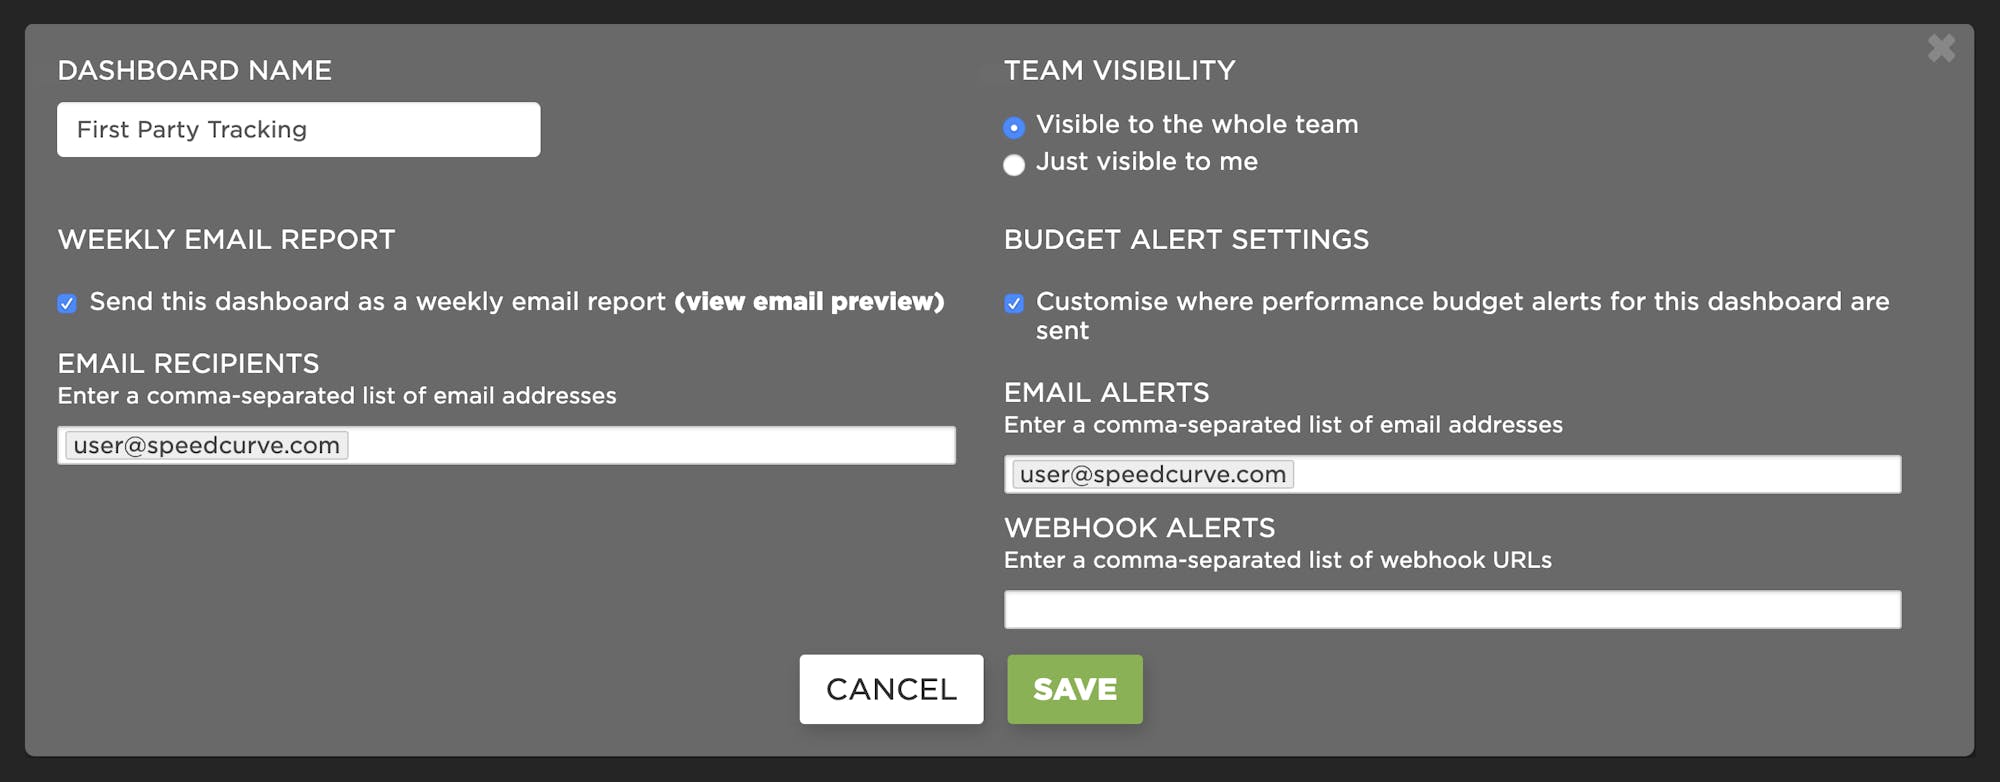
Performance budgets, alerts, and reports
Remember that you have reporting and alerting capability from these dashboards. This means you can send automatic weekly summary reports or get alerts when budgets are exceeded for a specific set of users:
We hope you enjoy this enhancement and, as always, we look forward to your feedback! Here is a video walkthrough of the First & Third Party dashboard so you can see it in action: