SpeedCurve is now part of the Embrace family! There are no changes to how you use our products. Our founder Mark shares what this means...
New LUX JavaScript Dashboards

As organizations work to improve performance for users around the world on slower networks and devices, the focus on JavaScript continues to grow. LUX's new JavaScript dashboards help to identify the problems and solutions for creating a fast, joyous user experience.
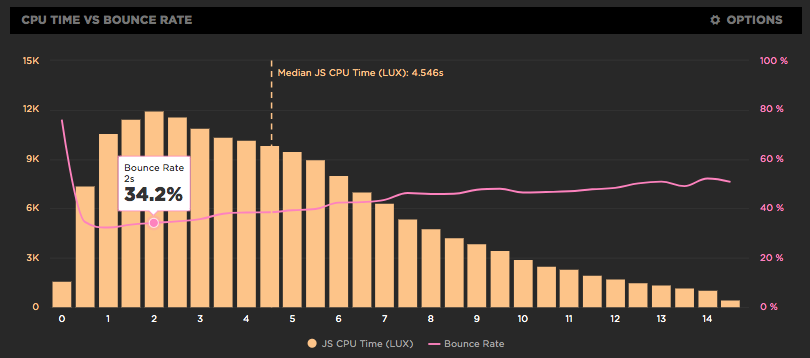
LUX is SpeedCurve's real user monitoring product. We launched it two years ago with four dashboards: Live, Users, Performance, and Design. Today we've added two more LUX dashboards: JavaScript and JS Errors. These new dashboards let you see the impact JavaScript has on your site and on your users with new metrics, including First CPU Idle and First Input Delay, and new features, such as correlation charts that show you how CPU time correlates with bounce rate.
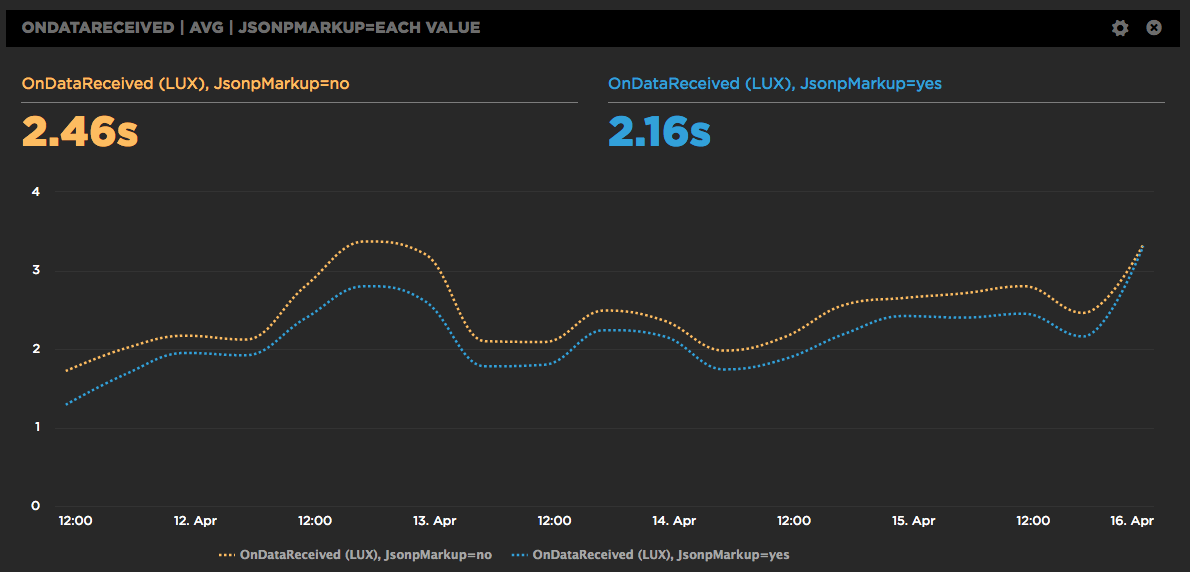
A/B Testing JSONP and the Preloader with RUM
SpeedCurve is a SPA (Single Page App) so we construct the charts dynamically using JSONP. It works great, but we're always looking for ways to make the dashboards faster. One downside to making requests dynamically is that the browser preloader isn't used. This isn't a factor for later SPA requests, but on the first page view the preloader might still bring some benefits. Or maybe not. We weren't sure, so we ran an A/B test. Long story short, doing the first JSONP request via markup caused charts to render 300 milliseconds faster.