SpeedCurve is now part of the Embrace family! There are no changes to how you use our products. Our founder Mark shares what this means...
Third party blame game

Our third party metrics and dashboard have had an exciting revamp. With new metrics like blocking CPU, you can now see exactly who is really to blame for a crappy user experience. We've also given you the ability to monitor individual third parties over time and create performance budgets for them.
It's not you, it's me
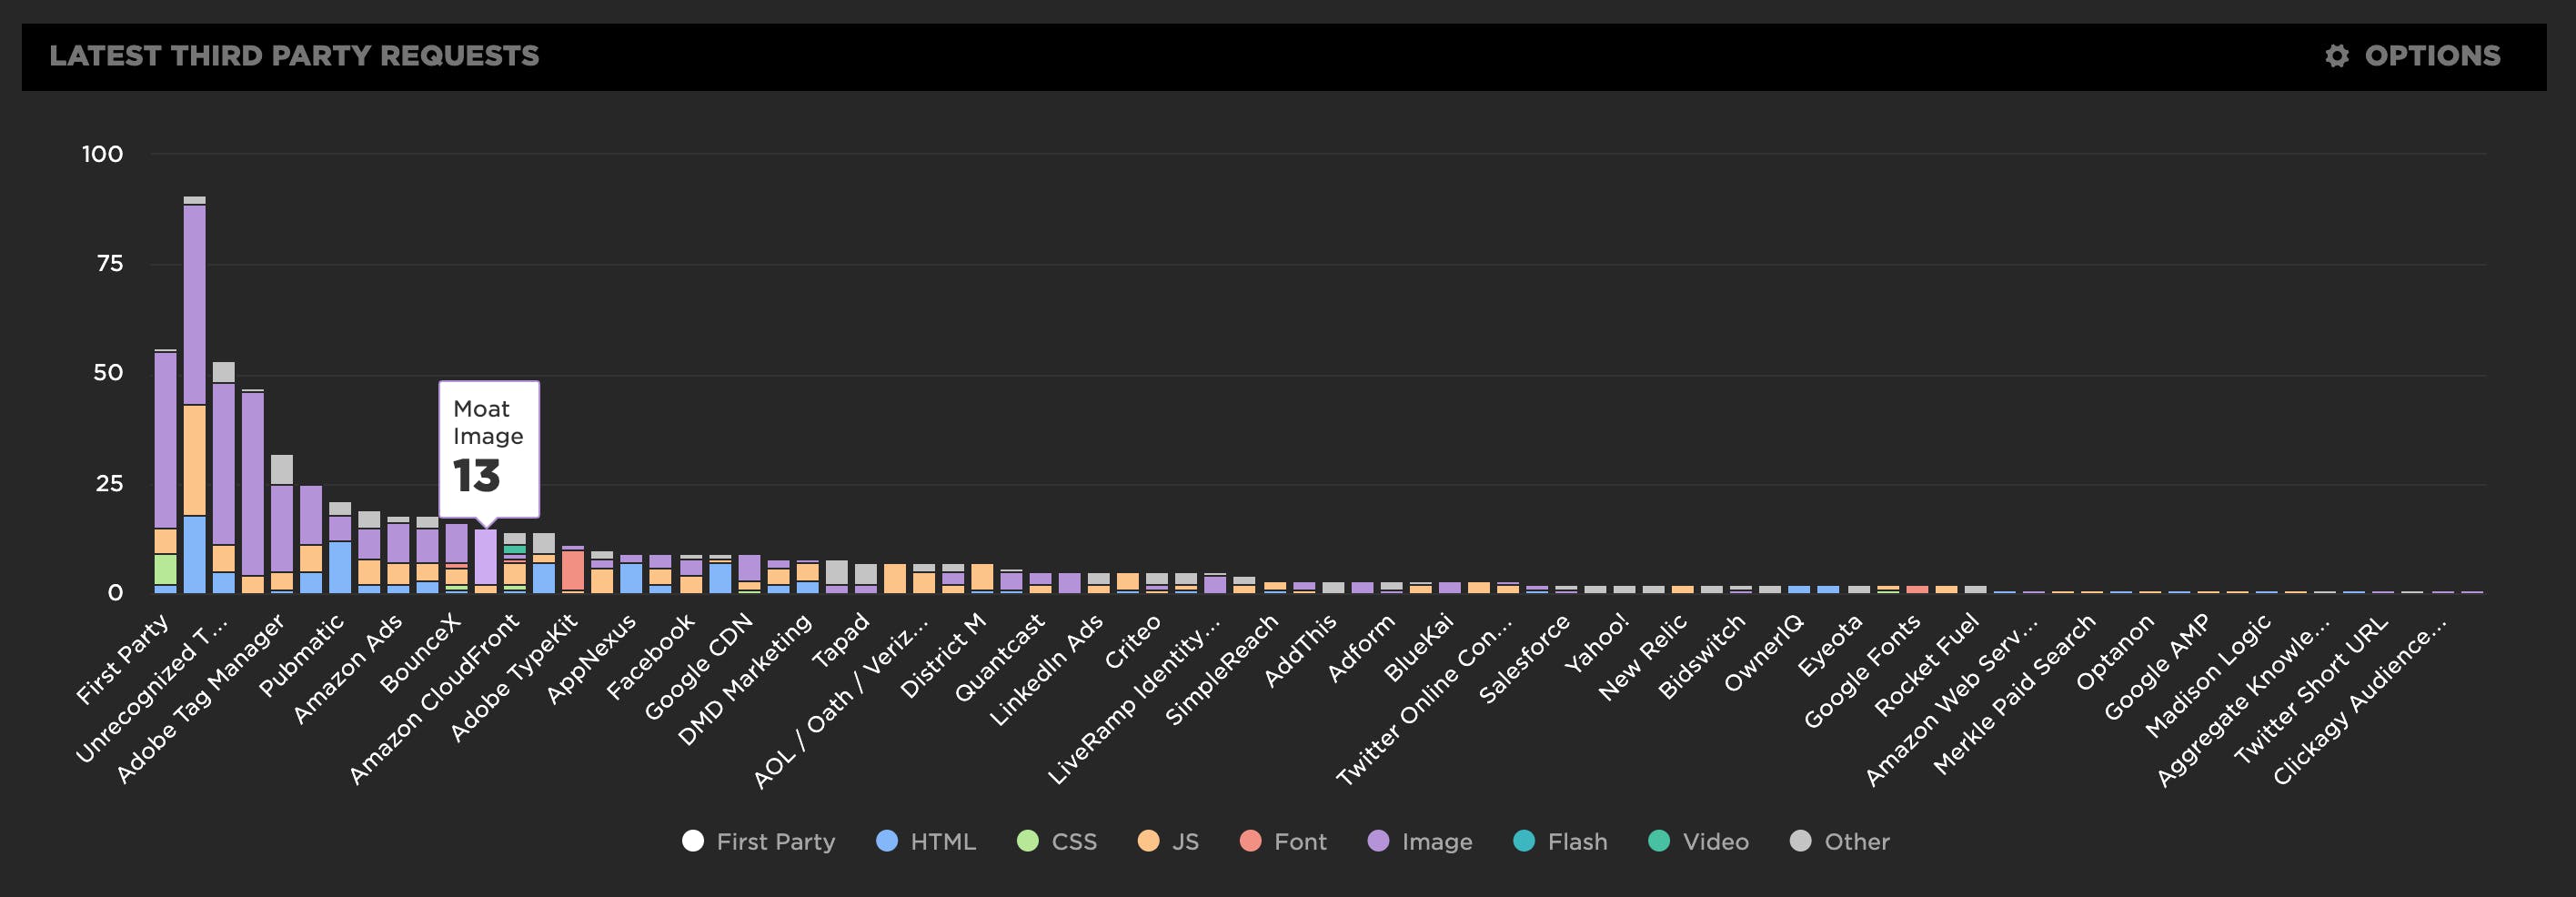
Or is it really you, and not me? We now automatically group all the requests in our third party waterfall chart, letting you easily identify all the third party services used on your website.
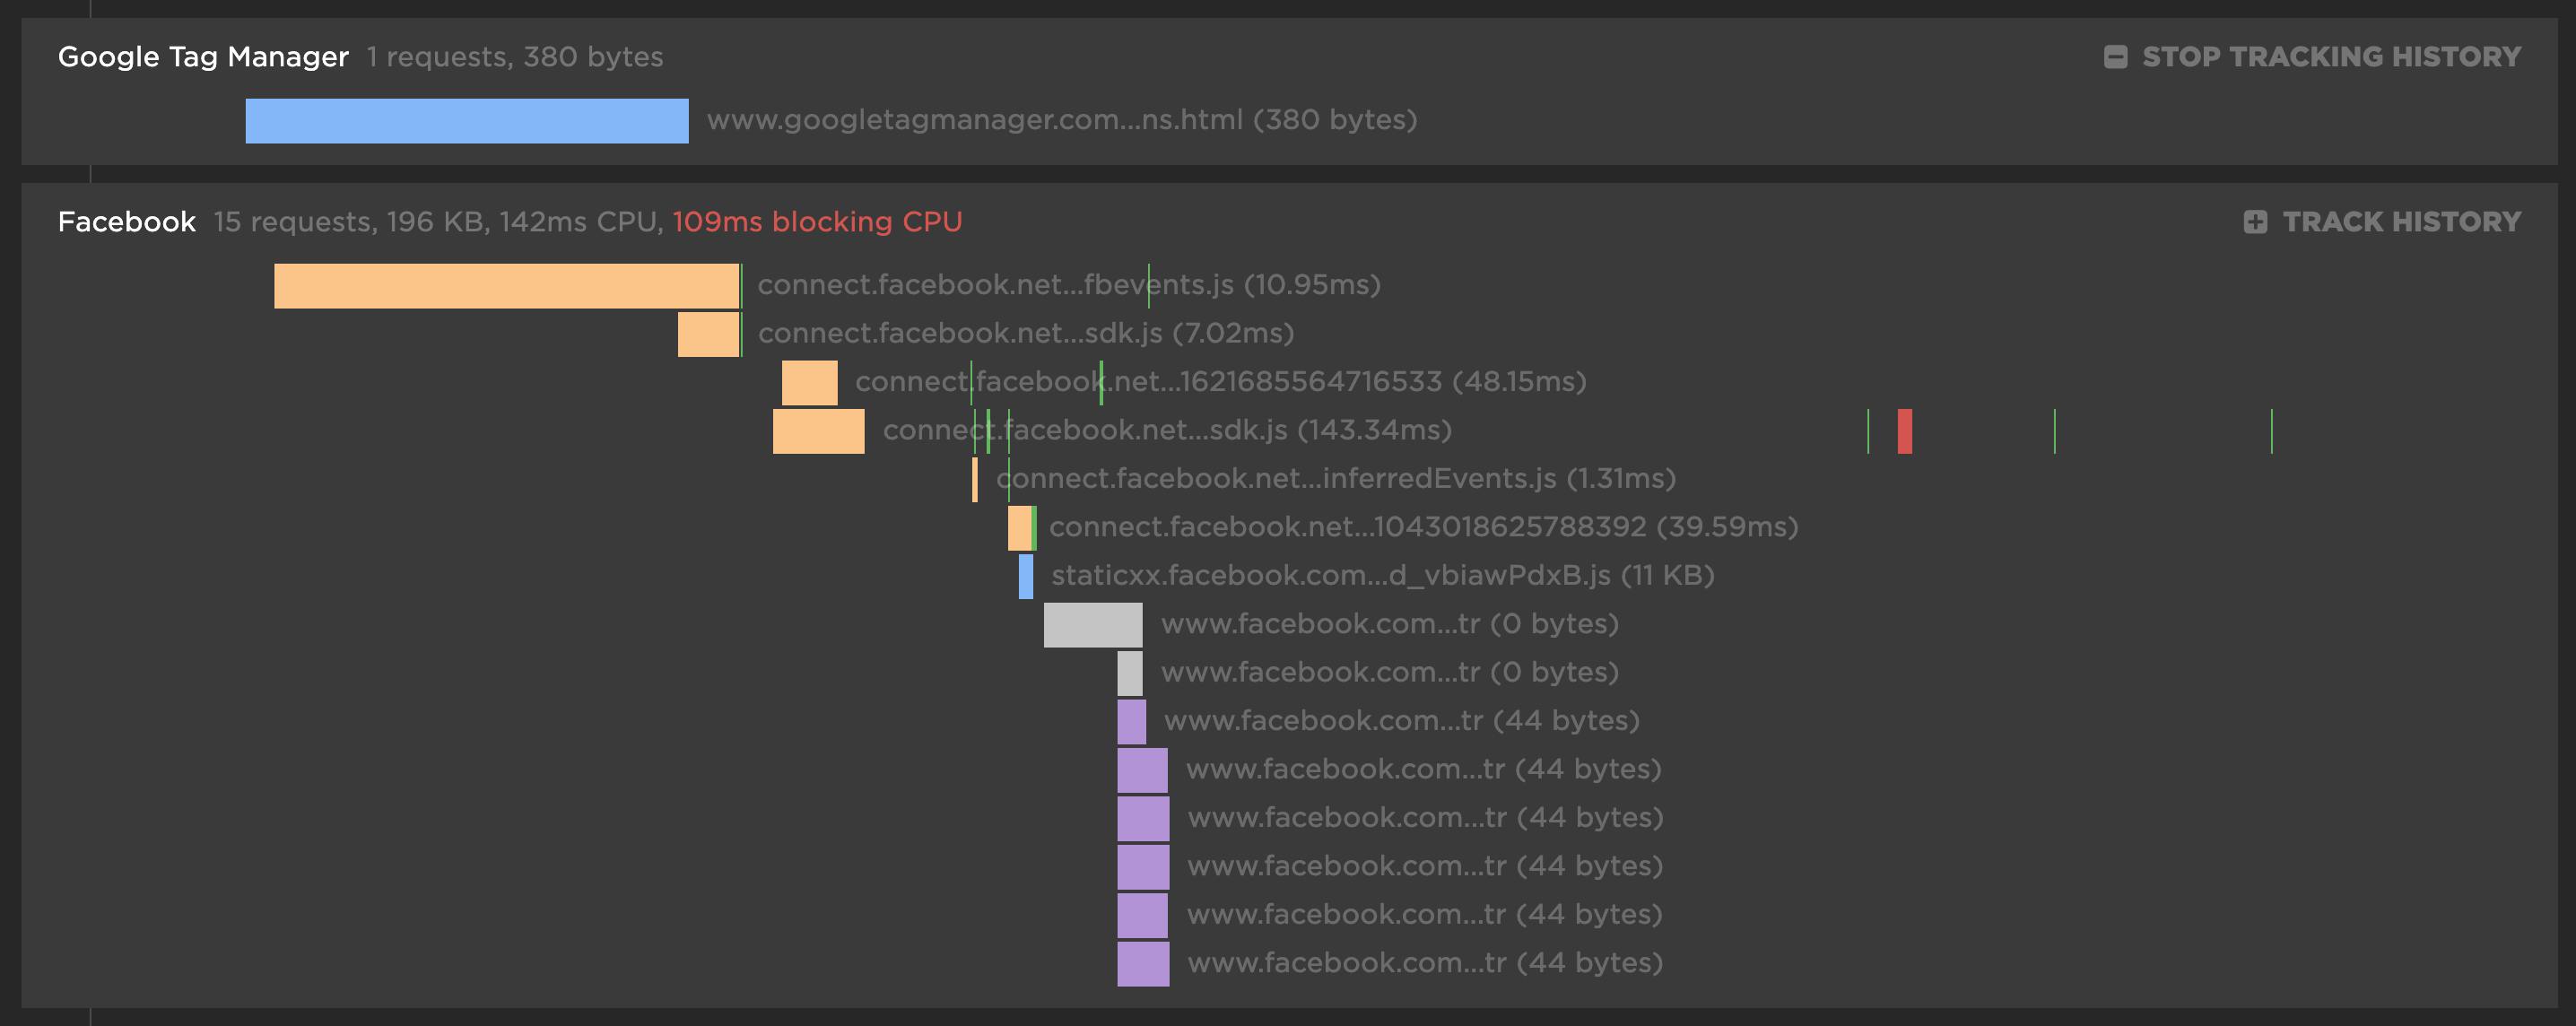
For each third party, you get the number of requests and size for each content type. There's also a first party comparison you can toggle on/off to see what proportion of your requests come from first party vs third party.
Measuring Jank and UX

Ten years ago the network was the biggest problem when it came to making websites fast. Today, CPU is the main concern. This happened because networks got faster while JavaScript moved in the other direction growing 3x in size in the last six years. This growth is important because JavaScript consumes more CPU than all other browser activities combined. While JavaScript and other activities block the CPU, the browser can't respond to user input creating the sensation of a slow, jittery, or broken page, AKA "jank".
To help focus our attention on CPU, several new performance metrics have been defined and evangelized over the last year or three. In this post I'm going to focus on these:
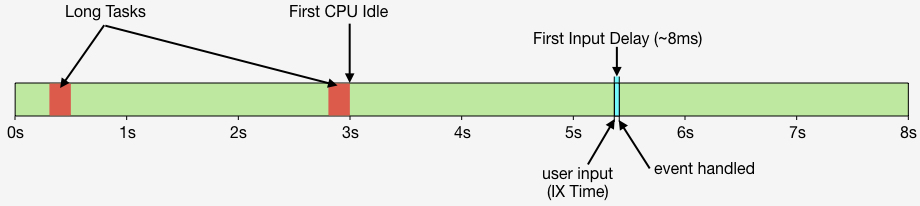
- First CPU Idle measures when the page is no longer janky. Specifically, it is the first span of 5 seconds where the browser main thread is never blocked for more than 50ms after First Contentful Paint. A value of 2-4 seconds is typical.
- First Input Delay measures the gap between when a user interacts with the page (e.g, clicks or scrolls) and when the browser is able to act on that input. First Input Delay values are much lower - a good target is 10ms, but 25ms is common.
- First Interaction Time is when the first user input takes place. This varies widely depending on the type of site and page. A good search results page might have a low First Interaction Time because users scroll and click quickly. A media site might have a high First Interaction Time because users start reading content (headlines, stories) before interacting with the page. At SpeedCurve we call this "IX Time".
- Total Long Task CPU Time is the sum of all long tasks that occur in the page. A "long task" is a browser event that blocks the main thread for more than 50ms.
Here's a figure to help visualize these metrics.