Using RUM to track CPU time

It's exciting working at SpeedCurve and pushing the envelope on performance monitoring to better measure the user's experience. We believe when it comes to web performance it's important to measure what the user sees and experiences when they interact with your site. A big part of our focus on metrics has been around rendering including comparing TTI to FMP, Hero Rendering, and critical blocking resources.
The main bottleneck when it comes to rendering is the browser main thread getting blocked. This is why we launched CPU charts for synthetic testing over a year ago. Back then it wasn't possible to gather CPU information using real user monitoring (RUM), but the Long Tasks API changes that. Starting today, you can track how CPU impacts your users with SpeedCurve's RUM product.
We've been tracking and studying Long Tasks data for several months before launching the dashboards today, so if you're a LUX customer, you'll actually have historical data going back to January.
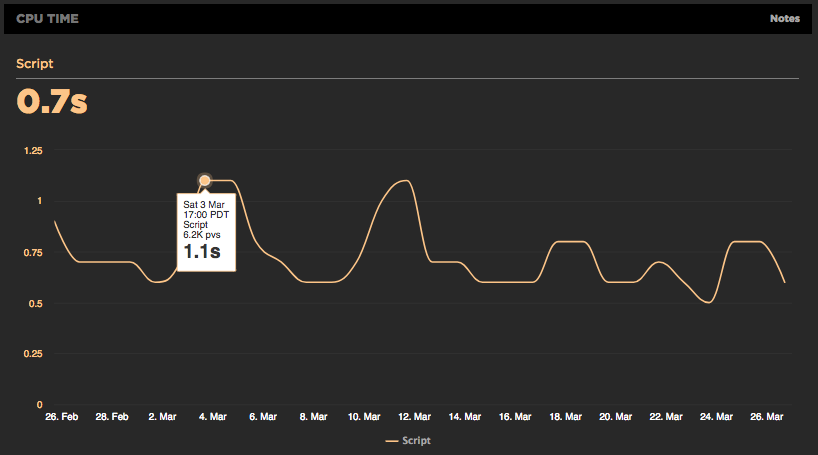
For example, the chart above shows CPU timing for scripts on webpagetest.org. (WebPageTest uses RUM and has generously agreed to share its data.) In this month view, we see four spikes for CPU time. At first we might think the cause is an increase in script size or number of scripts in the page, but the real answer is simply the cycle of weekday traffic from work versus weekend traffic from home.
What is a "long task"?
I summarized my early experiences with the Long Tasks API in my PerfPlanet article Tracking CPU with Long Tasks API. A "long task" is defined as any process that consumes more than 50ms on the browser main thread.
In LUX, we track the sum of the Long Tasks time for each page, and show aggregate metrics in the LUX dashboards. You can filter the data by page, region, and browser. As the Long Tasks API evolves, we'll get attribution information so you can identify which scripts are the real culprits and more information about layout, painting, and other CPU-intensive activities.
Getting started
If you're already using RUM: Check out the new CPU charts in your RUM Performance dashboard.
If you'd like to try RUM: Sign up for a free trial or contact us and we'll hook you up.