SpeedCurve is now part of the Embrace family! There are no changes to how you use our products. Our founder Mark shares what this means...
Are your JavaScript long tasks frustrating users?

When it comes to long JavaScript tasks, how long is too long?
The general consensus within the web performance community is that any JS scripting task that takes more than 50ms to execute can affect a user's experience. When the browser's main thread hits max CPU for more than 50ms, a user starts to notice that their clicks are delayed and that scrolling the page has become janky and unresponsive. Batteries drain faster. People rage click or go elsewhere.
No one plans to make a page or web app that sucks the life out of their users' devices, so it's super important to monitor the effect your JS is having. (Yes... I'm looking at you, front-end JS libraries and third-party ads!)
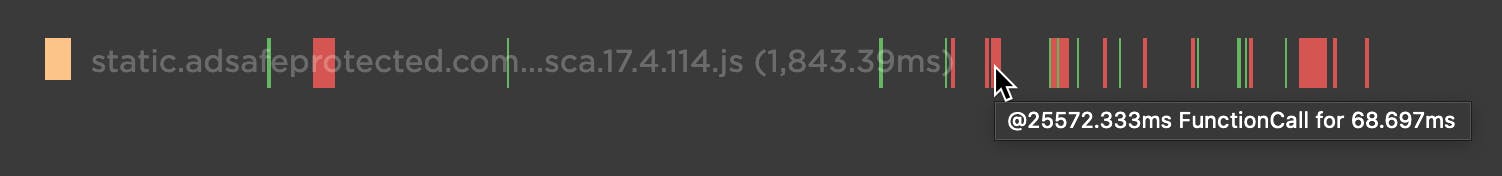
Our waterfall chart shows every long task over 50ms as a red block.
New JavaScript CPU metrics
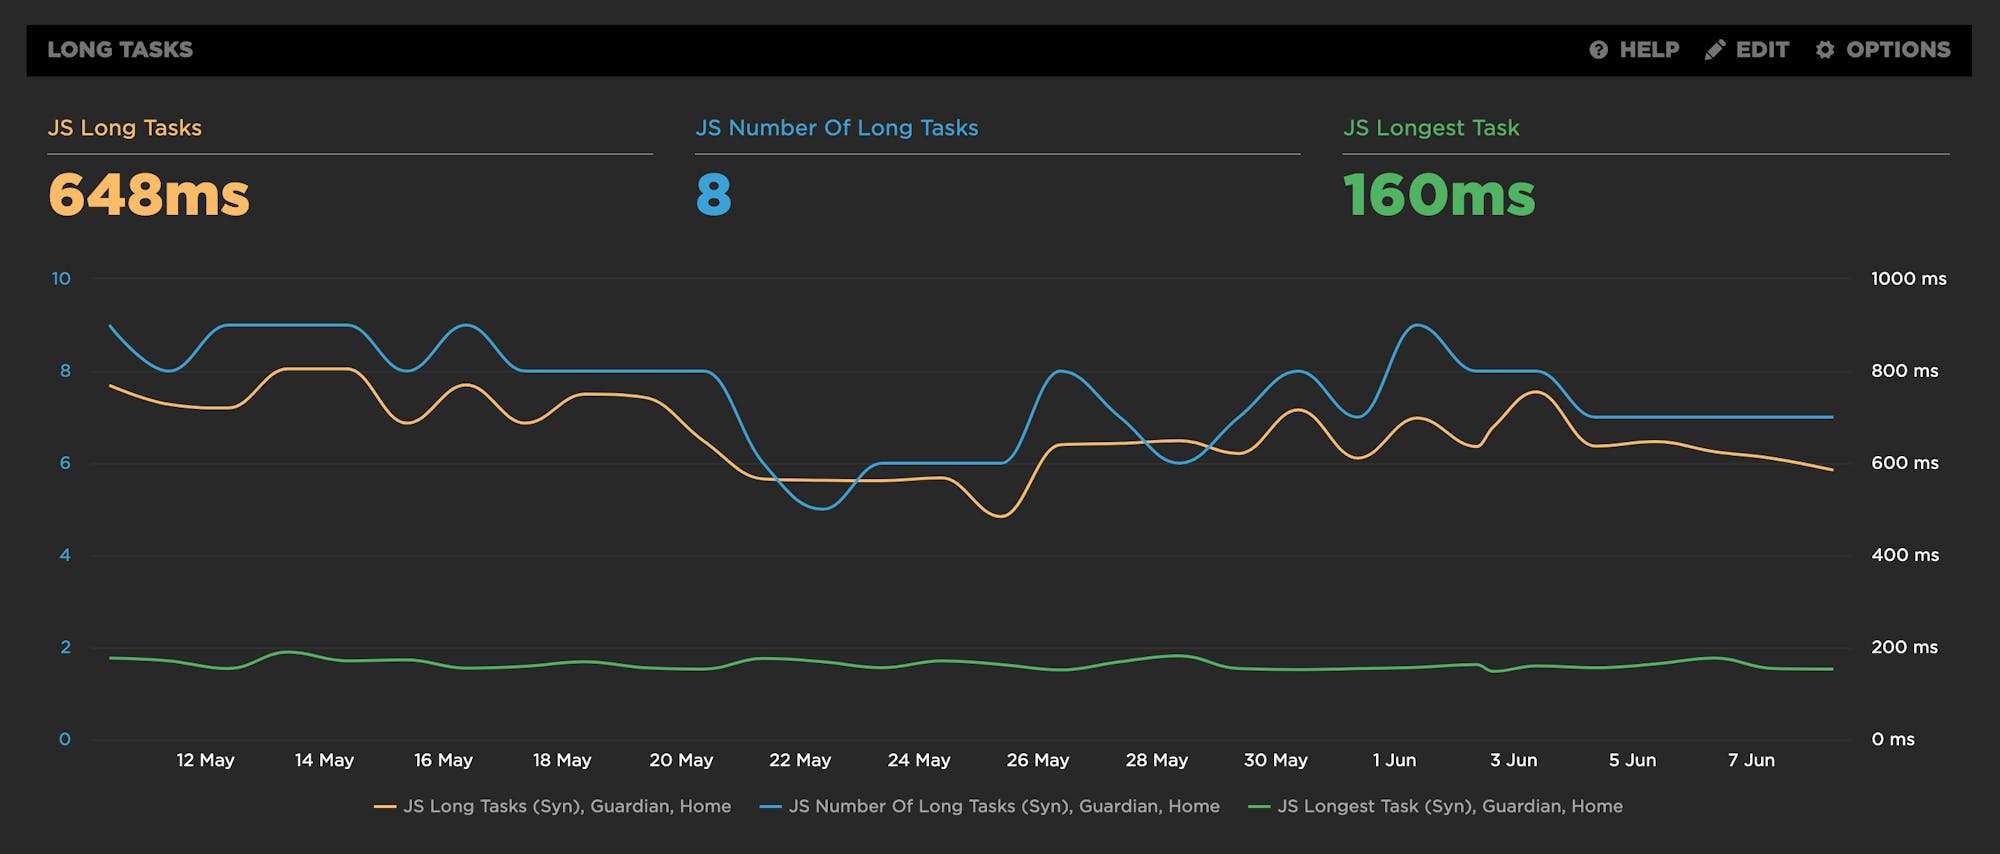
We've recently added a bunch of new JavaScript CPU metrics that help you understand if your scripts are blocking the main thread and getting in the way of a super smooth experience for your users:
- Long Tasks – The total time of all your JS tasks over 50ms added together – from navigation start till the page is fully loaded.
- Number of Long Tasks – The total number of individual JS long tasks.
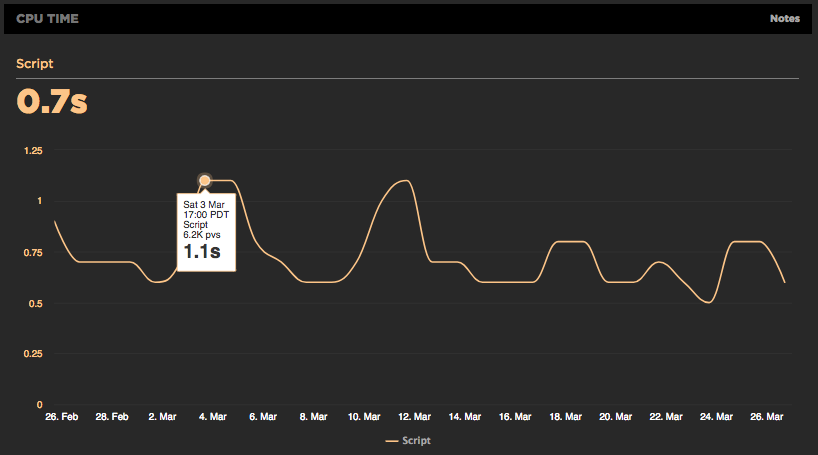
- Longest Task – There's a lot that can hide in the details of long task time. One really long task that frustrates your user is an order of magnitude worse than a bunch of long tasks that are just over the 50ms threshold each. For that reason, we track not only the number of long tasks in a page but also the duration of the longest task in the page. (We've seen individual JS long tasks taking over 1,000ms! That's a whole second where the browser just locked up, sat on its hands, and refused to do anything while a poor user mashed on the keyboard and wiggled the mouse wondering what happened.)
Measuring Jank and UX

Ten years ago the network was the biggest problem when it came to making websites fast. Today, CPU is the main concern. This happened because networks got faster while JavaScript moved in the other direction growing 3x in size in the last six years. This growth is important because JavaScript consumes more CPU than all other browser activities combined. While JavaScript and other activities block the CPU, the browser can't respond to user input creating the sensation of a slow, jittery, or broken page, AKA "jank".
To help focus our attention on CPU, several new performance metrics have been defined and evangelized over the last year or three. In this post I'm going to focus on these:
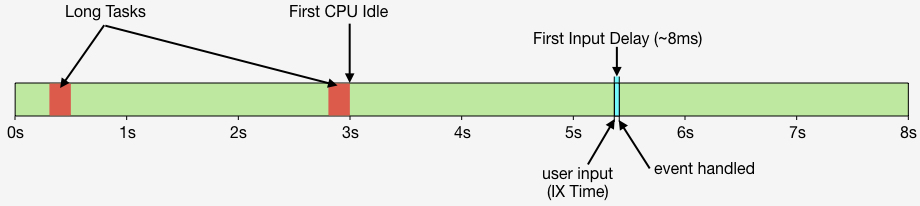
- First CPU Idle measures when the page is no longer janky. Specifically, it is the first span of 5 seconds where the browser main thread is never blocked for more than 50ms after First Contentful Paint. A value of 2-4 seconds is typical.
- First Input Delay measures the gap between when a user interacts with the page (e.g, clicks or scrolls) and when the browser is able to act on that input. First Input Delay values are much lower - a good target is 10ms, but 25ms is common.
- First Interaction Time is when the first user input takes place. This varies widely depending on the type of site and page. A good search results page might have a low First Interaction Time because users scroll and click quickly. A media site might have a high First Interaction Time because users start reading content (headlines, stories) before interacting with the page. At SpeedCurve we call this "IX Time".
- Total Long Task CPU Time is the sum of all long tasks that occur in the page. A "long task" is a browser event that blocks the main thread for more than 50ms.
Here's a figure to help visualize these metrics.
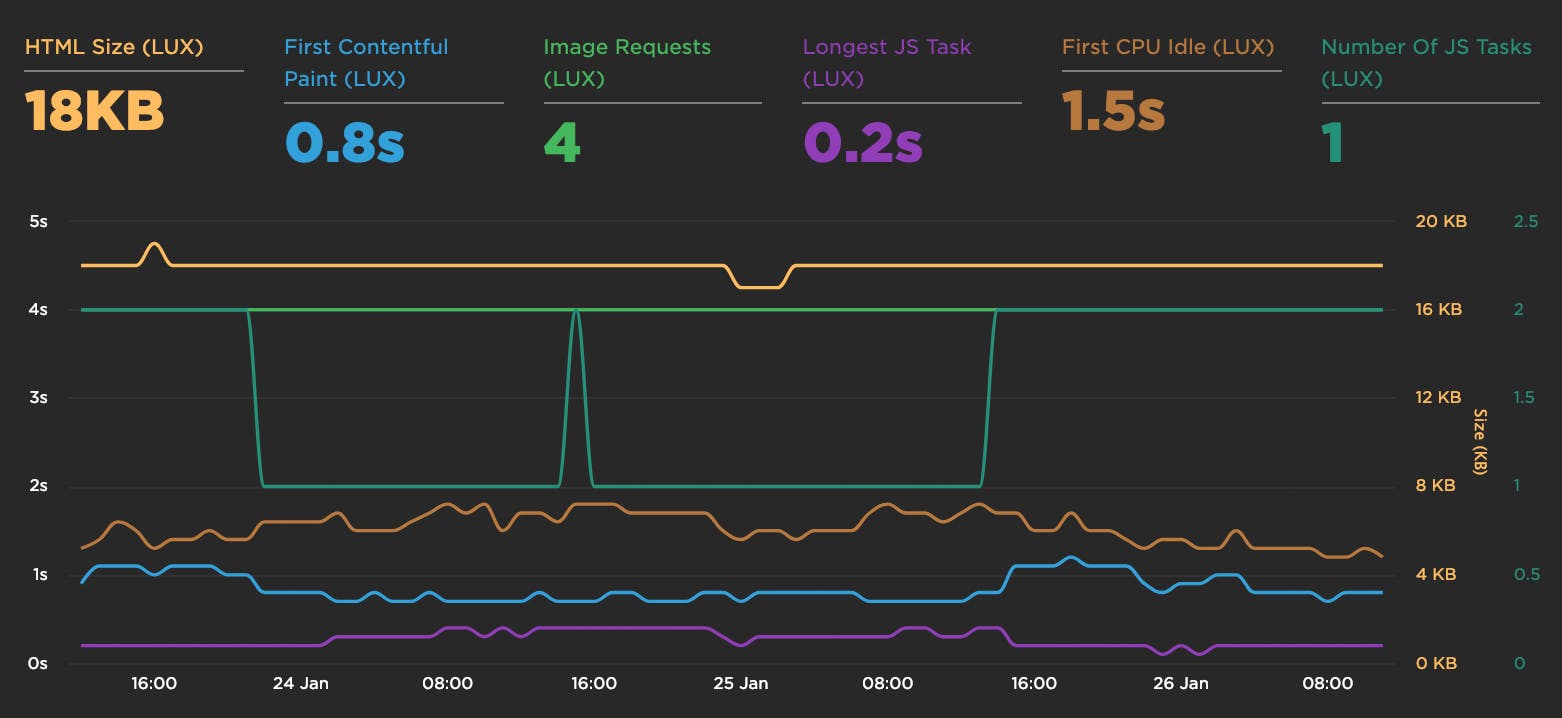
New LUX metrics
Over the winter holiday we added a bunch of new metrics to LUX:
- First Contentful Paint
- First CPU Idle
- Longest Long Task
- Number of Long Tasks
- Connection type
- HTML transfer size
- Total # of image requests
Using RUM to track CPU time
It's exciting working at SpeedCurve and pushing the envelope on performance monitoring to better measure the user's experience. We believe when it comes to web performance it's important to measure what the user sees and experiences when they interact with your site. A big part of our focus on metrics has been around rendering including comparing TTI to FMP, Hero Rendering, and critical blocking resources.
The main bottleneck when it comes to rendering is the browser main thread getting blocked. This is why we launched CPU charts for synthetic testing over a year ago. Back then it wasn't possible to gather CPU information using real user monitoring (RUM), but the Long Tasks API changes that. Starting today, you can track how CPU impacts your users with SpeedCurve's RUM product.