Evaluating rendering metrics

At SpeedCurve, we're fond of the phrase "a joyous user experience". Creating this joy requires delivering what users want as quickly as possible. It's important that the critical content is downloaded and rendered before users get frustrated.
Network metrics have been around for decades, but rendering metrics are newer. Speed Index. Start Render. Time to First Interactive. First Meaningful Paint. These are a few of the rendering metrics that currently exist. What do they mean? How do they compare? Which are best for you? Let's take a look.
A brief history of performance metrics
Metrics quantify behavior. In the case of performance metrics, we're trying to capture the behavior of a website in terms of speed and construction. By "construction" I mean statistics about how the site is built such as number of HTTP requests, size of stylesheets, and DOM depth. Speed is tracked by time-based metrics that capture when things happen during the user's experience with the website: start render, DOM interactive, page load, etc. Often, construction metrics are useful for diagnosing the cause of changes in speed metrics.
Ah-ha, the number of blocking scripts increased!
While construction metrics are fairly well established, time-based performance metrics are newer and still evolving. In the old days, the main time-based performance metric was window.onload. (Actually, before window.onload the main performance metric was the response time of the HTTP request for the HTML document!)
The W3C Web Performance Working Group changed everything with the Navigation Timing, Resource Timing, and User Timing specifications. Navigation Timing and Resource Timing let us measure things like DNS lookups, TCP connections, and SSL negotiations for the main page as well as all the resources in the page. Most importantly, Navigation Timing gives us a spec'ed milestone for when the page begins to load (performance.timing.navigationStart), as well as other milestones like DOM Interactive and DOM Complete. User Timing doesn't come with any predefined metrics, but instead provides an API for capturing website-specific milestones by simply calling performance.mark and performance.measure.
Gaps in today's performance metrics
While the specifications mentioned previously have greatly improved our ability to measure performance, they actually don't help us capture the most important aspects of web performance. There are two big gaps:
Gap 1: Browser Main Thread
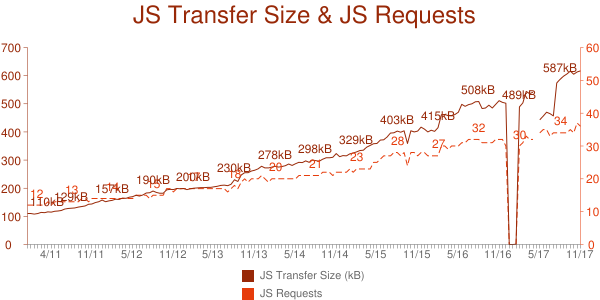
The gating factor in web performance ten years ago was network. Today, the main bottleneck is CPU. The cause of this shift is the increase in CSS and JavaScript, as well as more mobile users. Over the last seven years, the number of scripts jumped from 12 to 36 and the compressed size increased from 110K to 617K for the world's top 1000 websites according to the HTTP Archive.
Construction metrics provide information about the number and size of scripts and stylesheets. But this isn't a direct measure of how JavaScript is impacting the page. Suppose a website has just one script, but that script takes 3 seconds to execute. Another website might have four scripts, but each of them takes less than 100 milliseconds to execute. The number of scripts is a good estimate for whether JavaScript is the bottleneck, but it's based on assumptions about typical execution times.
It would be better if there was a way to measure the time each script, especially the blocking scripts, consume on the browser's main thread. Chrome Dev Tools has this information, and a year or so ago Pat Meenan added this to WebPageTest's waterfall charts using pink bars:
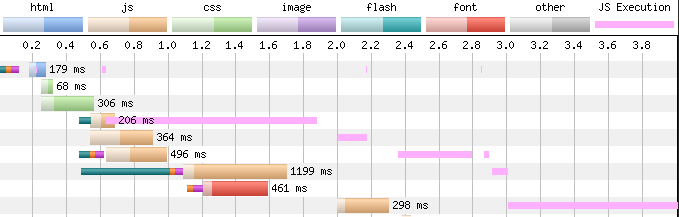
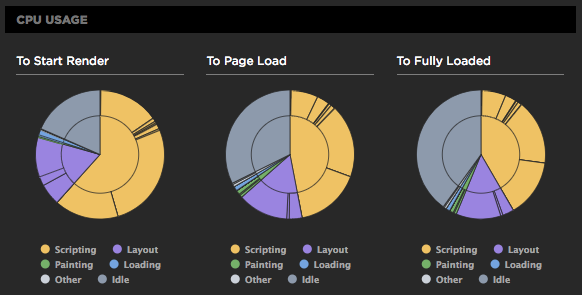
This example illustrates how construction metrics can be misleading. The first script in the waterfall above is the smallest so many people might assume it would execute the fastest, but it actually takes the longest to execute. This insight into browser main thread activity isn't limited to JavaScript execution; WebPageTest also provides information about layout, paint, and loading. In order to help teams focus on CPU, SpeedCurve extracts this information from WebPageTest and shows it in our default dashboards.
However, this insight into browser main thread bottlenecks is limited to synthetic testing. It would be great if there was a CPU Timing specification so these metrics were also available in Real User Monitoring (RUM). The Long Tasks API is new and could help address this gap.
Gap 2: Rendering
There are a number of rendering metrics available today, but there's a "gap" because of the lack of standardization and accuracy. Let's take a quick survey.
WebPageTest is the pioneer in rendering metrics (and many many other parts of performance monitoring). Here's what it offers when it comes to rendering:
- Speed Index is "the average time at which visible parts of the page are displayed. It is expressed in milliseconds". Speed Index is not a specific point-in-time but instead is an aggregate stat so is a bit apples-to-oranges when compared to these other time-based metrics.
- Start Render is "the time from the start of the initial navigation until the first non-white content is painted".
- Time to First Interactive (aka, Time to CPU Idle) is "when the page is first expected to be usable and will respond to input quickly." Specifically, it is the first span of 5 seconds where the browser main thread is never blocked for more than 50ms after First Contentful Paint. Note that this is more than just a rendering metric as it also captures interactivity.
- Time to Consistently Interactive (aka, Time to Interactive) is "when the page is first expected to be usable and will respond to input quickly." Specifically, it is the first span of 5 seconds where the browser main thread is never blocked for more than 50ms after First Contentful Paint with no more than 2 in-flight requests. Note that this is more than just a rendering metric as it also captures interactivity.
- Visually Complete is the "first time when the visual progress reaches 100%".
The new Paint Timing specification defines two new metrics. You can extract these values using performance.getEntriesByType("paint"):
- First Paint is "the time when the browser first rendered after navigation. This excludes the default background paint, but includes non-default background paint."
- First Contentful Paint is "when the browser first rendered any text, image (including background images), non-white canvas or SVG."
To compensate for shortcomings in First Contentful Paint, Chrome's Lighthouse project attempts to capture when primary content is rendered to the user. This metric can be found in Chrome traces.
- First Meaningful Paint is "the paint after which the biggest above-the-fold layout change has happened, and web fonts have loaded." (More detail is available here.)
SpeedCurve also created a new metric that tries to capture when critical content is rendered to the page:
- Hero Rendering Times is a combination of when the largest IMG, H1, and background image in the viewport are rendered. The composite metric is computed by taking the maximum of the H1 time and the biggest IMG time (or biggest background image if biggest IMG doesn't exist):
max(h1, (biggest_img || bg_img)).
Evaluating rendering metrics
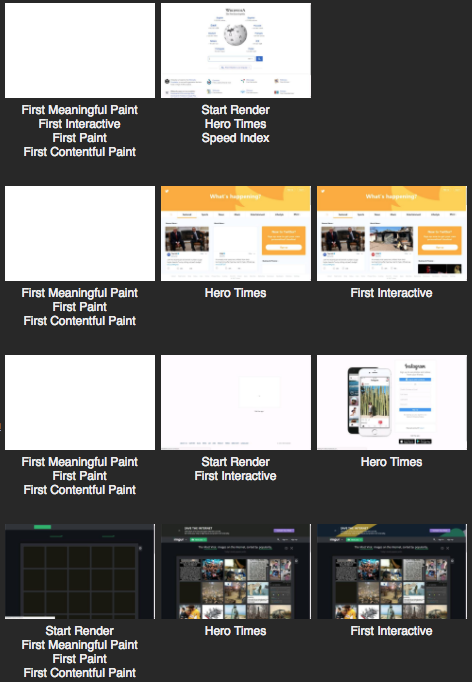
In order to evaluate the different rendering metrics, we recorded WebPageTest filmstrips for the world's top ~100 websites. To make the evaluation more interactive (and fun), we created the rendering metrics Picker page. It shows the screenshot that corresponds to each metric, but the metric names are hidden until you choose the one that corresponds to what you consider to be a "good UX". It keeps track of which metrics you're most aligned with. (If you want to see all the metrics without clicking on each filmstrip, just scroll to the bottom and click "Show All".)
I wish I could say "X is the best rendering metric", but it really depends on what you're after. For your site, you might be most interested in getting any content to the page as quickly as possible (Start Render). Or maybe you're interested in getting a significant amount of content to the page (First Meaningful Paint, Speed Index). Perhaps you care most about when critical content appears in the page (Hero Rendering Times).
Regardless of the question of which rendering matters the most to you, there are a few criteria to keep in mind when evaluating these metrics.
Does every pixel have the same value?
It's important to focus on rendering when it comes to delivering a good user experience. At SpeedCurve, we feel it's more than just rendering pixels - it's really about rendering the most important pixels. Not every part of the page has the same value. There are certain design elements - the call-to-action, the hero image, etc. - that are more important. A good metric should be able to measure the most important pixels when it comes to rendering.
Automatic or requires work?
One of the reasons why window.onload is still the most-used performance metric is that it exists in all browsers by default - the website owner doesn't have to do any work to generate this metric. On the other hand, User Timing lets teams track metrics that matter the most to them, but it requires writing, pushing, and maintaining code to generate these metrics - which is probably why only ~5% of the world's top 500K websites use it. All other things being equal, there's a preference for metrics that work automatically.
Synthetic or RUM?
Performance metrics are gathered either synthetically or via Real User Monitoring. Ideally, the metric of choice supports both. (Note: If a technique can be gathered by RUM it's considered available to synthetic as well, since synthetic monitoring solutions generally have access to JavaScript.)
The following table categorizes each metric into the appropriate quadrant:
| Requires Work | Automatic | |
|---|---|---|
|
Measures
important
pixels
|
User Timing (both) Hero Element Timing (both) |
Hero Rendering Times (syn) |
| All pixels the same |
User Timing (both) | Speed Index (syn) Start Render (syn) Time to First Interactive (syn) Time to Consistently Interactive (syn) Visually Complete (syn) First Paint (both) First Contentful Paint (both) First Meaningful Paint (syn) |
We're pretty excited about Hero Rendering Times. It uses heuristics to estimate which content is critical (H1, hero image, and largest background image). It's available without the website owner having to do any extra work, which means it can also track competitor websites. And it scores well in the subjective results from "which metric best approximates a good UX". However, it's only available in synthetic monitoring.
There isn't a good rendering metric available in RUM. There are only three choices right now: First Paint, First Contentful Paint, and User Timing. The results in our examples for First Paint and First Contentful Paint don't map well to actual screen content. This is probably due to the fact that Chrome doesn't know when the pixels actually get painted to the screen. For synthetic results we could round up to the next painted thumbnail, but it's not possible to make this adjustment for RUM. Perhaps website owners could always add an offset, but in our results the delta ranged from 100ms to 3 seconds.
User Timing is the third alternative for RUM. The good thing about User Timing is it can be used to measure the rendering time for the critical content in the page, but this requires using special techniques that are tricky at best. In addition, it's possible that the results suffer from a similar delta delay as we see with First Paint and First Contentful Paint. (This is an area for further research.)
Hero Element Timing is a fourth candidate for RUM rendering metrics, but it's in the early proposal stages and not currently available in any browser. And again, it's likely that this metric would suffer from the same delta delay as the others discussed previously.
What's next
There's work to do in rendering metrics for RUM. First Paint and First Contentful Paint don't necessarily correspond to a "good UX" (i.e., critical content). Hero Element Timing will be extremely useful for tracking critical content in RUM once browsers support it.
The question of measuring "meaningful" content is an area for more research. In our experience with the Picker, First Meaningful Paint often doesn't match the point where critical content is rendered. Hero Rendering Times does better at identifying when critical content hits the screen, but isn't without flaws. Its calculations are based on analyzing the filmstrip screenshot images. Rotating content and pop-ups are a challenge, as is transparent H1 elements that overlay hero images and background images. Identifying critical content without requiring website owners to modify their code is an exciting goal for future work.
Further down the road it'd be great to get more CPU information for RUM possibly from the Long Tasks API. This could help developers diagnose why their rendering metrics have changed, especially if timing information can be associated with individual scripts and stylesheets.
In this blog post I focused on rendering metrics and haven't spent much time on the interactive metrics (Time to First Interactive and Time to Consistently Interactive). It's important that these interactivity metrics incorporate a rendering metric as a baseline. Currently, they rely on First Contentful Paint but other rendering metrics should also be considered, especially Hero Rendering Times since it's performed well in our studies.