SpeedCurve is now part of the Embrace family! There are no changes to how you use our products. Our founder Mark shares what this means...
Measuring Jank and UX

Ten years ago the network was the biggest problem when it came to making websites fast. Today, CPU is the main concern. This happened because networks got faster while JavaScript moved in the other direction growing 3x in size in the last six years. This growth is important because JavaScript consumes more CPU than all other browser activities combined. While JavaScript and other activities block the CPU, the browser can't respond to user input creating the sensation of a slow, jittery, or broken page, AKA "jank".
To help focus our attention on CPU, several new performance metrics have been defined and evangelized over the last year or three. In this post I'm going to focus on these:
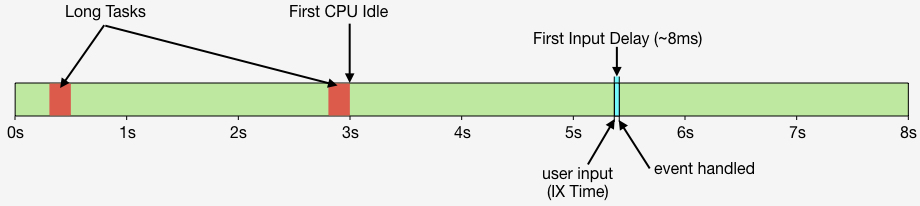
- First CPU Idle measures when the page is no longer janky. Specifically, it is the first span of 5 seconds where the browser main thread is never blocked for more than 50ms after First Contentful Paint. A value of 2-4 seconds is typical.
- First Input Delay measures the gap between when a user interacts with the page (e.g, clicks or scrolls) and when the browser is able to act on that input. First Input Delay values are much lower - a good target is 10ms, but 25ms is common.
- First Interaction Time is when the first user input takes place. This varies widely depending on the type of site and page. A good search results page might have a low First Interaction Time because users scroll and click quickly. A media site might have a high First Interaction Time because users start reading content (headlines, stories) before interacting with the page. At SpeedCurve we call this "IX Time".
- Total Long Task CPU Time is the sum of all long tasks that occur in the page. A "long task" is a browser event that blocks the main thread for more than 50ms.
Here's a figure to help visualize these metrics.
Preload scripts
In my previous post I talked about how loading scripts asynchronously reduces the impact of JavaScript resulting in a (much) faster user experience. But even when scripts are loaded async, the browser may still twiddle its thumbs for a second or more waiting for the first script to arrive. This delay can be decreased by using link rel=preload like this:
<link rel="preload" href="main.js" as="script">An analysis of Chromium's paint timing metrics

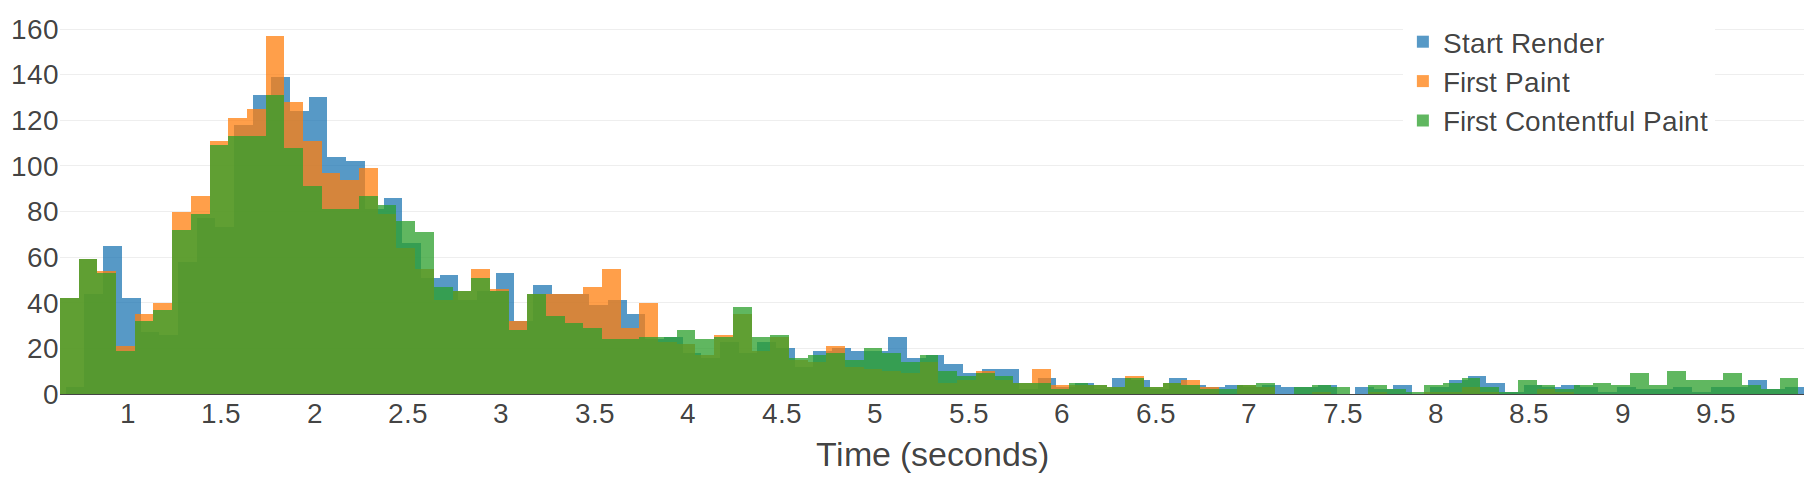
Here at SpeedCurve, we are continually gathering detailed performance data from tens of thousands of web pages. This gives us a relatively unique opportunity to analyse and aggregate performance metrics to gain some interesting insights. In this post, I'm going to analyse some browser-based paint timing metrics: First Paint & First Contentful Paint (defined in the Paint Timing spec and implemented in Chromium). I'm also going to analyse First Meaningful Paint (defined in a draft spec and implemented as a Chromium trace metric).
What are paint timing metrics?
The aim of almost any performance optimisation on the web is to improve the user experience. The folk at Google have been pushing this sentiment with a focus on user-centric performance metrics, which aim to answer four questions about users’ experiences:
- Is it happening? Is the page that I want to see actually loading?
- Is it useful? Has enough content rendered that I can engage with it?
- Is it usable? Can I scroll and interact with the page, or is it still loading?
- Is it delightful? Are my interactions with the page smooth?
First Paint (FP) measures the point at which pixels are first rendered to the screen after navigating to a new page. First Contentful Paint (FCP) is slightly more specific, in that it measures the point at which text or graphics are first rendered to the screen. Both of these metrics are available in Chromium browsers (Chrome, Opera, Samsung Internet, etc) via the Performance API: performance.getEntriesByType('paint').
The paint timing metrics are important because they aim to answer the first question: is it happening? My analysis will look at performance data from some popular websites in an attempt to figure out whether the paint timing metrics really do answer that question.
Introducing Last Painted Hero
We're excited to announce that we've launched Last Painted Hero as an official metric. Last Painted Hero is a synthetic metric that shows you when the last piece of critical content is painted. Keep reading to learn how Last Painted Hero works, why (and how) we created it, and how it can help you understand how your users perceive the speed of your pages.
The case for smarter heuristics
When choosing the right performance metric, my soapbox for the last few years has been "not every pixel has the same value". In other words, rather than chase dozens of different performance metrics, focus on the metrics that measure what's critical in your page.
Here at SpeedCurve, we think it's good to focus on rendering metrics, because they're a closer approximation to what the user experiences. There are some good rendering metrics out there, like start render and Speed Index, but the downside to these metrics is that they give every pixel the same value. For example, if the background renders and some ads render, that could improve your start render time and Speed Index score, but it might not have a big impact on the user's experience. Instead, it's better to measure the parts of the page that matter the most to users. We call those parts of the page the "hero elements".
Evaluating rendering metrics
At SpeedCurve, we're fond of the phrase "a joyous user experience". Creating this joy requires delivering what users want as quickly as possible. It's important that the critical content is downloaded and rendered before users get frustrated.
Network metrics have been around for decades, but rendering metrics are newer. Speed Index. Start Render. Time to First Interactive. First Meaningful Paint. These are a few of the rendering metrics that currently exist. What do they mean? How do they compare? Which are best for you? Let's take a look.
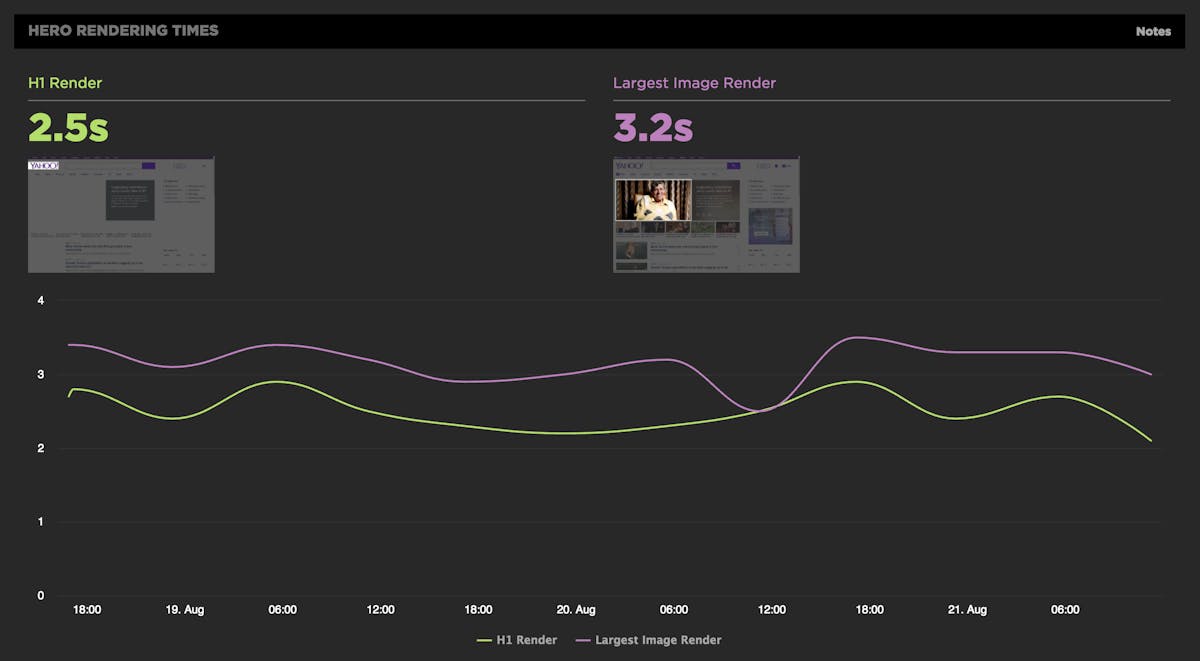
Hero Rendering Times: New metrics for measuring UX

The key to a good user experience is quickly delivering the content your visitors care about the most. This is easy to say, but tricky to do. Every site has unique content and user engagement goals, which is why measuring how fast critical content renders has historically been a challenging task.
That's why we're very excited to introduce Hero Rendering Times, a set of new metrics for measuring the user experience. Hero Times measure when a page's most important content finishes rendering in the browser. These metrics are available right now to SpeedCurve users.
More on how Hero Rendering Times work further down in this post. But first, I want to give a bit of back story that explains how we got to here.
Measuring Blocking Resources
SpeedCurve reports the number of critical blocking resources in the page. These are the resources that block rendering. Since it's important that users see your content as quickly as possible, it's important to know what might be causing your page to render slowly. We recently enhanced the way we measure blocking resources and wanted to share those improvements with our customers as well as the performance community at large.
The main culprits that block rendering are scripts and stylesheets that are loaded synchronously. A great way to avoid this blocking problem is to load your scripts and stylesheets asynchronously. You can do that for scripts by using the async and defer attributes, plus other programmatic techniques. Loading stylesheets asynchronously is less popular but is still possible using techniques like loadCSS.
Measuring the User Experience
SpeedCurve’s sweet spot is the intersection of design and performance - where the user experience lives. Other monitoring services focus on network behavior and the mechanics of the browser. Yet users rarely complain that “the DNS lookups are too slow” or “the load event fired late”. Instead, users get frustrated when they have to wait for the content they care about to appear on the screen.
The key to a good user experience is quickly delivering the critical content.
Critical Blocking Resources
At SpeedCurve, we focus on metrics that capture the user experience. A big part of the user experience is when content actually appears in front of the user. Since stylesheets and synchronous scripts are the culprits when it comes to blocking rendering, we've rolled out some new metrics that focus on these critical blocking resources.
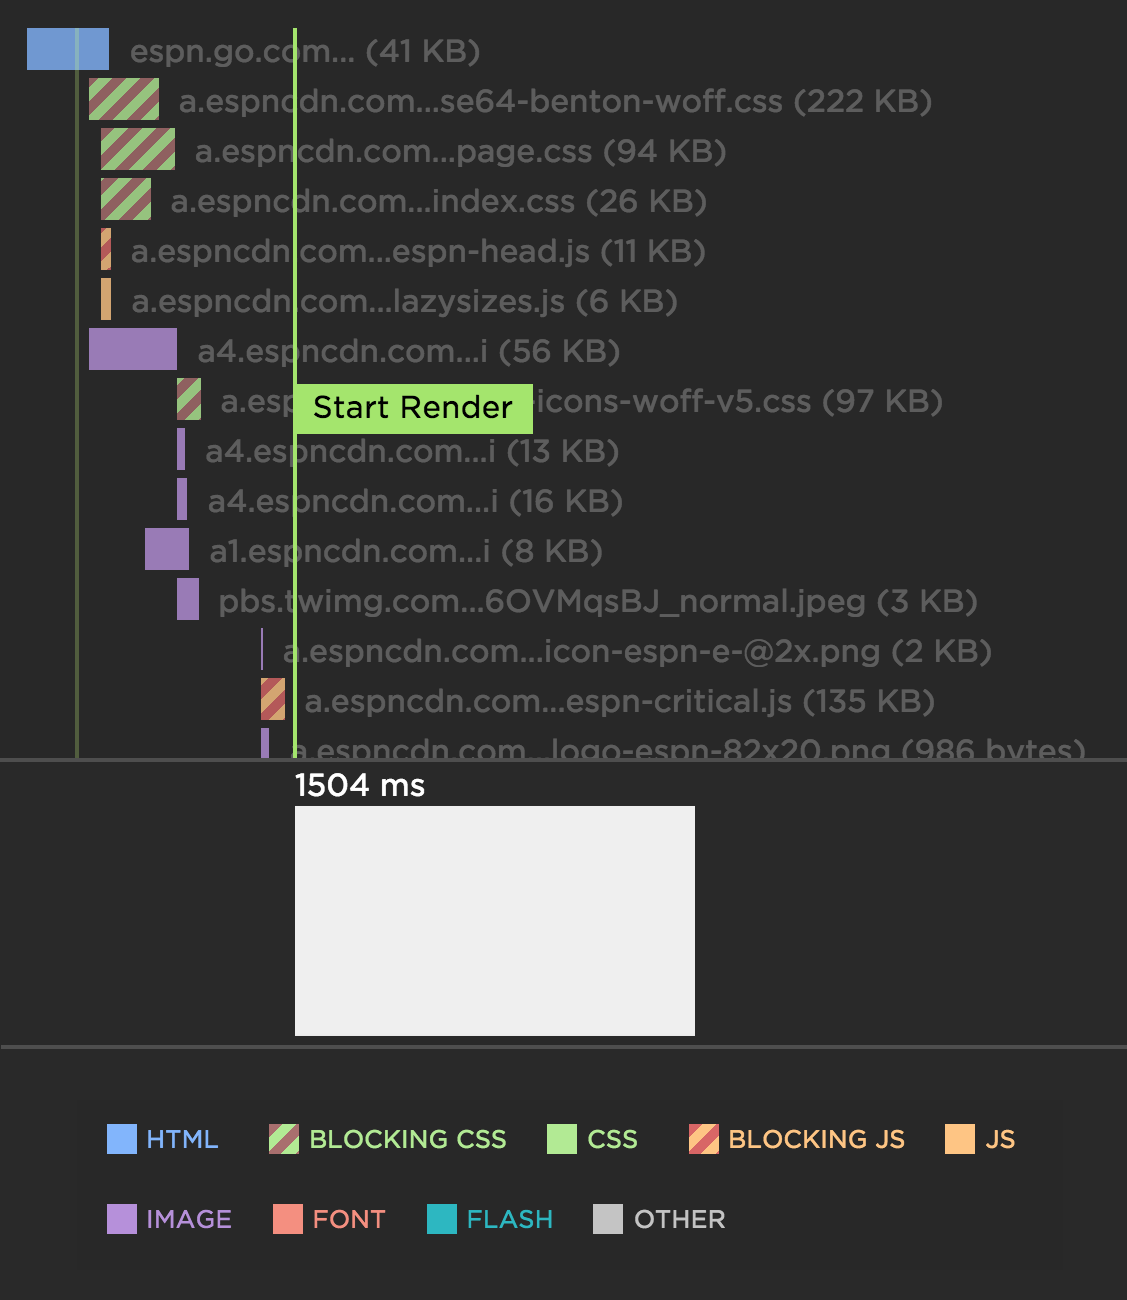
The most helpful innovation we made is to highlight the critical blocking stylesheets and synchronous scripts in our waterfall charts. In the following example waterfall chart for ESPN, notice how the critical stylesheets (green) and synchronous scripts (orange) have a red hash pattern. Not surprisingly, the Start Render metric is delayed until after the last of these critical blocking resources is done loading. The "scrubber" at the bottom of the waterfall (showing the screenshot at that point in time) confirms that rendering has been blocked up to this point. Explore an example of a interactive waterfall chart.
Performance budgets in action

Performance budgets are an important tool for ensuring your site is delivering a great user experience. Steve first experienced performance budgets while Head Performance Engineer at Google. The practice of using budgets to track performance took off with Tim Kadlec's blog post Setting a Performance Budget. The idea is to identify your performance goals and track the metrics that help you achieve your goals.
At SpeedCurve, we give performance budgets first-class status by tracking them in the Site dashboard. Here's an example of tracking a budget for image size.
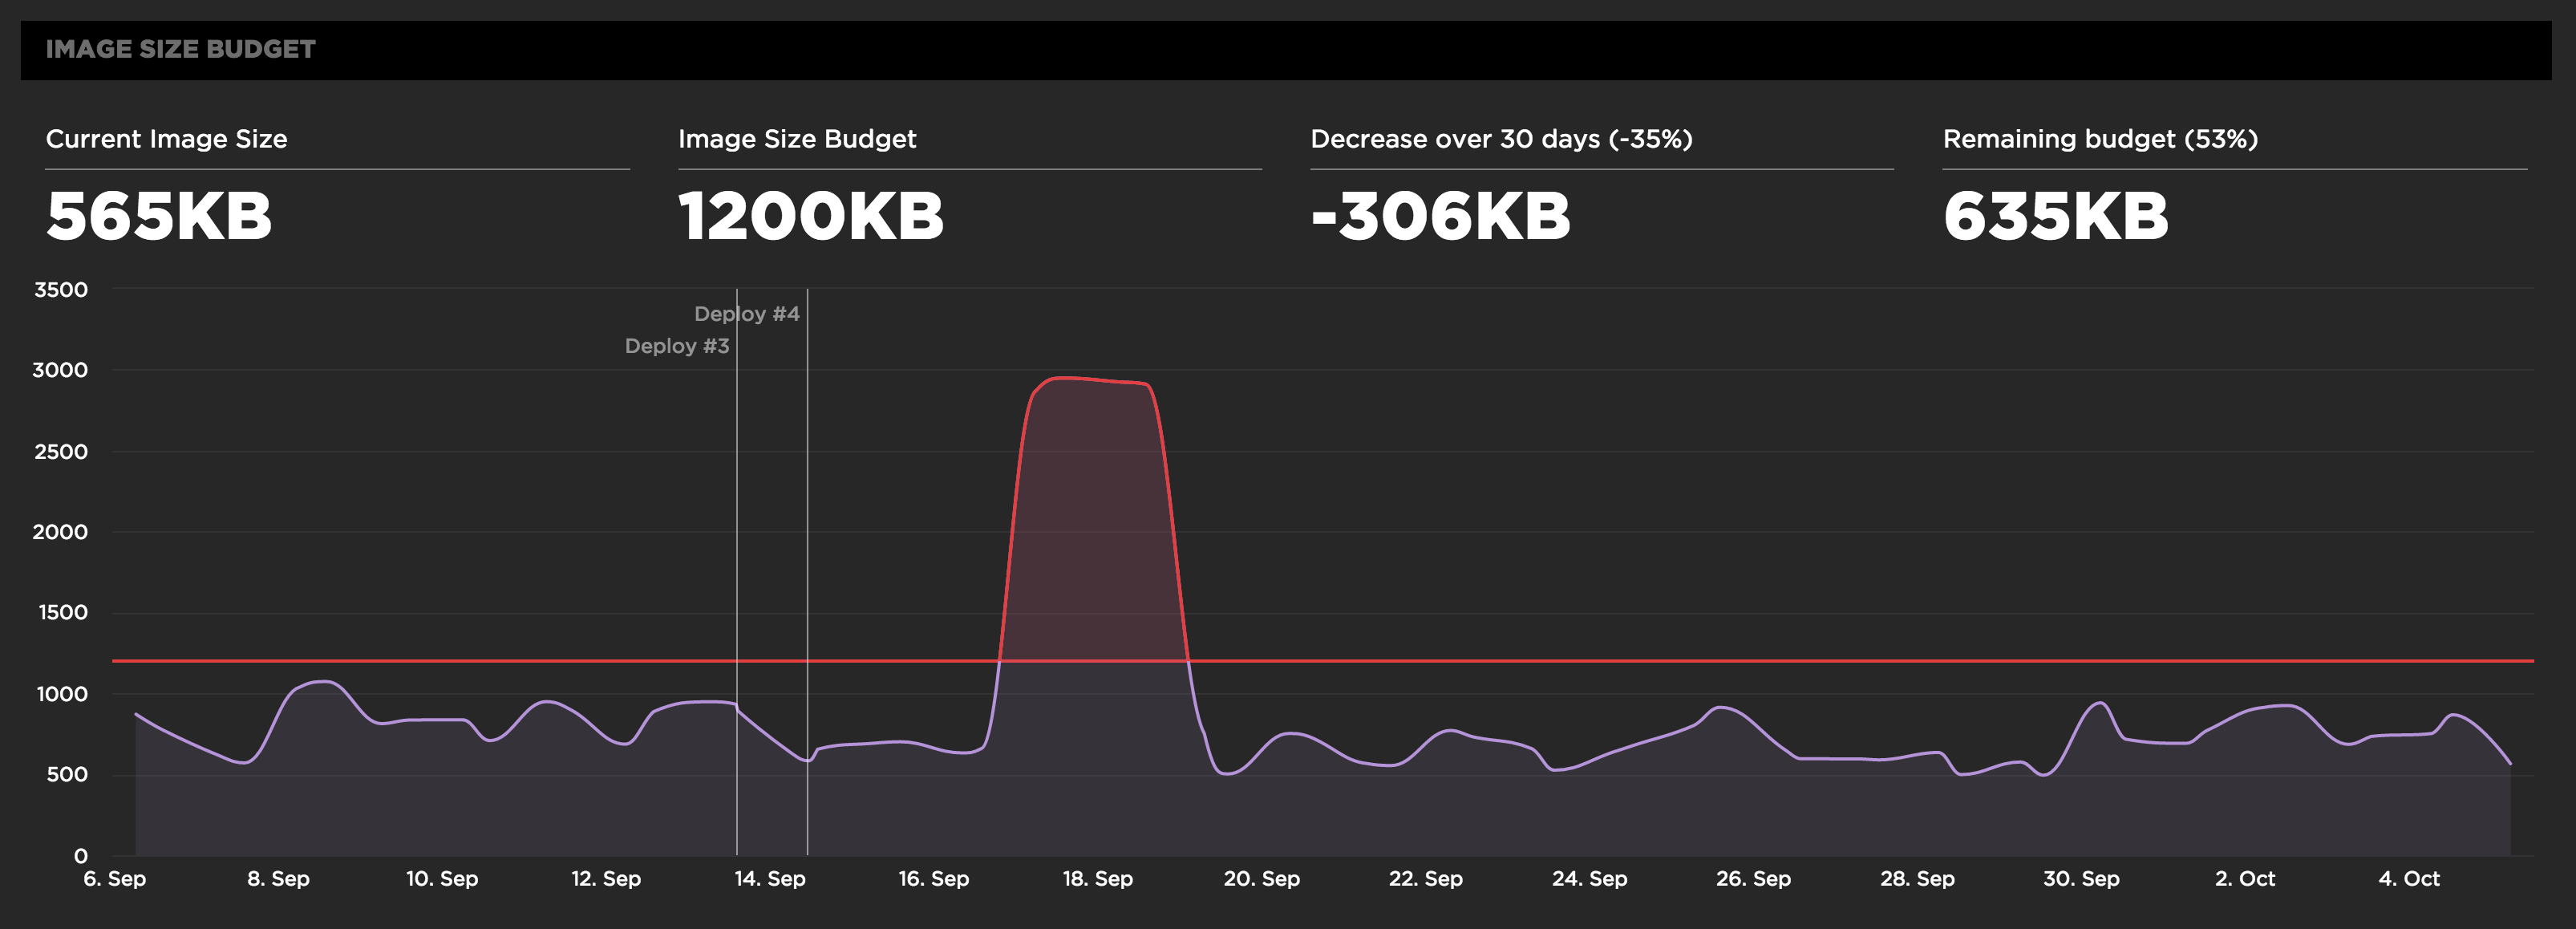
Before setting your performance budgets, you first have to be monitoring your user experience. Only then can you set budgets and thresholds for improving your baseline user experience. This also allows you to quantify the improvements you're making and share success stories across the organization like "We just improved start render by 32% by reducing image requests to half the budgeted amount".
