SpeedCurve is now part of the Embrace family! There are no changes to how you use our products. Our founder Mark shares what this means...
Debugging Interaction to Next Paint (INP)

Not surprisingly, most of the conversations I've had with SpeedCurve users over the last few months have focused on improving INP.
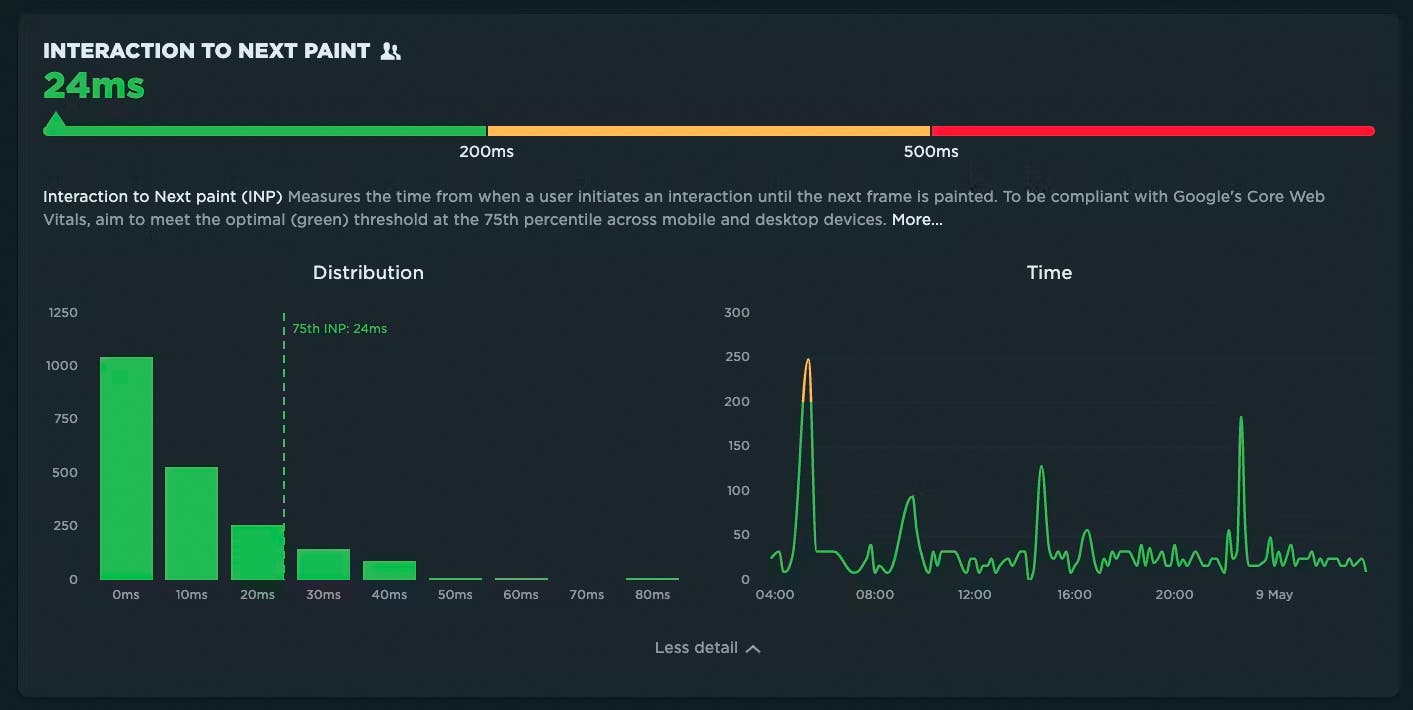
INP measures how responsive a page is to visitor interactions. It measures the elapsed time between a tap, a click, or a keypress and the browser next painting to the screen.
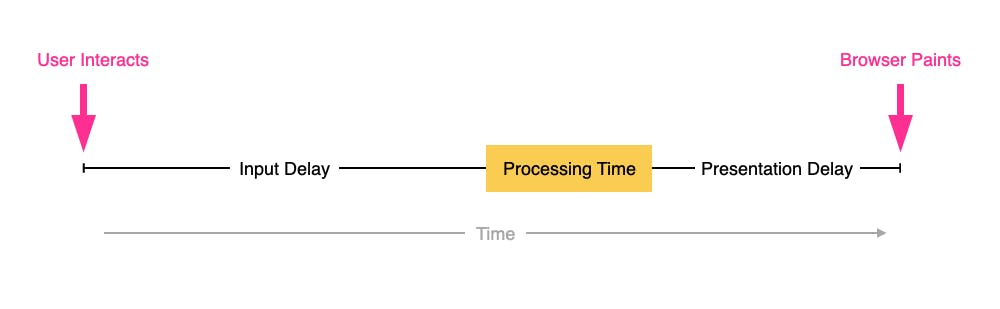
INP breaks down into three sub-parts
- Input Delay – How long the interaction handler has to wait before executing
- Processing Time – How long the interaction handler takes to execute
- Presentation Delay – How long it takes the browser to execute any work it needs to paint updates triggered by the interaction handler
Pages can have multiple interactions, so the INP time you'll see reported by RUM products and other tools, such as Google Search Console and Chrome's UX Report (CrUX), will generally be the worst/highest INP time at the 75th percentile.
Like all Core Web Vitals, INP has a set of thresholds:
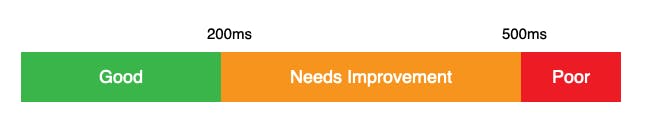
INP thresholds for Good, Needs Improvement, and Poor
Many sites tend to be in the Needs Improvement or Poor categories. My experience over the last few months is that getting to Good is achievable, but it's not always easy.
In this post I'm going to walk through:
- How I help people identify the causes of poor INP times
- Examples of some of the most common issues
- Approaches I've used to help sites improve their INP
How to find (and fix!) INP interactions on your pages

Andy Davies – fellow SpeedCurver and web performance consultant extraordinaire – recently shared an impressive Interaction to Next Paint (INP) success:
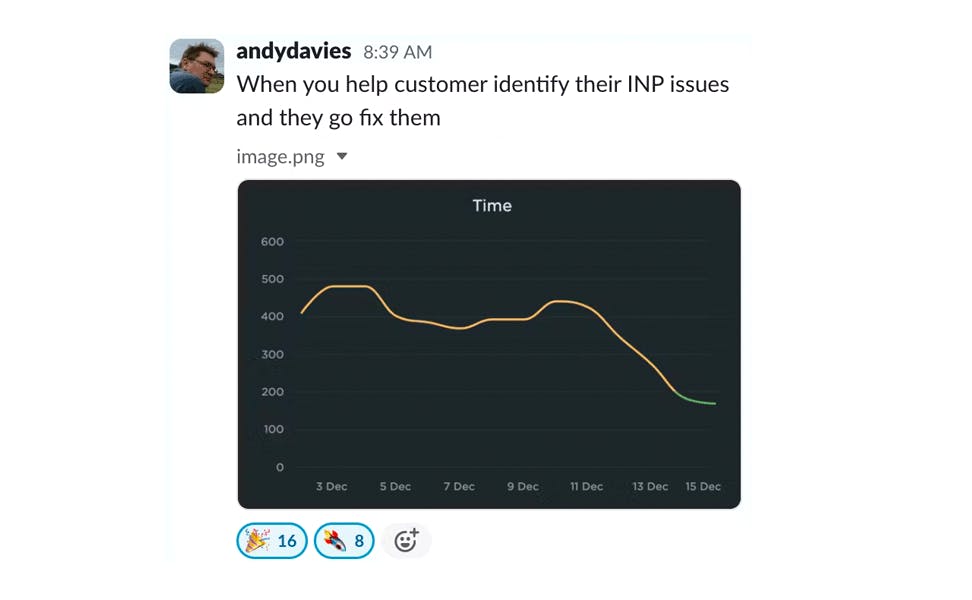
Andy has promised us a more in-depth post on debugging Interaction to Next Paint. While he's working on that, I'll try not to steal his thunder while I share a tip that may help you identify element(s) causing INP issues for your pages.
Mobile INP performance: The elephant in the room

Earlier this year, when Google announced that Interaction to Next Paint (INP) will replace First Input Delay (FID) as the responsiveness metric in Core Web Vitals in *gulp* March of 2024, we had a lot to say about it. (TLDR: FID doesn't correlate with real user behavior, so we don't endorse it as a meaningful metric.)
Our stance hasn't changed much since then. For the most part, everyone agrees the transition from FID to INP is a good thing. INP certainly seems to be capturing interaction issues that we see in the field.
However, after several months of discussing the impending change and getting a better look at INP issues in the wild, it's hard to ignore the fact that mobile stands out as the biggest INP offender by a wide margin. This doesn't get talked about as much as it should, so in this post we'll explore:
- The gap between "good" INP for desktop vs mobile
- Working theories as to why mobile INP is so much poorer than desktop INP
- Correlating INP with user behavior and business metrics (like conversion rate)
- How you can track and improve INP for your pages
Does Interaction to Next Paint actually correlate to user behavior?
Earlier this year, Google announced that Interaction to Next Paint (INP) is no longer an experimental metric. INP will replace First Input Delay (FID) as a Core Web Vital in March of 2024.
Now that INP has arrived to dethrone FID as the responsiveness metric in Core Web Vitals, we've turned our eye to scrutinizing its effectiveness. In this post, we'll look at real-world data and attempt to answer: What correlation – if any – does INP have with actual user behavior and business metrics?
Farewell FID... and hello Interaction to Next Paint!
Today at Google I/O 2023, it was announced that Interaction to Next Paint (INP) is no longer an experimental metric. INP will replace First Input Delay (FID) as a Core Web Vital in March of 2024.
It's been three years since the Core Web Vitals initiative was kicked off in May 2020. In that time, we've seen people's interest in performance dramatically increase, especially in the world of SEO. It's been hugely helpful to have a simple set of three metrics – focused on loading, interactivity, and responsiveness – that everyone can understand and focus on.
During this time, SpeedCurve has stayed objective when looking at the CWV metrics. When it comes to new performance metrics, it's easy to jump on hype-fuelled bandwagons. While we definitely get excited about emerging metrics, we also approach each new metric with an analytical eye. For example, back in November 2020, we took a closer look at one of the Core Web Vitals, First Input Delay, and found that it was sort of 'meh' overall when it came to meaningfully correlating with actual user behavior.
Now that INP has arrived to dethrone FID as the responsiveness metric for Core Web Vitals, we've turned our eye to scrutinizing its effectiveness.
In this post, we'll take a closer look and attempt to answer:
- What is Interaction to next Paint?
- How does INP compare to FID?
- What is a 'good' INP result?
- Will there be differences between INP collected in RUM vs. Chrome User Experience Report (CrUX)?
- What correlation does INP have with real user behavior?
- When should you start caring about INP?
- How can you see INP for your own site in SpeedCurve?
Onward!
NEW! Chrome Beta and Canary support & LCP element highlighting
Phew! Between the fast-paced release cycle for Chrome and the rapid evolution of Core Web Vitals, the month of May has been a busy one here at SpeedCurve. With that, we are excited to bring you some new features and enhancements to help you stay focused and ahead of the game as we move into summer.
Read on to learn more about:
- Chrome Beta and Canary support
- Largest Contentful Paint (LCP) element highlighting
- Key rendering times
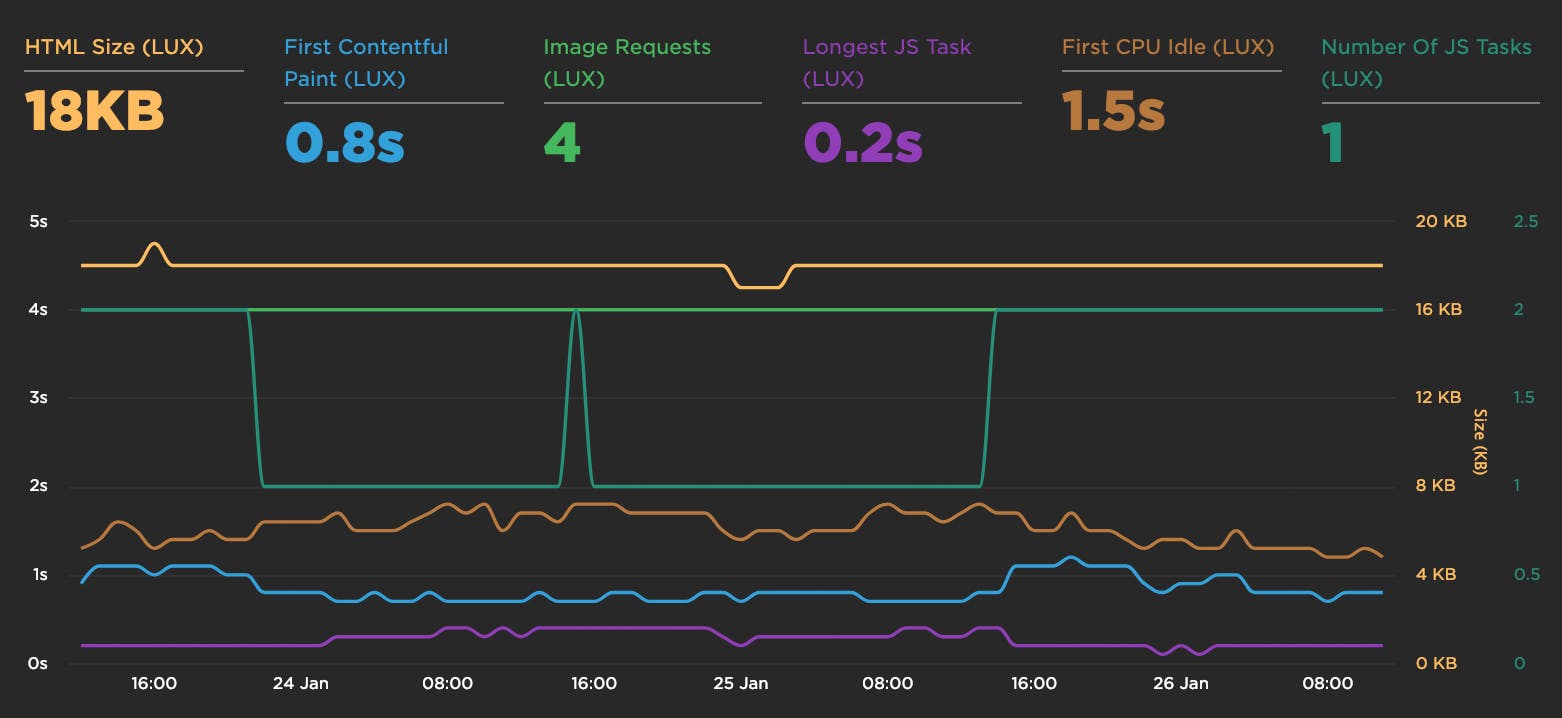
New LUX metrics

Over the winter holiday we added a bunch of new metrics to LUX:
- First Contentful Paint
- First CPU Idle
- Longest Long Task
- Number of Long Tasks
- Connection type
- HTML transfer size
- Total # of image requests
An analysis of Chromium's paint timing metrics

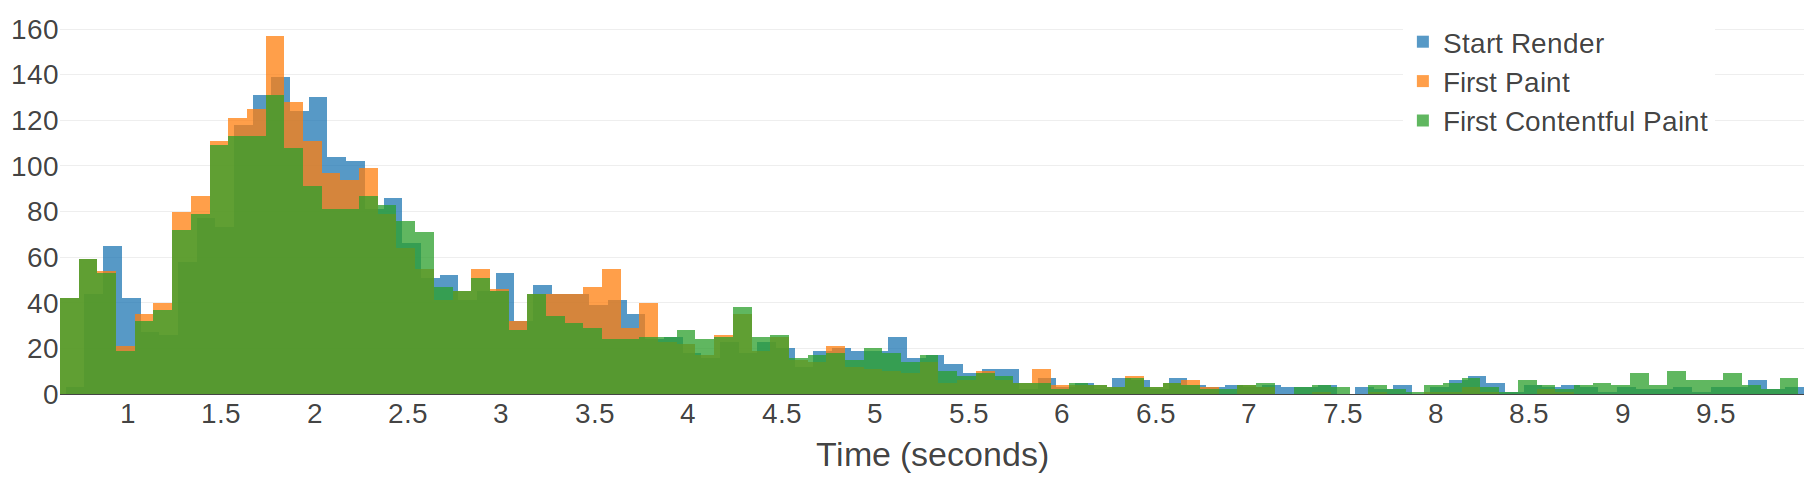
Here at SpeedCurve, we are continually gathering detailed performance data from tens of thousands of web pages. This gives us a relatively unique opportunity to analyse and aggregate performance metrics to gain some interesting insights. In this post, I'm going to analyse some browser-based paint timing metrics: First Paint & First Contentful Paint (defined in the Paint Timing spec and implemented in Chromium). I'm also going to analyse First Meaningful Paint (defined in a draft spec and implemented as a Chromium trace metric).
What are paint timing metrics?
The aim of almost any performance optimisation on the web is to improve the user experience. The folk at Google have been pushing this sentiment with a focus on user-centric performance metrics, which aim to answer four questions about users’ experiences:
- Is it happening? Is the page that I want to see actually loading?
- Is it useful? Has enough content rendered that I can engage with it?
- Is it usable? Can I scroll and interact with the page, or is it still loading?
- Is it delightful? Are my interactions with the page smooth?
First Paint (FP) measures the point at which pixels are first rendered to the screen after navigating to a new page. First Contentful Paint (FCP) is slightly more specific, in that it measures the point at which text or graphics are first rendered to the screen. Both of these metrics are available in Chromium browsers (Chrome, Opera, Samsung Internet, etc) via the Performance API: performance.getEntriesByType('paint').
The paint timing metrics are important because they aim to answer the first question: is it happening? My analysis will look at performance data from some popular websites in an attempt to figure out whether the paint timing metrics really do answer that question.
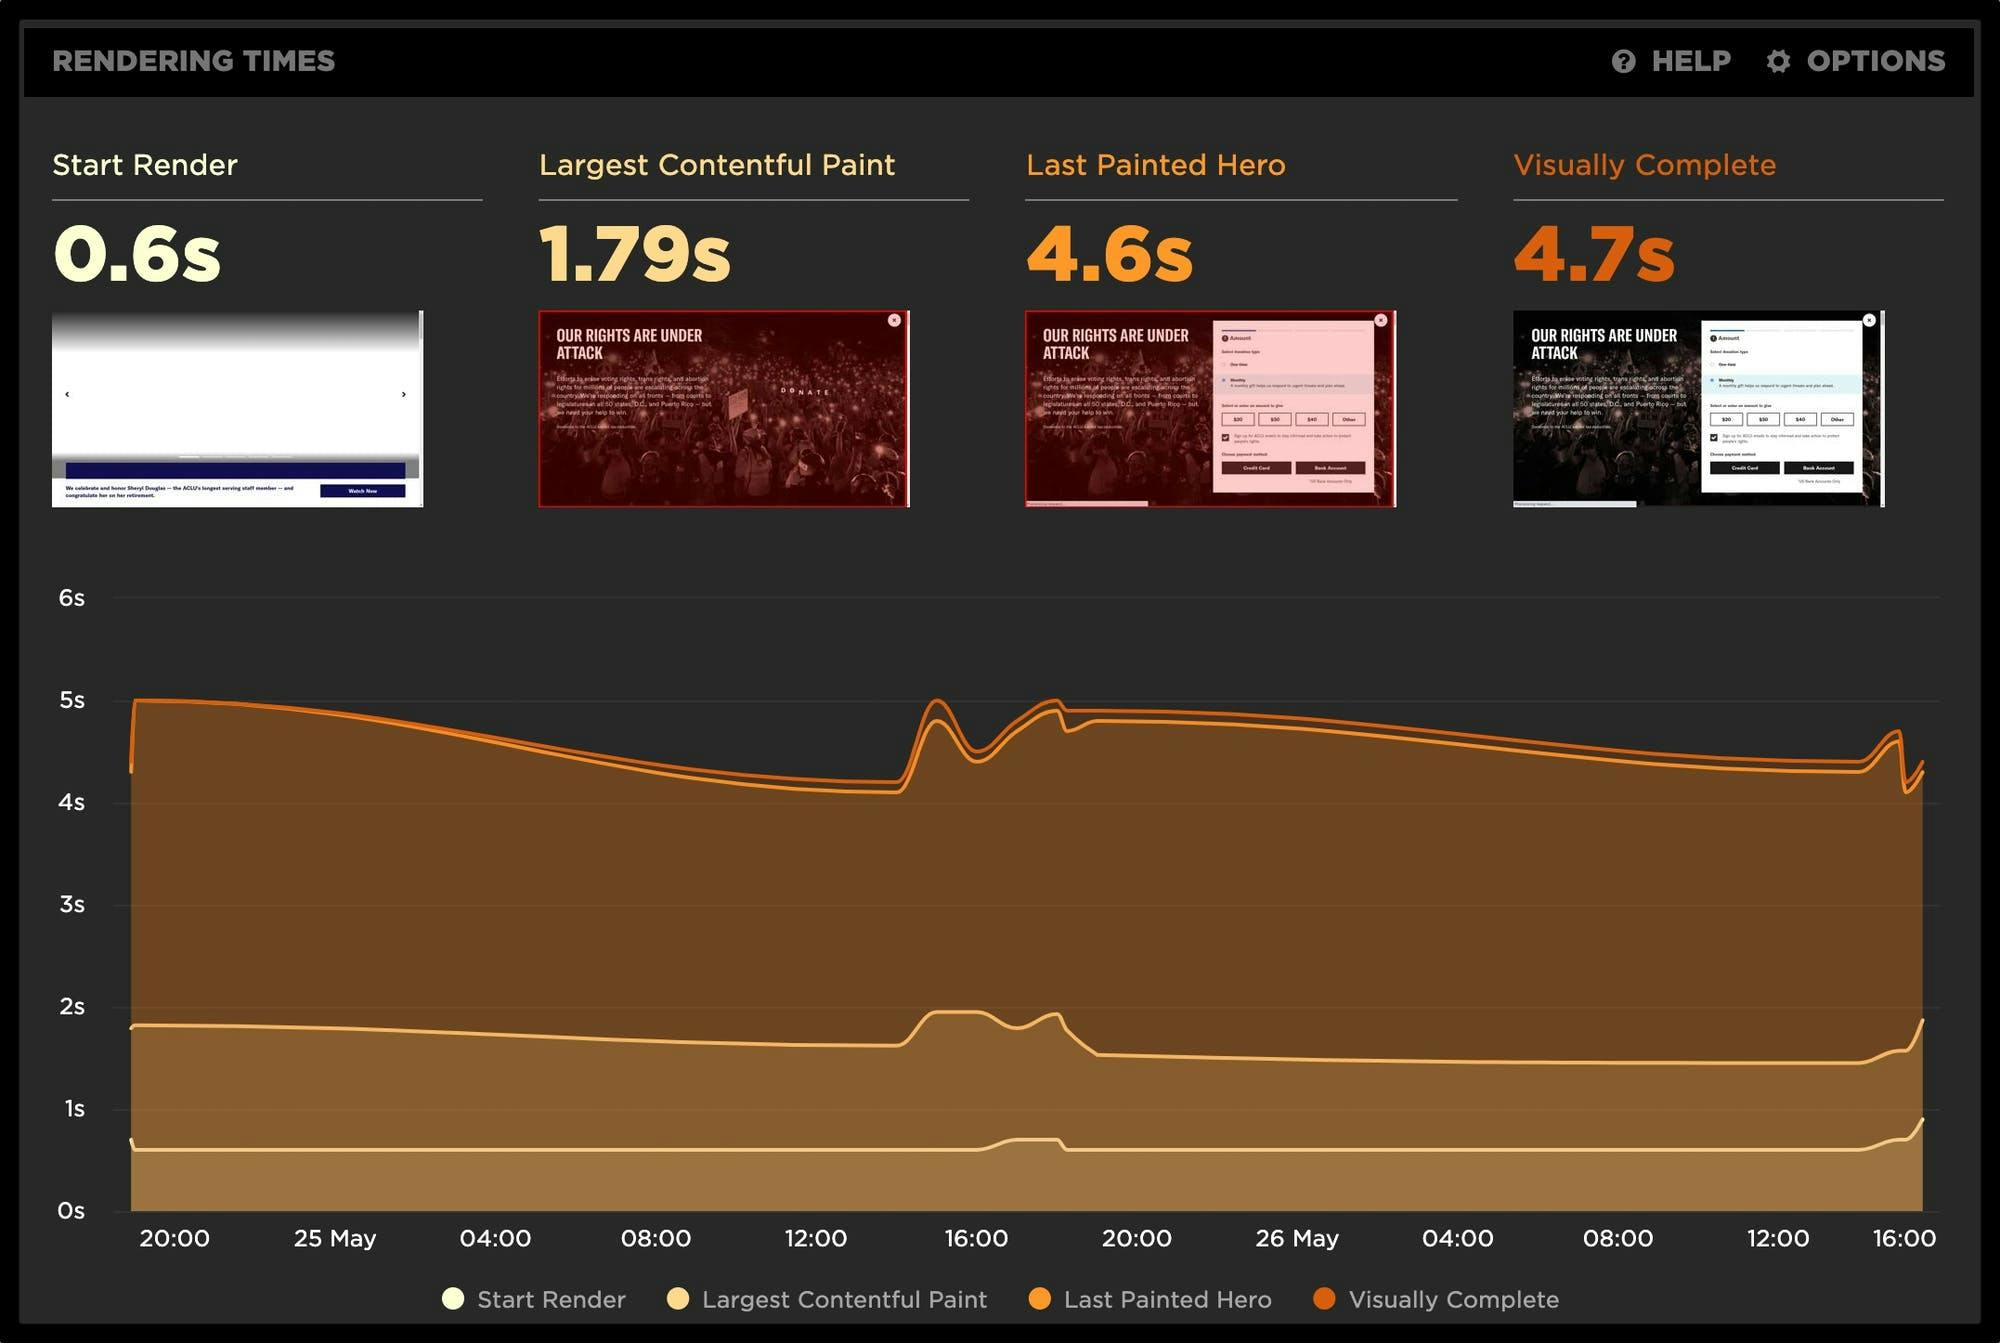
Introducing Last Painted Hero
We're excited to announce that we've launched Last Painted Hero as an official metric. Last Painted Hero is a synthetic metric that shows you when the last piece of critical content is painted. Keep reading to learn how Last Painted Hero works, why (and how) we created it, and how it can help you understand how your users perceive the speed of your pages.
The case for smarter heuristics
When choosing the right performance metric, my soapbox for the last few years has been "not every pixel has the same value". In other words, rather than chase dozens of different performance metrics, focus on the metrics that measure what's critical in your page.
Here at SpeedCurve, we think it's good to focus on rendering metrics, because they're a closer approximation to what the user experiences. There are some good rendering metrics out there, like start render and Speed Index, but the downside to these metrics is that they give every pixel the same value. For example, if the background renders and some ads render, that could improve your start render time and Speed Index score, but it might not have a big impact on the user's experience. Instead, it's better to measure the parts of the page that matter the most to users. We call those parts of the page the "hero elements".
Evaluating rendering metrics
At SpeedCurve, we're fond of the phrase "a joyous user experience". Creating this joy requires delivering what users want as quickly as possible. It's important that the critical content is downloaded and rendered before users get frustrated.
Network metrics have been around for decades, but rendering metrics are newer. Speed Index. Start Render. Time to First Interactive. First Meaningful Paint. These are a few of the rendering metrics that currently exist. What do they mean? How do they compare? Which are best for you? Let's take a look.
