SpeedCurve is now part of the Embrace family! There are no changes to how you use our products. Our founder Mark shares what this means...
How to use Server Timing to get backend transparency from your CDN


80% of end-user response time is spent on the front end.
That performance golden rule still holds true today. However, that pesky 20% on the back end can have a big impact on downstream metrics like First Contentful Paint (FCP), Largest Contentful Paint (LCP), and any other 'loading' metric you can think of.
Server-timing headers are a key tool in understanding what's happening within that black box of Time to First Byte (TTFB).
In this post we'll explore a few areas:
- Look at industry benchmarks to get an idea of how a slow backend influences key metrics, including Core Web Vitals
- Demonstrate how you can use server-timing headers to break down where that time is being spent
- Provide examples of how you can use server-timing headers to get more visibility into your content delivery network (CDN)
- Show how you can capture server-timing headers in SpeedCurve
The psychology of site speed and human happiness


In the fourteen years that I've been working in the web performance industry, I've done a LOT of research, writing, and speaking about the psychology of page speed – in other words, why we crave fast, seamless online experiences. In fact, the entire first chapter of my book, Time Is Money (reprinted here courtesy of the good folks at O'Reilly), is dedicated to the subject.
I recently shared some of my favourite research at Beyond Tellerrand (video here) and thought it would be fun to round it up in a post. Here we're going to cover:
- Why time is a crucial (and often neglected) usability factor
- How we perceive wait times
- Why our memory is unreliable
- How the end of an experience has a disproportionate effect on our perception
- How fast we expect pages to be (and why)
- "Flow" and what it means in terms of how we use the web
- How delays hurt our productivity
- What we can learn from measuring "web stress"
- How slowness affects our entire perception of a brand
There's a lot of fascinating material to cover, so let's get started!
Building the future of web performance with SpeedCurve


I’m beyond excited to announce that I’m joining the SpeedCurve team this year! I’ll still be doing some consulting work, but I’ll be taking on a few less clients this year so I can focus on helping to make an already amazing performance tool even better, working alongside some of my favorite people in the performance community.
How to find (and fix!) INP interactions on your pages
Andy Davies – fellow SpeedCurver and web performance consultant extraordinaire – recently shared an impressive Interaction to Next Paint (INP) success:
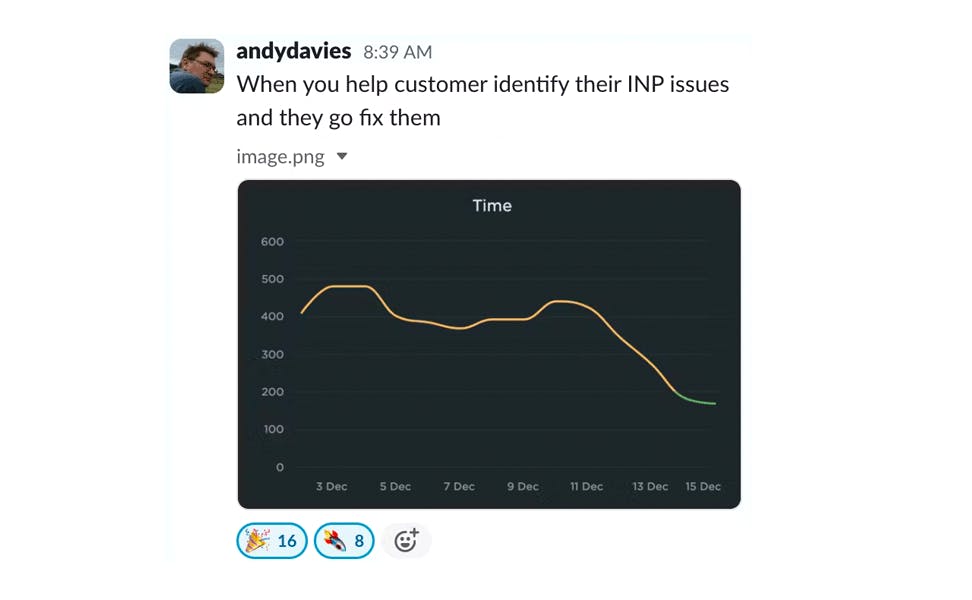
Andy has promised us a more in-depth post on debugging Interaction to Next Paint. While he's working on that, I'll try not to steal his thunder while I share a tip that may help you identify element(s) causing INP issues for your pages.
2023 recap: This year was all about making performance easy (well, easier)

Every year feels like a big year here at SpeedCurve, and 2023 was no exception.
Among other things, we turned ten! Ten years is a lot of time to reflect, and over this past year our team has been thinking a lot about not just the "what" and "how" of web performance, but also the "why". Why should we – and you – care about delivering a fast, delightful experience to all your users? This "why" informs all the choices we make about the "what" and "how" of our tools.
Looking back over the past year, if I were to pick a word that defined our goals, that word would be "easier". It's no secret that the past couple of years have been challenging for the tech community. In the current landscape of smaller teams, aggressive goals, and an ever-increasing tech stack, how can we make it easier for you to create impact?
Our biggest achievements this year have centred on making it easier for you to:
- Fight regressions and keep your sites fast
- Measure the impact of Core Web Vitals on actual user experience
- See correlations between site speed and business metrics
- Visualize your data
- Leverage synthetic and real user monitoring
- Focus on what matters
- Get help when you need it
Keep reading to learn more...
How to automatically test the performance of your GitHub pull requests


As highlighted in our December product update, we've been making a lot of improvements in the area of CI/CD. In addition to the new Deployments dashboards and Notes updates, we've launched a new GitHub integration. Our purpose in building this integration is to lower the barrier for getting web performance feedback for your code changes, directly in the environment you are working in.
Follow along below for an example of how you can use this integration in practice to fight web performance regressions and keep your pages fast.
Performance audit: Lego.com

I love LEGO. My kids love LEGO, too, which means that every year I find myself spending a fair bit of time on the LEGO website during the holidays. So I thought it would be fun to spend some time poking around behind the scenes and give the site a holiday performance audit. Keep reading to find out what I learned, and some lessons you may want to apply to your own pages.
NEW! December product update

Holy cow, it's been a busy few months! SpeedCurve turned ten, we attended (and gave talks at) performance.now(), Firefox added support for Largest Contentful Paint (LCP), and oh yeah... we just shipped a ton of stuff! (We wanted to wait until the dust settled around Black Friday/Cyber Monday for all of our friends in retail, which led to a pretty monumental release.)
So get comfy and check out our holiday updates.
Mobile INP performance: The elephant in the room

Earlier this year, when Google announced that Interaction to Next Paint (INP) will replace First Input Delay (FID) as the responsiveness metric in Core Web Vitals in *gulp* March of 2024, we had a lot to say about it. (TLDR: FID doesn't correlate with real user behavior, so we don't endorse it as a meaningful metric.)
Our stance hasn't changed much since then. For the most part, everyone agrees the transition from FID to INP is a good thing. INP certainly seems to be capturing interaction issues that we see in the field.
However, after several months of discussing the impending change and getting a better look at INP issues in the wild, it's hard to ignore the fact that mobile stands out as the biggest INP offender by a wide margin. This doesn't get talked about as much as it should, so in this post we'll explore:
- The gap between "good" INP for desktop vs mobile
- Working theories as to why mobile INP is so much poorer than desktop INP
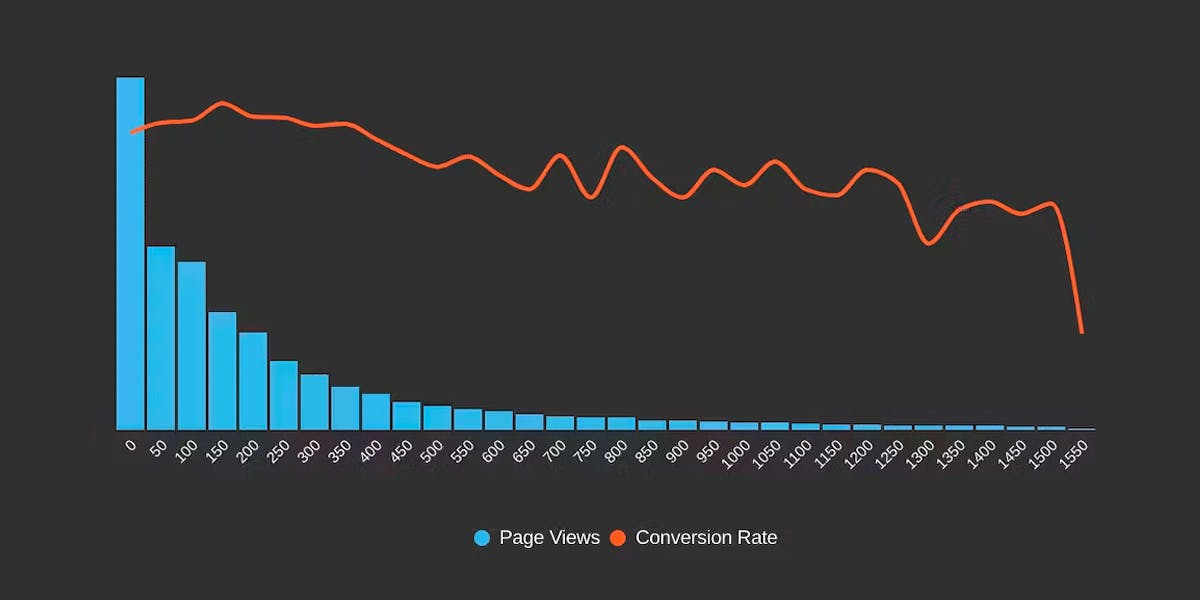
- Correlating INP with user behavior and business metrics (like conversion rate)
- How you can track and improve INP for your pages
Does Interaction to Next Paint actually correlate to user behavior?
Earlier this year, Google announced that Interaction to Next Paint (INP) is no longer an experimental metric. INP will replace First Input Delay (FID) as a Core Web Vital in March of 2024.
Now that INP has arrived to dethrone FID as the responsiveness metric in Core Web Vitals, we've turned our eye to scrutinizing its effectiveness. In this post, we'll look at real-world data and attempt to answer: What correlation – if any – does INP have with actual user behavior and business metrics?
