SpeedCurve is now part of the Embrace family! There are no changes to how you use our products. Our founder Mark shares what this means...
Exploring performance and conversion rates just got easier

Demonstrating the impact of performance on your users – and on your business – is one of the best ways to get your company to care about the speed of your site.
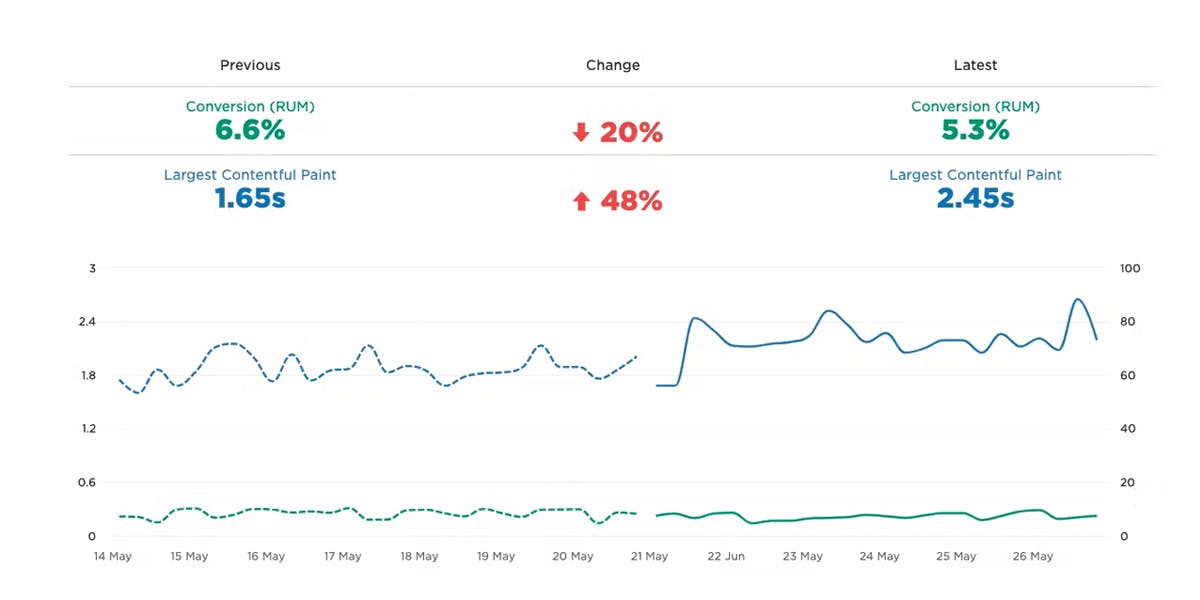
Tracking goal-based metrics like conversion rate alongside performance data can give you richer and more compelling insights into how the performance of your site affects your users. This concept is not new by any means. In 2010, the Performance and Reliability team I was fortunate enough to lead at Walmartlabs shared our findings around the impact of front-end times on conversion rates. (This study and a number of other case studies tracked over the years can be found at WPOstats.)
Setting up conversion tracking in SpeedCurve RUM is fairly simple and definitely worthwhile. This post covers:
- What is a conversion?
- How to track conversions in SpeedCurve
- Using conversion data with performance data for maximum benefit
- Conversion tracking and user privacy
NEW! RUM Compare dashboard
Exploring real user (RUM) data can be a hugely enlightening process. It uncovers things about your users and their behavior that you never might have suspected. That said, it's not uncommon to spend precious time peeling back the layers of the onion, only to find false positives or uncertainty in all that data.
At SpeedCurve, we believe a big part of our job is making your job easier. This was a major driver behind the Synthetic Compare dashboard we released last year, which so many of you given us great feedback on.
As you may have guessed, since then we've been hard at work coming up with the right way to explore and compare your RUM datasets using a similar design pattern. Today, we are thrilled to announce your new RUM Compare dashboard!
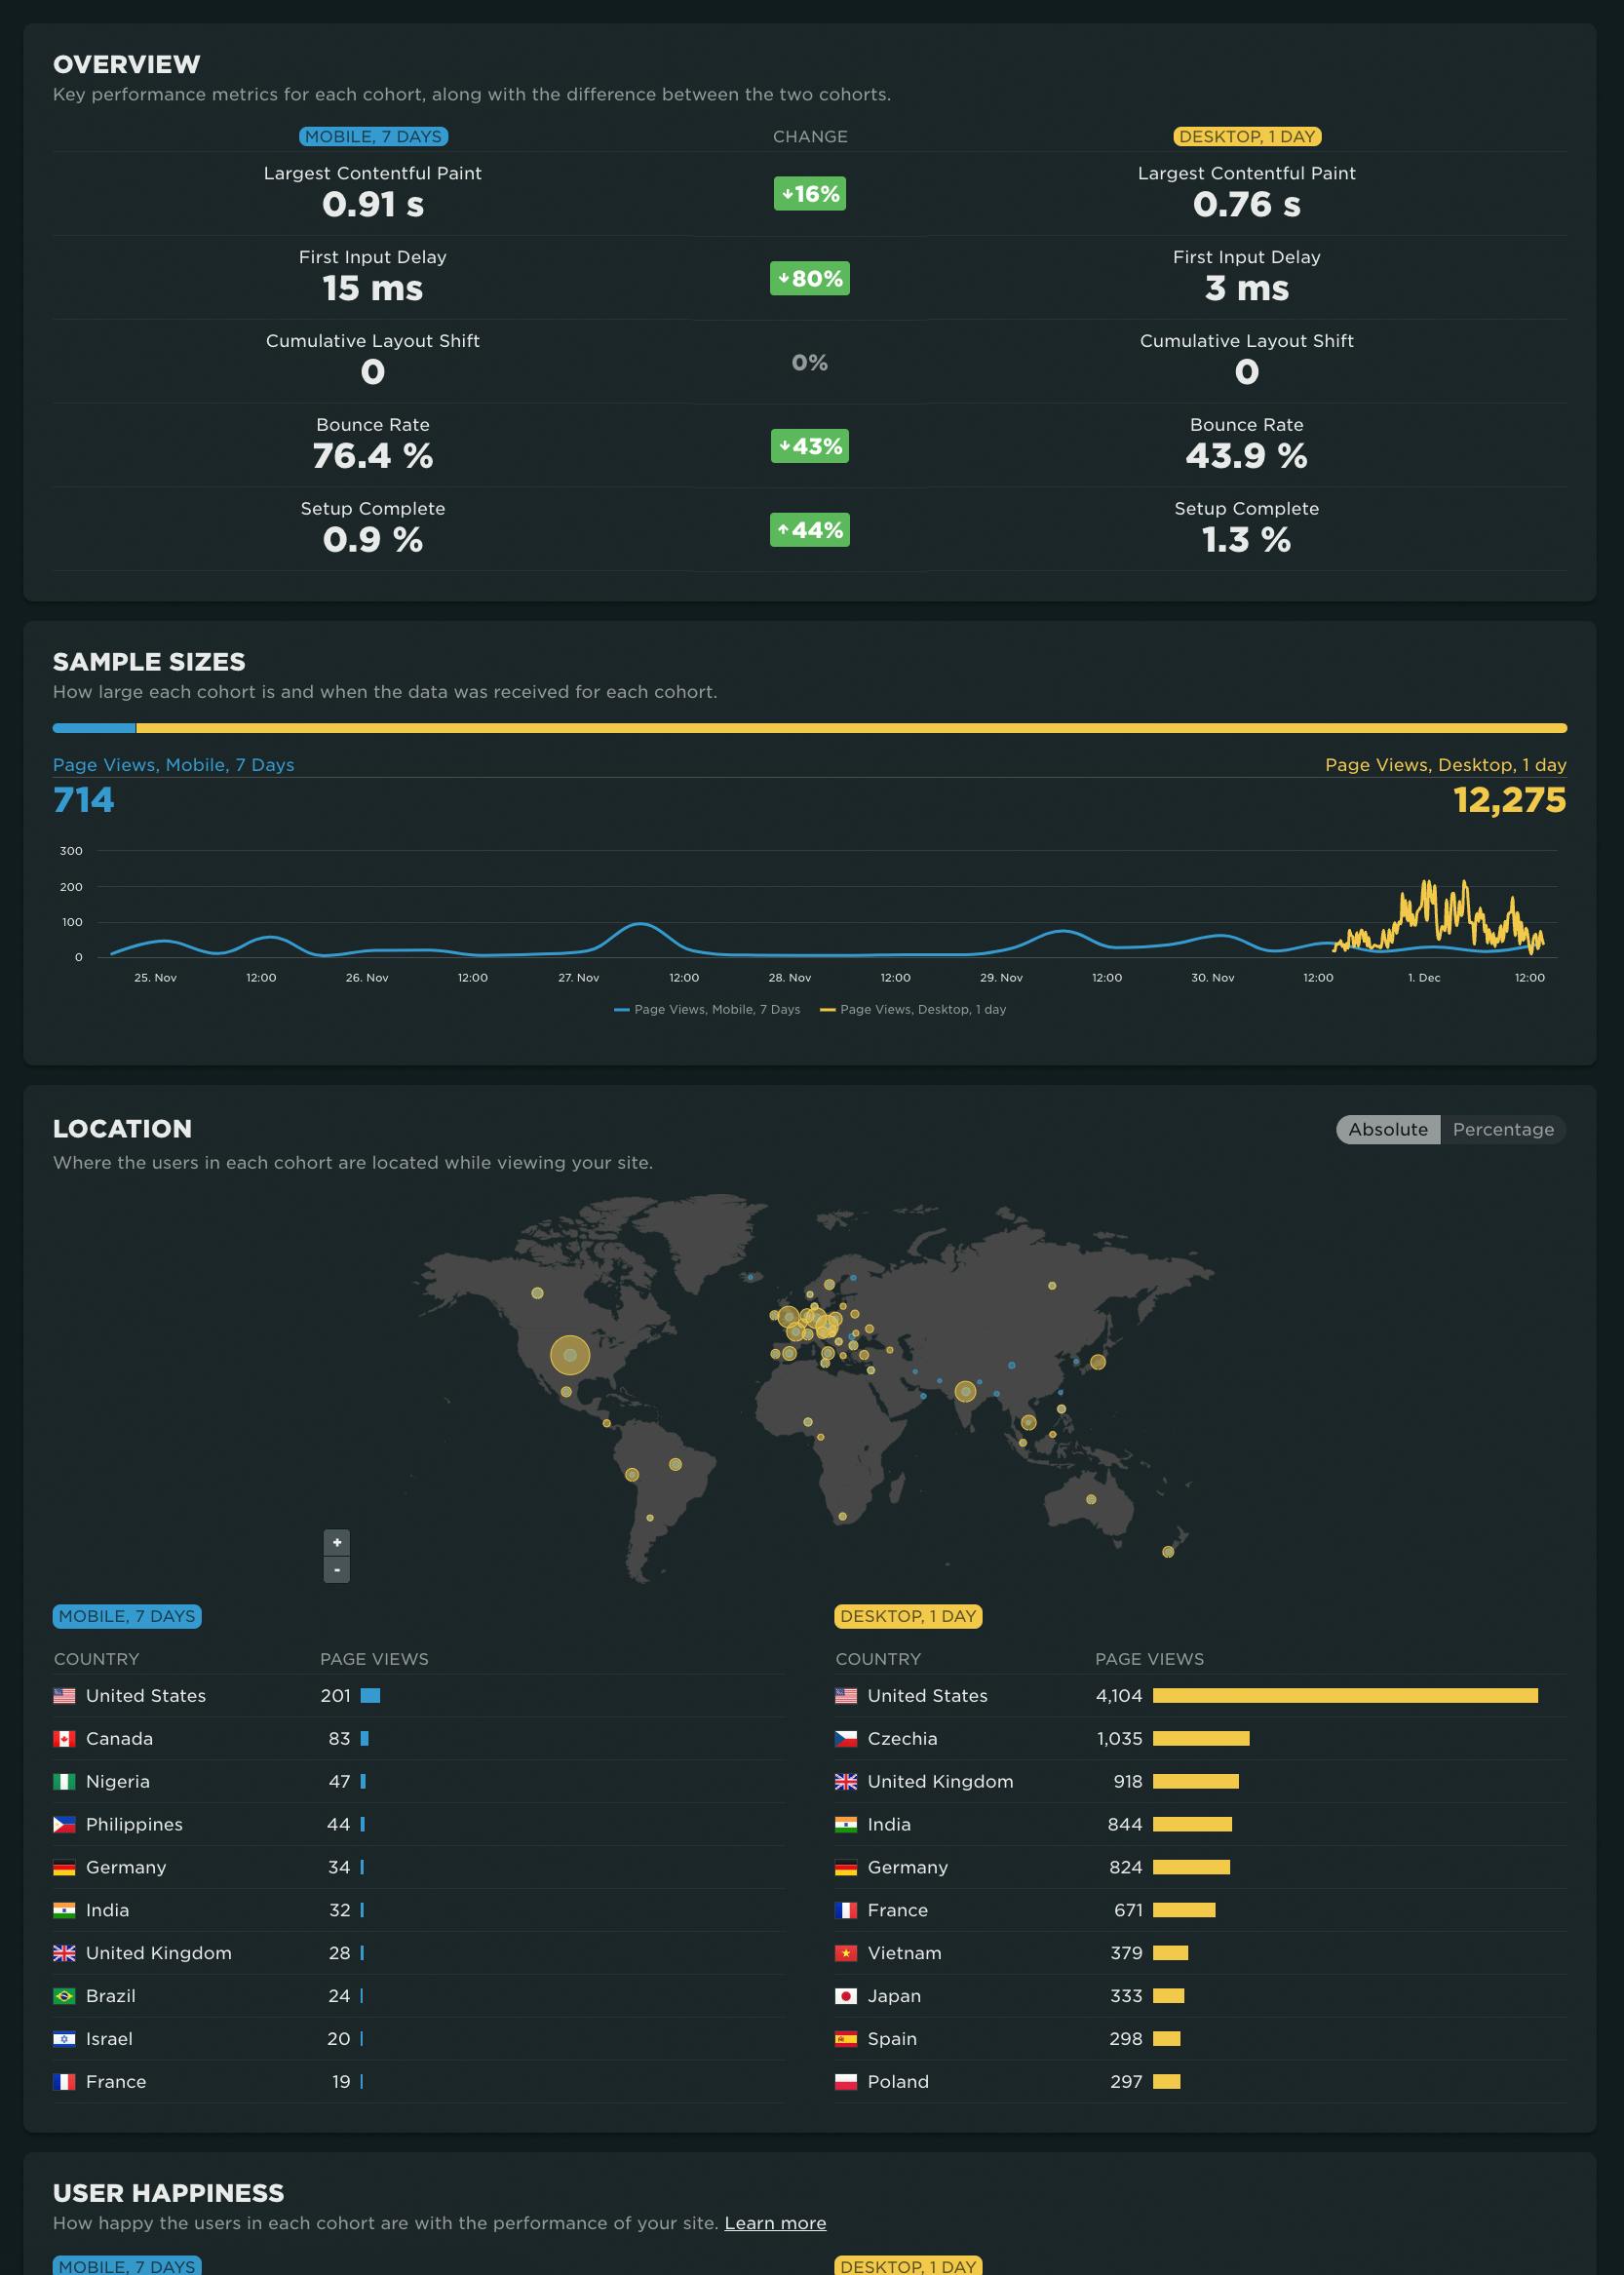
With your RUM Compare dashboard, you can easily generate side-by-side comparisons for any two cohorts of data. Some of the many reasons you might want to do this include:
- Improve Core Web Vitals by identifying the tradeoffs between pages that have different layout and construction
- Triage a performance regression related to the latest change or deployment to your site by looking at a before/after comparison
- Explore and compare different out-of-the-box cohorts, such as device types, geographies, page labels, and more
- Analyze A/B tests or experiments to understand which had the most impact on user behavior, as well as performance
- Optimize your funnel by understanding differences between users that convert or bounce from your site and users who don't
- Evaluate CDN performance by exploring the impact of time-of-day traffic patterns
Let's take a tour...
Sampling RUM: A closer look
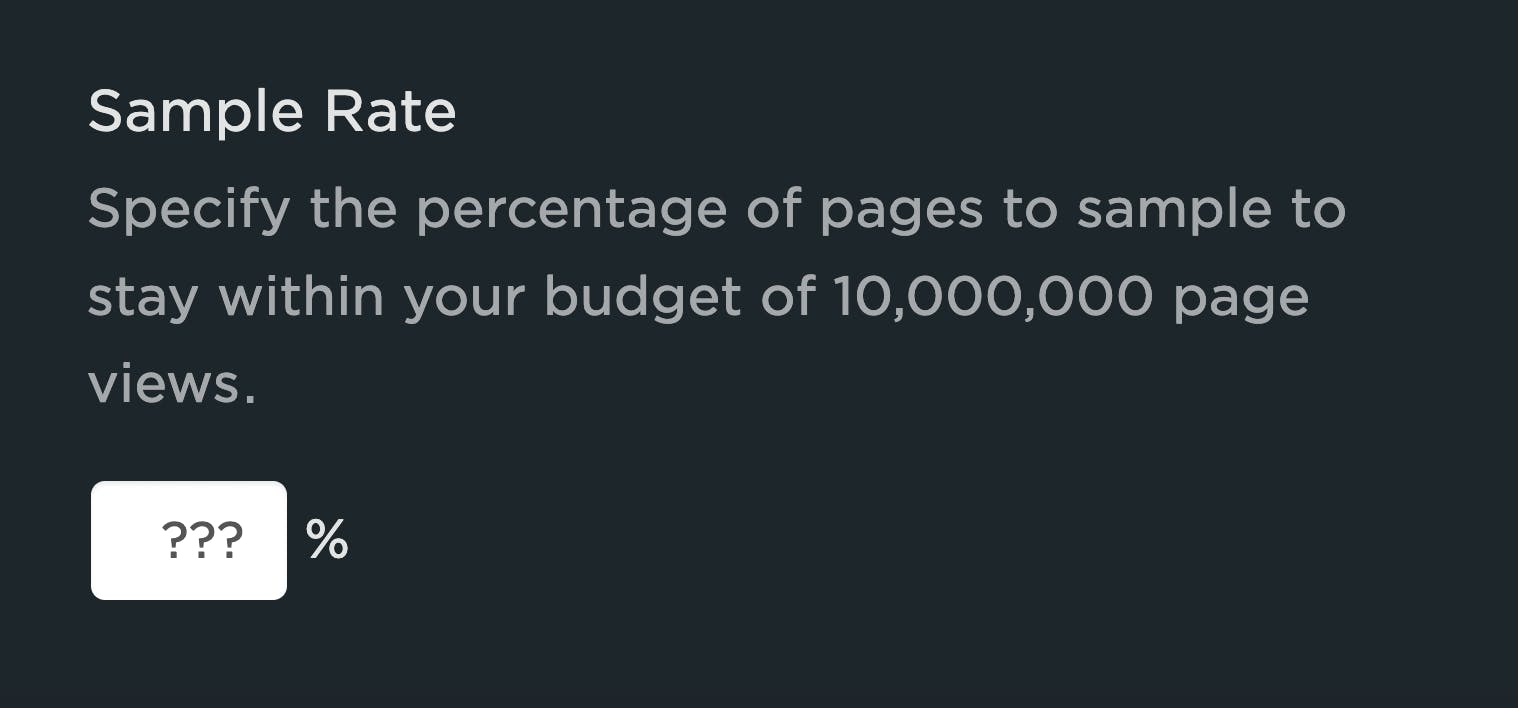
Being able to set a sample rate in your real user monitoring (RUM) tool allows you to monitor your pages while managing your spending. It's a great option if staying within a budget is important to you. With the ability to sample real user data, comes this question...
"What should my RUM sample rate be?"
This frequently asked question doesn't have a simple answer. Refining your sample rate can be hit or miss if you aren’t careful. In a previous post, I discussed a few considerations when determining how much RUM data you really need to make informed decisions. If you sample too much, you may be collecting a lot of data you may never use. On the other hand, if you sample too little, you risk creating variability in your data that is hard to trust.
In this post, we are going to do a bit of research and let the data speak for itself. I took a look at the impact of sampling at various levels for three t-shirt sized companies (Small, Medium, Large) with the hope of providing some guidance for those of you considering sampling your RUM data.
In this post, I'll cover:
- Methodology
- Key findings
- Considerations
- Recommendations
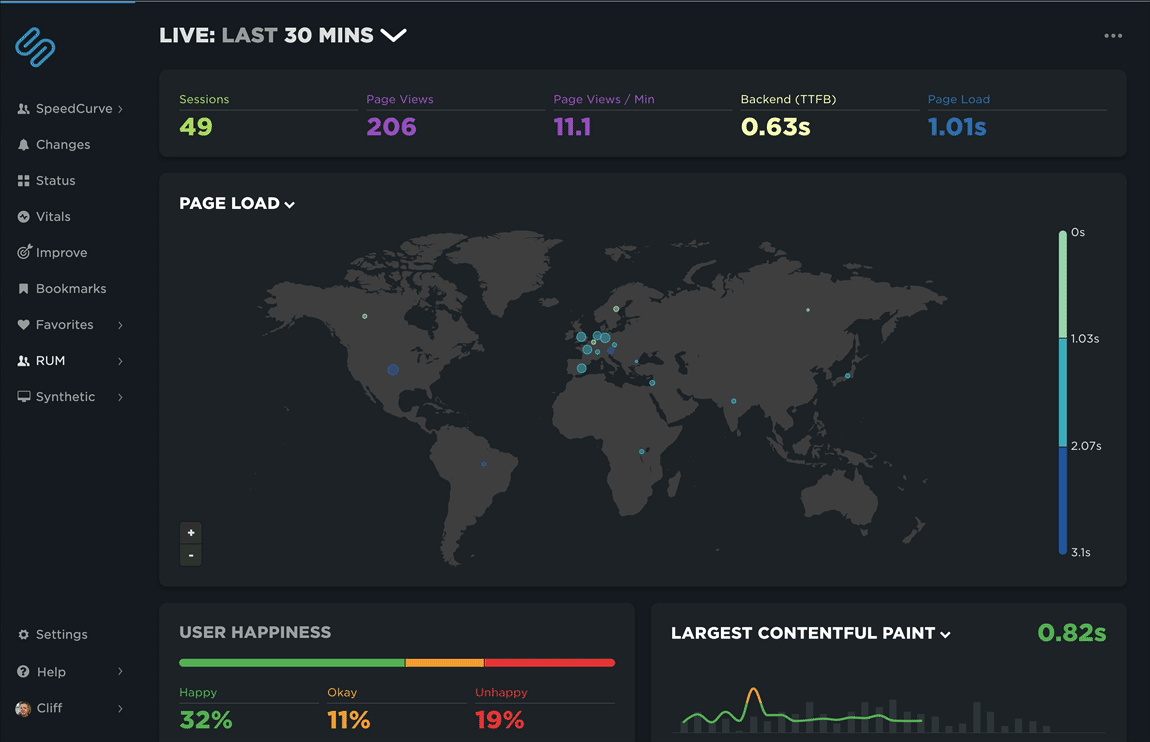
NEW: RUM Live and Page Views dashboards
Shortly before the end of the year, we snuck in a couple of last-minute gifts for 2021. It was a great year for SpeedCurve with a lot of renewed focus on RUM. We couldn't think of a better way to finish out the year than to launch the new Live and Page Views dashboards. Let's take a look!
Sampling RUM: When and why it's a good idea

I confess, I’m not a statistician. While I pride myself on the 'A' I received in my college statistics class, admittedly it was on a pretty steep curve. That said, I’ve been looking at performance data for many years and have found myself on both sides of the debate about whether or not the practice of sampling performance data is inherently a good or bad idea.
When it comes to real user monitoring (RUM), I’m convinced that the marginal cost of collection, computation, storage, etc. is not always great enough to warrant a practice of collecting ALL THE THINGS by default.
Like any experiment, how you sample RUM data – as well as how much data to sample – depends on the answers you seek. While certainly not an exhaustive list, here are some questions you might ask when looking at implementing a sampled approach to real user monitoring...
How SpeedCurve fits into your web performance toolkit

Over the last few years the web performance monitoring toolset has expanded dramatically with the introduction of many new services and products. There are two main types of web performance monitoring, uptime monitoring and real user monitoring. SpeedCurve focuses on a third which I like to call web performance benchmarking.
