Demystifying Cumulative Layout Shift with CLS Windows

As we all know, naming things is hard.
Google's Core Web Vitals are an attempt to help folks new to web performance focus on three key metrics. Not all of these metrics are easy to understand based on their names alone:
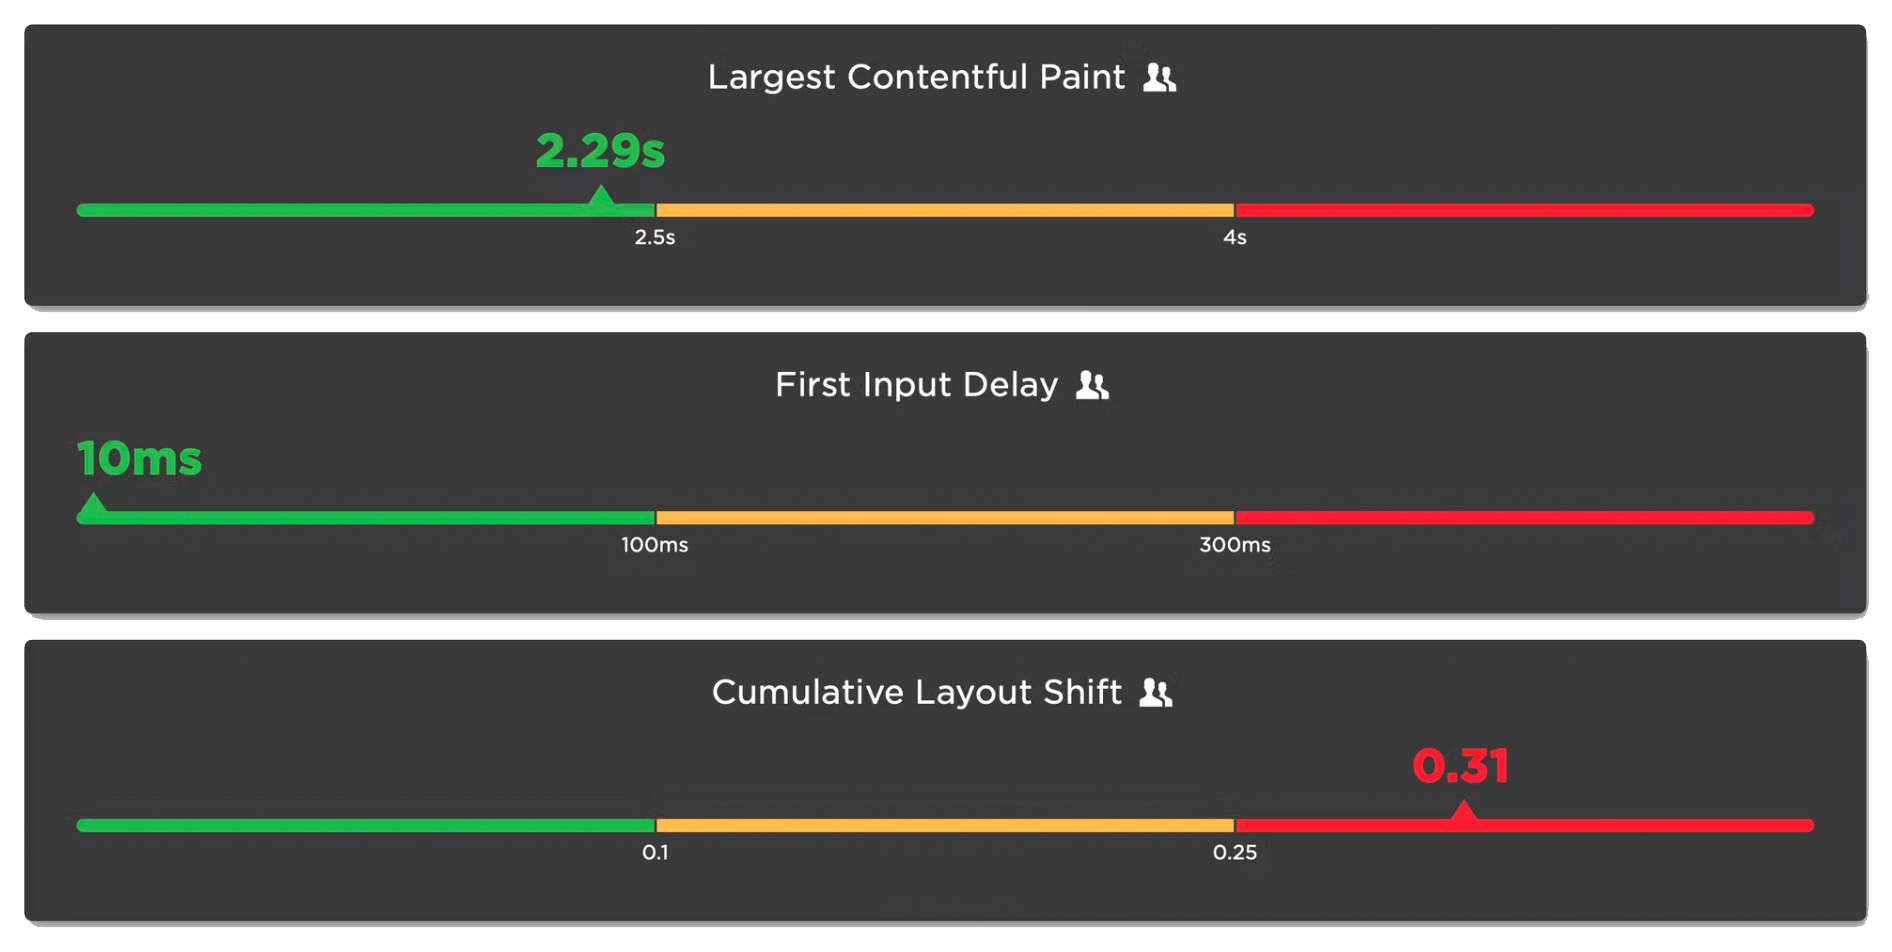
- Largest Contentful Paint (LCP) – When the largest visual element on the page renders
- First Input Delay (FID) – How quickly a page responds to a user interaction (FID will be replaced by Interaction to Next Paint in March 2024)
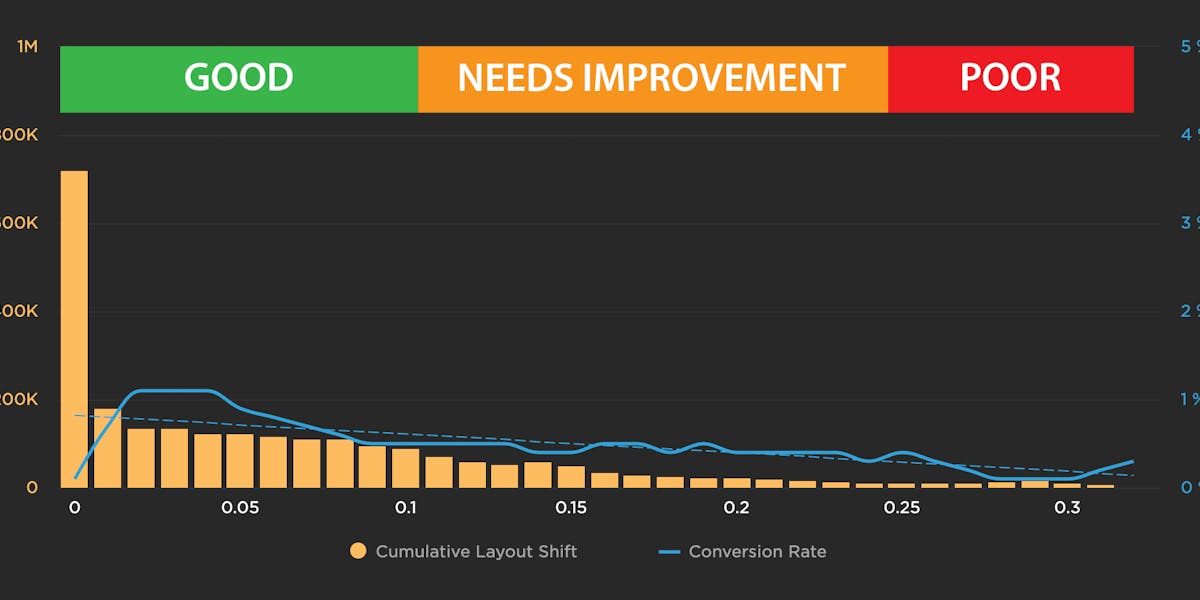
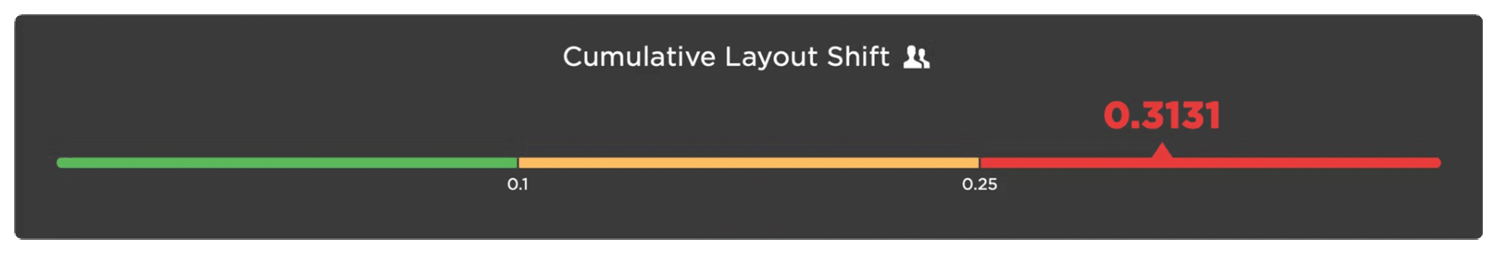
- Cumulative Layout Shift (CLS) – How visually stable a page is
Any time a new metric is introduced, it puts the burden on the rest of us to first unpack all the acronyms, and then explore and digest what concepts the words might refer to. This gets even trickier if the acronym stays the same, but the logic and algorithm behind the acronym changes.
In this post, we will dive deeper into Cumulative Layout Shift (CLS) and how it has quietly evolved over the years. Because CLS has been around for a while, you may already have some idea of what it represents. Before we go any further, I have a simple question for you:
How do you think Cumulative Layout Shift is measured?
Hold your answer in your head as we explore the depths of CLS. I'm interested if your assumptions were correct, and there's a poll at the bottom of this post I'd love you to answer.
Old-school CLS
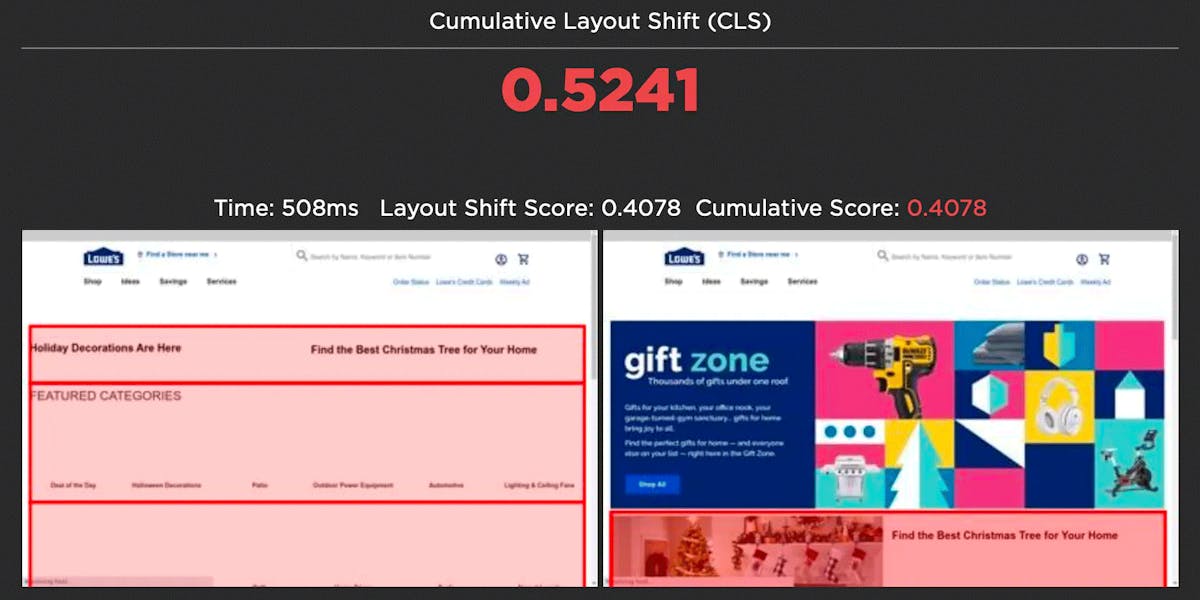
In May 2020, Google introduced CLS as part of Core Web Vitals. To help improve user experience, CLS tracked any elements that moved around on the page as it renders. You know... that annoying moment when the ad pops in late in the page render and pushes the content you were already reading further down the page. That yucky moment is called a layout shift.
With the original version of CLS, all those layout shifts went through some funky maths, which compared the size of the layout shift to the size of the viewport and how far the element moved, and then converted it into a numeric score. The scores of all the individual layout shifts were then added together to give you the cumulative layout shift.
I've always found it odd that Google left the representation of CLS as a decimal score. I'm a simpleton and find parsing all those decimals takes extra mental effort. It feels more complicated than it needs to be. Since it's an unintuitive metric anyway and takes effort to understand, why not just turn it into a score out of 100? That's why people love the Lighthouse scores so much.
The problem
After the launch of CLS, a major issue quickly surfaced. Old-school CLS measured all the layout shifts over the entire lifespan of the page. This collided head-on with developers moving to Single Page Apps (SPAs). Since a SPA is by definition a full app shoved inside a single page, the CLS for a SPA would continue to grow for the lifetime of the app/page. This led to massive CLS scores for SPAs and a rethink of how CLS should be measured.
Introducing CLS windows
In 2021, Google relaunched CLS with a session window. The idea was to measure a burst of layout shifts within a 5s session window. A new session starts if there is a gap of more than 1s between layout shifts. At the end of the page lifespan, the session window with the highest total layout shifts becomes CLS.
Example of CLS sessions windows from web.dev
By introducing a session window, Google reduced the impact of the SPA problem. The CLS for any long-lived page was now limited to a 5s window containing the largest layout shifts.
(Measuring the performance of SPAs is still an ongoing problem for Core Web Vitals, however, and there's more work being done on measuring metrics relative to the soft navigations of a SPA.)
Same name, different algorithm... yikes
This was a major change to CLS that I think a lot of people missed. Google did a great job of consulting the web performance community on the change, and those changes were well thought out and welcomed. But by keeping the naming of CLS the same, many people we speak to still fundamentally misunderstand what CLS represents. As it still says on the tin, many people still believe that CLS is the accumulation of all the layout shifts on a page. That's what it used to be, but it's not anymore. Maybe Google should have renamed CLS to indicate how different it is now. I don't think anyone could face a four letter acronym. CLSW? WCLS?
To help people get their heads around CLS windows, we've introduced a new visualization to SpeedCurve that shows you each session window, as well as which session is the largest and therefore used as the CLS score.
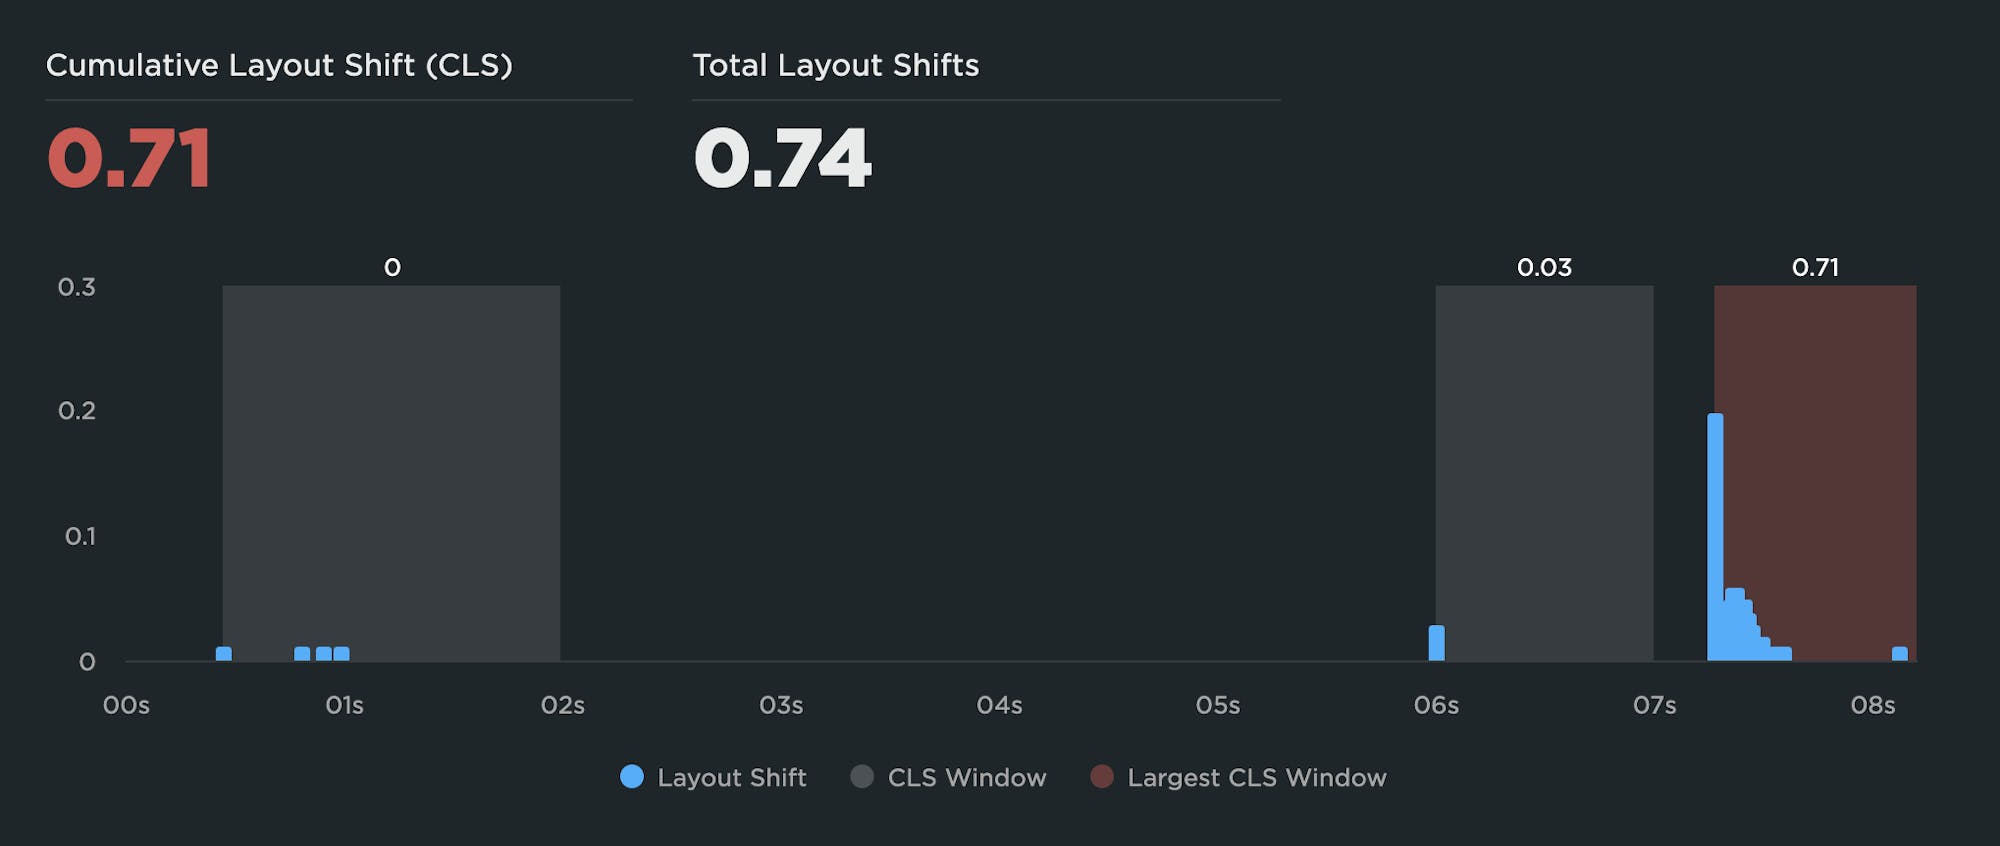
A synthetic test showing three session windows with the largest window of 0.71 used as the CLS score.
Any layout shift is a bad shift
Your pages should really be fully rendered in under 5s, but if you have slow loading pages and dodgy third parties that take longer than 5s to stop jiggling your elements about, then there's a chance your CLS score doesn't accurately let you know just how bad your page is. Only the worst layout shifts within the 5s session window will contribute to CLS.
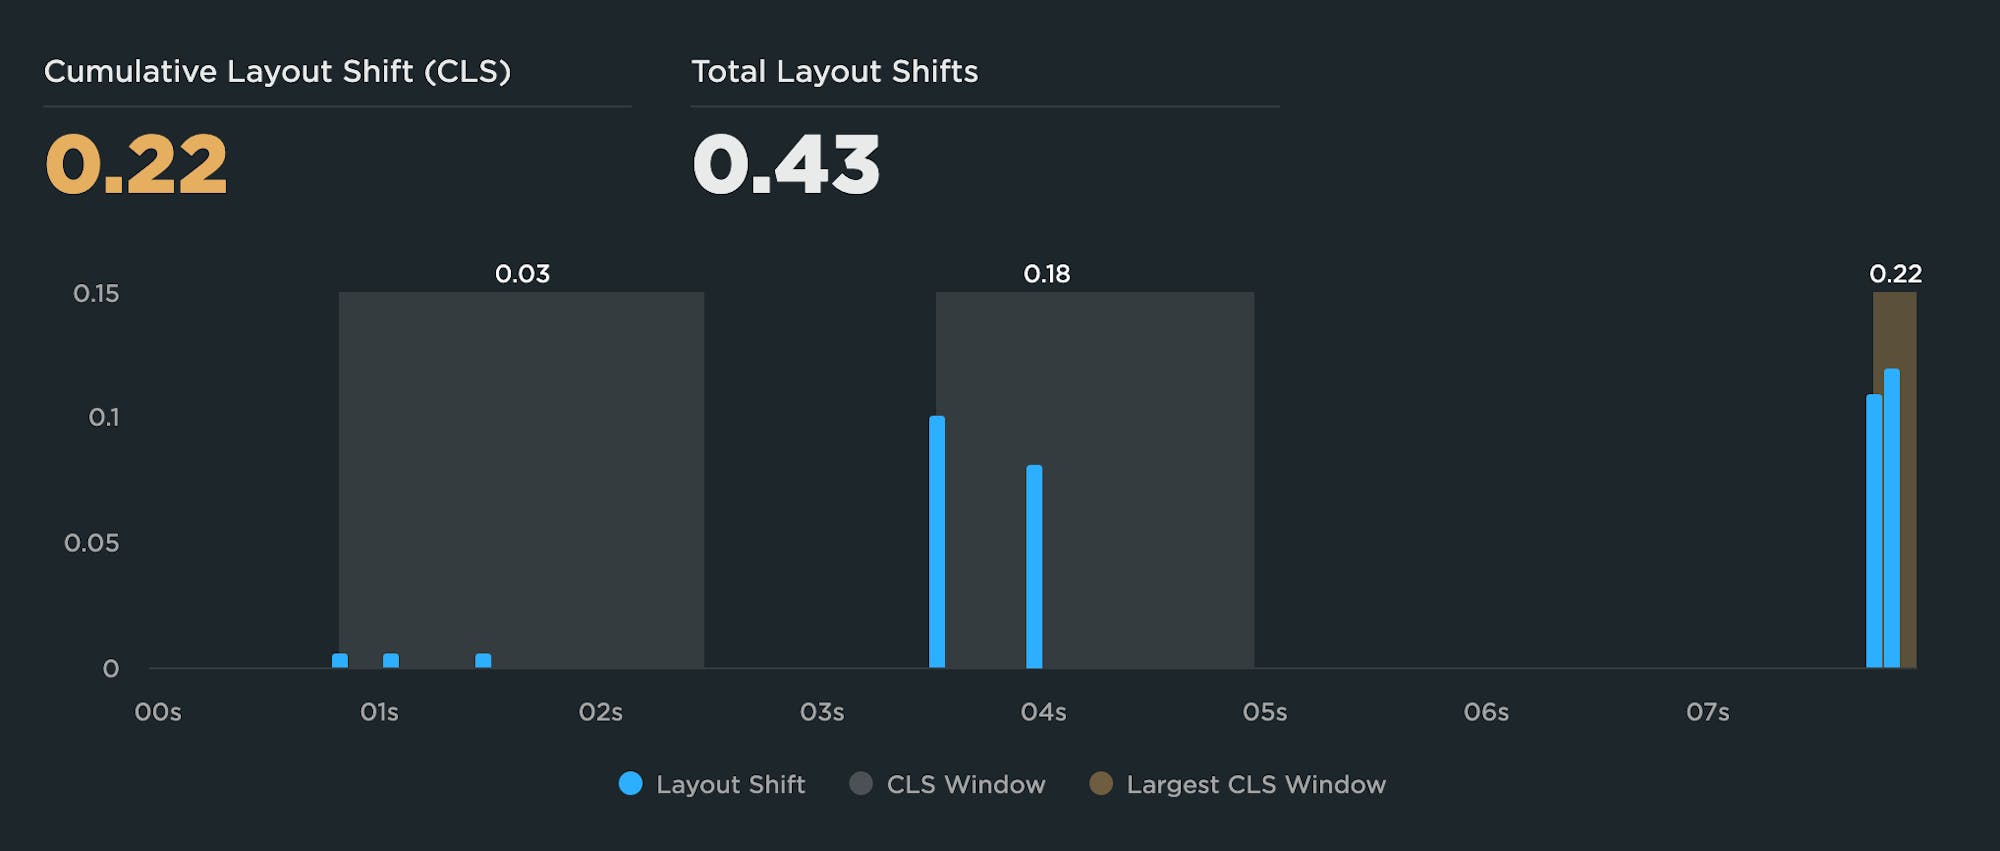
In the example above, there are large shifts in the second session window, but these are not included in the final CLS score because the total of the layout shifts in the third session window is larger. This masks the fact that overall this page has a total layout shift score nearly twice as bad as what is reported by CLS, and the user suffered through many large layout shifts as the page rendered.
All metrics need validation before you rely on them
The scenario described above is something to watch out for and a good reminder that you have to validate what a metric represents on your pages. In the same way that you need to check that the element selected for Largest Contentful Paint is an element you actually care about, you should also check that windowed CLS is not hiding any large layout shift(s) from you.
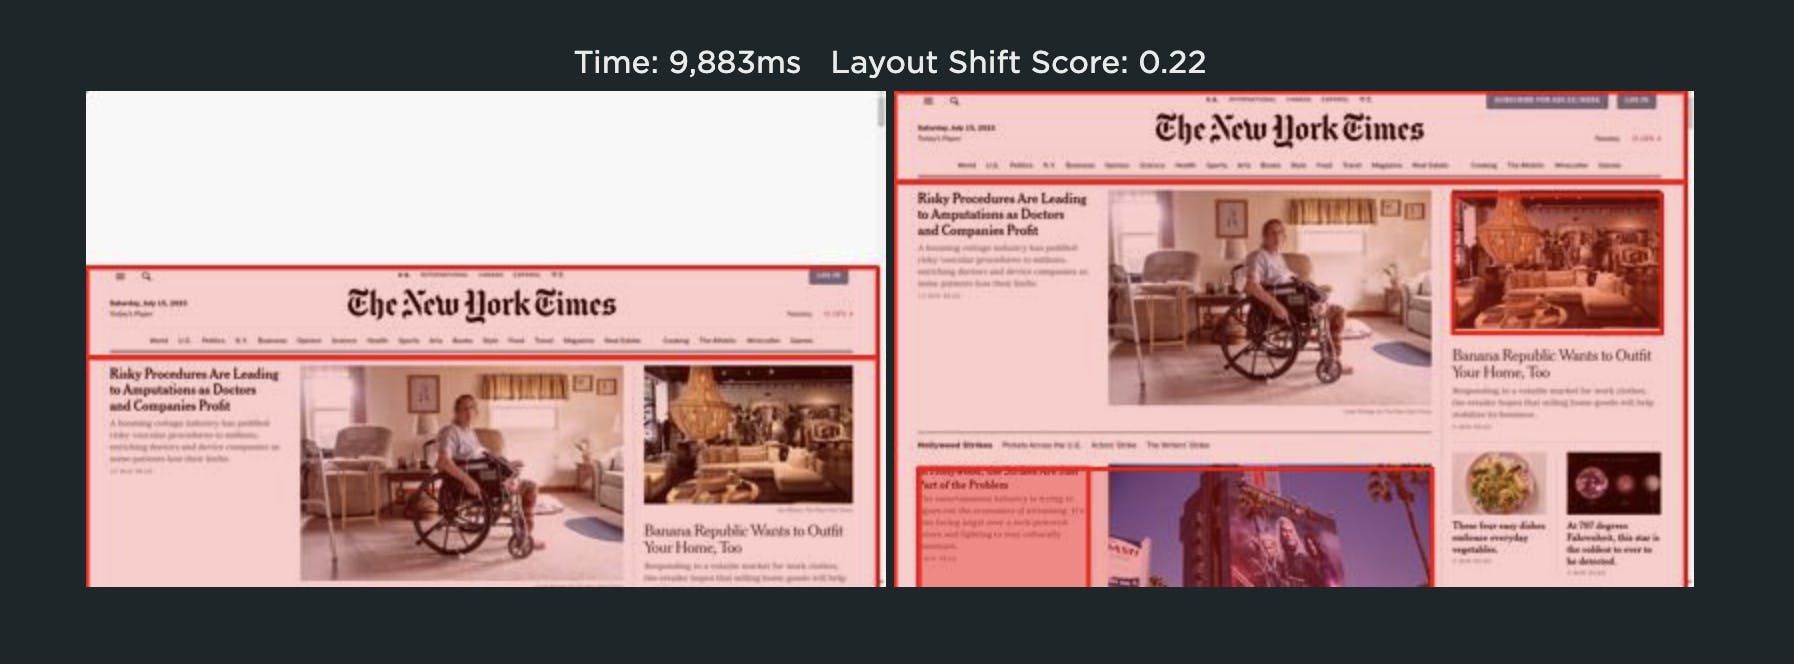
From a user's perspective, any large layout shift is a bad shift. So on our Test dashboard, we continue to show you all the layout shifts that happened as the page rendered and which specific elements moved. You really do need to get rid of all of them for your page to feel as stable and solid as possible as it renders.
Focus on improving your user experience first and making your pages feel rock solid as they render. That will naturally lead to a lower CLS score and improved ranking on Google.
Don't forget: Core Web Vitals are just a means to an end
Core Web Vitals are meant to help you measure and improve user experience. You can either try and improve your Core Web Vitals metrics, or just work on improving your user experience and the metrics will follow. At SpeedCurve, we're here to help you craft a fast and joyful user experience. Metrics are just a means to that end goal.
Learn more:
Super-quick poll
Before you depart, I'd love to know if the windowed CLS changes were already something you understood, or if you thought all layout shifts were still included in the Cumulative Layout Shift score.