NEW! Lighthouse 10, Core Web Vitals updates, and Interaction to Next Paint

There is a lot of excitement in the world of web performance these days, and April has been no exception! At SpeedCurve, we've been focused on staying on top of the items that affect you the most.
Here is a look at what's new in SpeedCurve:
- Support for Lighthouse 10, including metric scoring changes as well as audits
- Updated RUM Core Web Vitals, including the much-anticipated addition of Interaction to Next Paint (INP)
All of this work driven by the community is having a big impact in our collective goal to make performance accessible for everyone.
Read on to learn more about these exciting changes!
What changed in Lighthouse 10?
Here's how the update to Lighthouse 10 may affect your metrics.
Scoring
Lighthouse scoring has been updated for the first time since version 8. Metrics and scoring weights include the deprecation of Time to Interactive (TTI) and the increase in weight for Cumulative Layout Shift (CLS).
Weighting adjustments are highlighted in bold below:
- First Contentful Paint (FCP): 15
- Speed Index: 10
- Largest Contentful Paint (LCP): 25
- Time To Interactive (TTI): 15
- Total Blocking Time (TBT): 30
- Cumulative Layout Shift (CLS): 15 -> 25
What impact will this have on my score?
According to Google:
“We expect this to improve most pages' performance scores, since most pages tend to score better on CLS than TTI. In an analysis of 13 million page loads in the latest HTTP Archive run, 90% of those pages would see an improvement in their Lighthouse performance score, with 50% of them seeing a performance improvement of more than 5 points.“
According to us:
"It depends."
Basically, we see a trend similar to the trend observed by Google. Overall, sites saw some improvement in their Lighthouse scores. However, sites that have not-so-great CLS scores might see their Lighthouse Performance score degrade.

If you are delivering a consistent experience AND already have super CLS, you're probably going to see an improvement in your Lighthouse score. It also helps that, in this case, a poor TTI is now being omitted from Lighthouse scoring.

Audits
SpeedCurve leverages the performance audits from Lighthouse throughout your dashboards. With the release of Lighthouse 10, one new performance audit was added and another best practices audit was modified:
- Page prevented back/forward (BF) cache navigation – When a site is able to leverage BF cache navigations, users can see a huge benefit and a perceived 'instant' loading of the page. When a BF cache navigation is prevented, Lighthouse lists the causes for the failure.
(Important: Changes to performance for BF cache navigations will likely not show up in your synthetic monitoring tests – with the exception of repeat views, which may see an improvement. However, your RUM data should reflect these improvements. Look for an update to in a future release that will allow closer inspection of BF cache navigations)
- Allows users to paste into input fields – This best practices audit has been updated for Lighthouse 10. Previously, the audit checked for password inputs only. Now the audit includes all input fields that are not read-only.
Core Web Vitals updates
Cumulative Layout Shift (CLS)
There was an update to CLS a while ago that didn't quite make sense for us to adopt until now. We've updated our RUM library to include the latest CLS implementation, which includes session windows. This may have a positive impact on CLS scores, especially for longer lived pages. We've updated this for synthetic too!
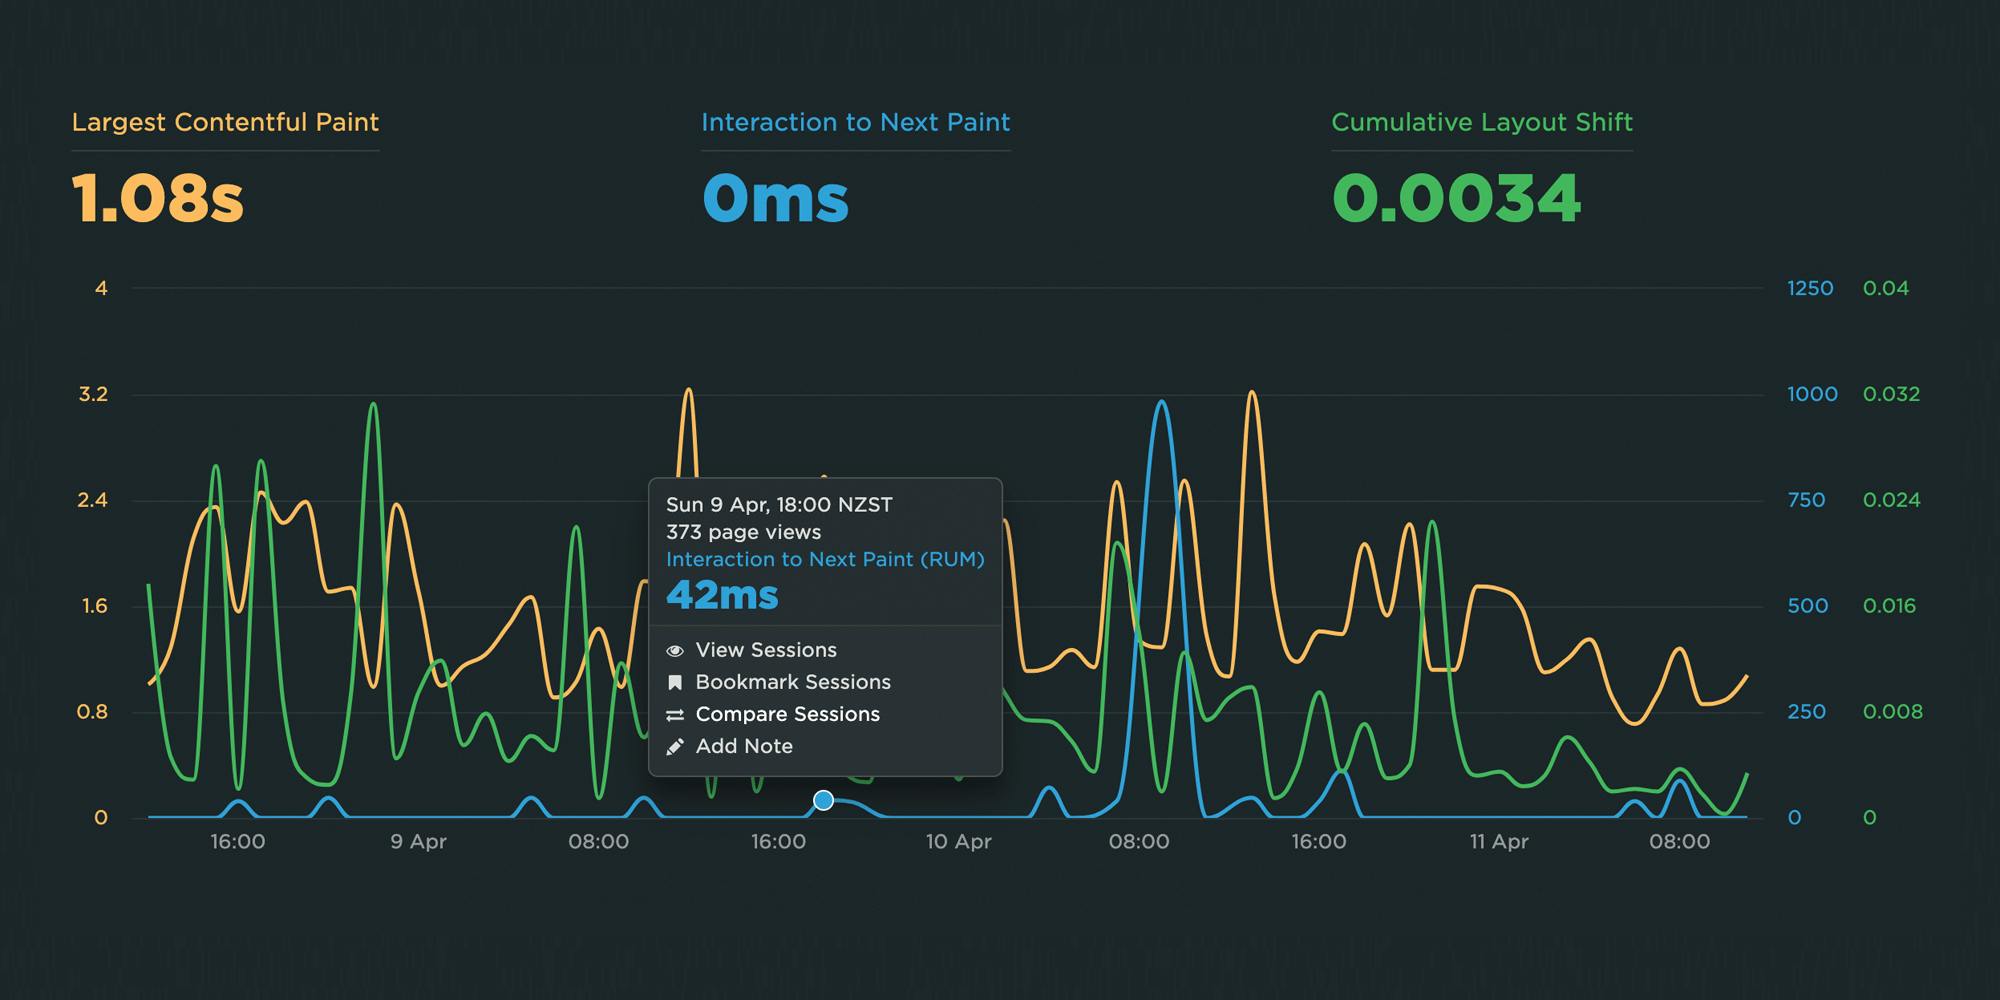
Interaction to Next Paint (INP)
There has been a lot of buzz about this potential replacement for First Input Delay (FID). Our fingers are crossed that we will say good riddance to FID and that this metric will do a better job of identifying responsiveness issues for applications. Look for an upcoming INP explainer and analysis after we've had a chance to observe it in the wild for a bit.
For now, you can track INP in your Favorites dashboards, but it has yet to be added to the Vitals dashboard or other RUM dashboards due to its experimental status. We quietly added INP on March 20, so if you start tracking it in your Favorites, you should already have a few weeks worth of data to explore.
The recommended thresholds at the 75th percentile are as follows:
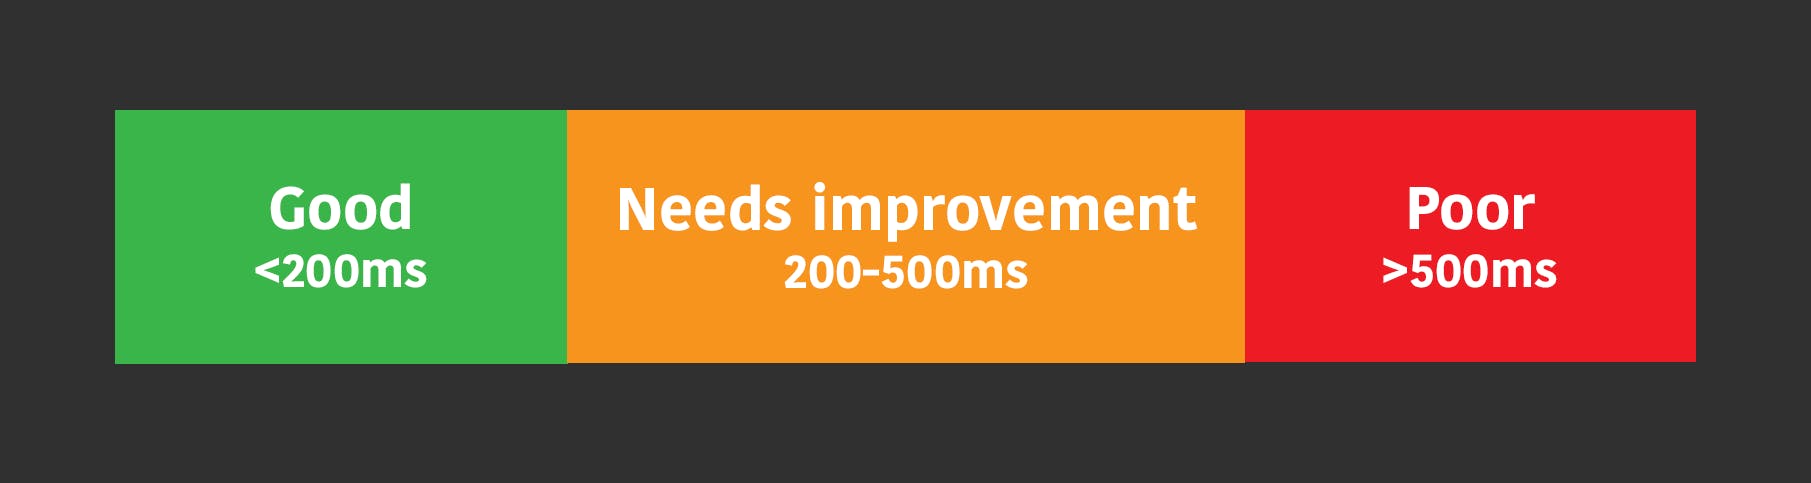
Good: < 200ms
Needs Improvement: 200ms - 500ms
Poor: > 500ms
So far, we are seeing that on average most sites are around or above the 200ms threshold. It's important to note that the recommended thresholds may still be adjusted, as this is still an experimental metric.
Interested in tracking INP for your site? Here is a quick explainer video that shows you how to add INP to your custom Favorites dashboard.
Here are some useful links where you can learn more!