June 2022 product update: Performance recommendations on Vitals dashboard, RUM path filters & more


We've been busy here at SpeedCurve HQ! Here's a roundup of our recent product updates.
Performance recommendations on your Vitals dashboard
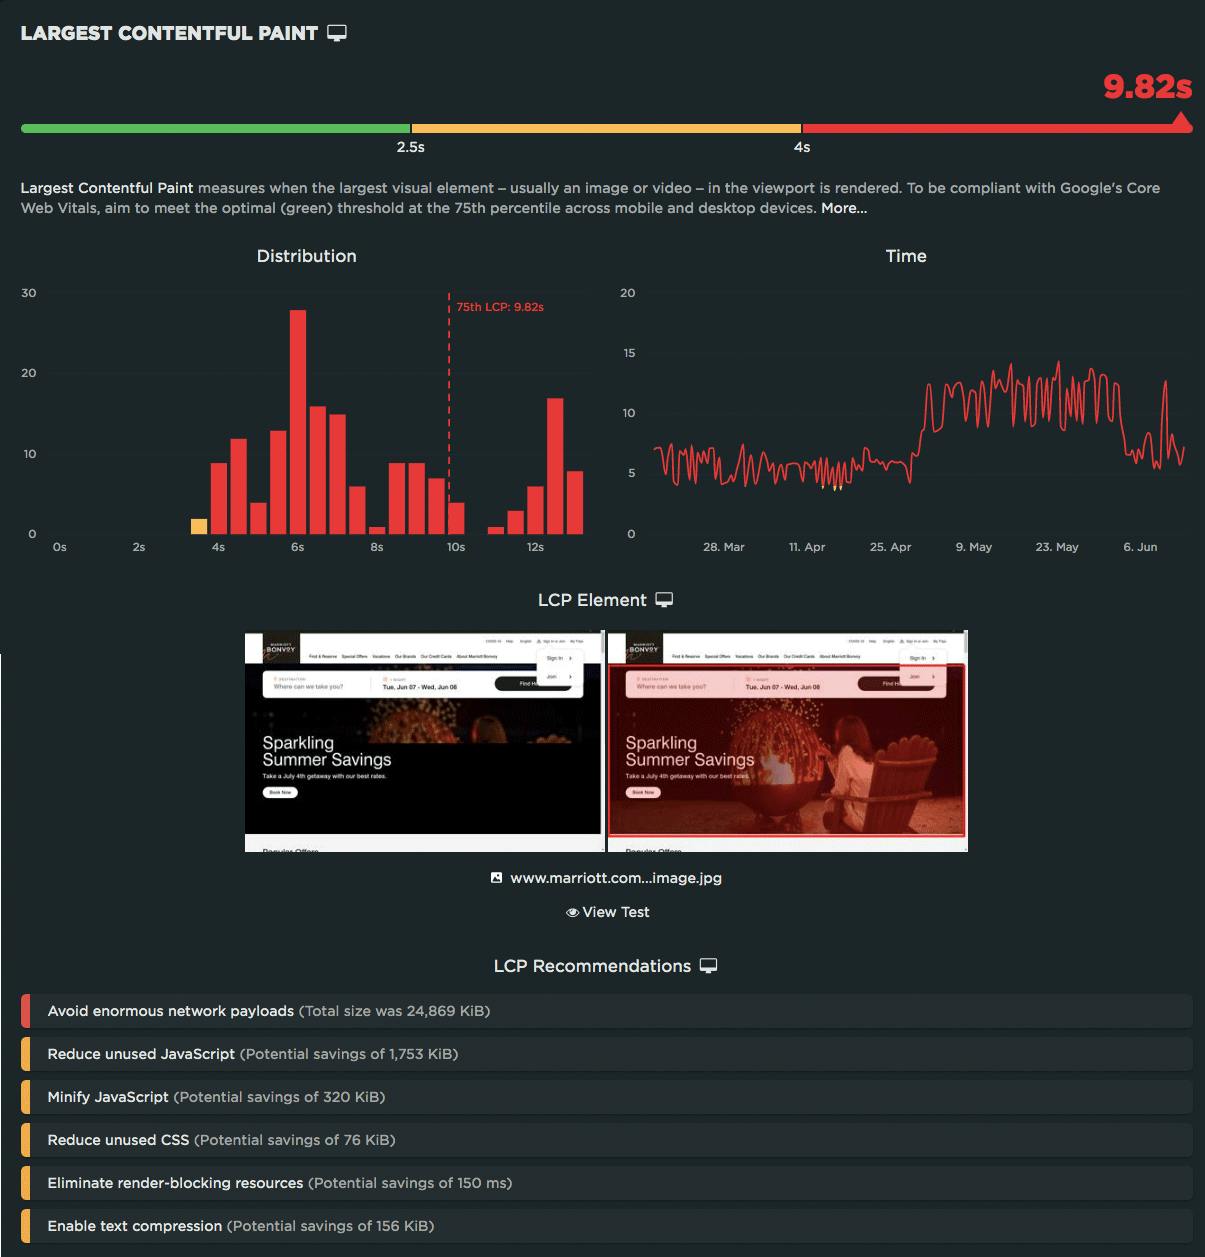
On your Vitals dashboard, you now get performance recommendations that are specific to each of the Vitals you're tracking – Largest Contentful Paint, First Input Delay, Total Blocking Time, and Cumulative Layout Shift. This makes your Vitals dashboard a powerful tool for not only seeing how your metrics perform relative to Google's thresholds, but also diagnose your biggest pain points and get prioritized solutions.
Vitals badges on Lighthouse performance audits
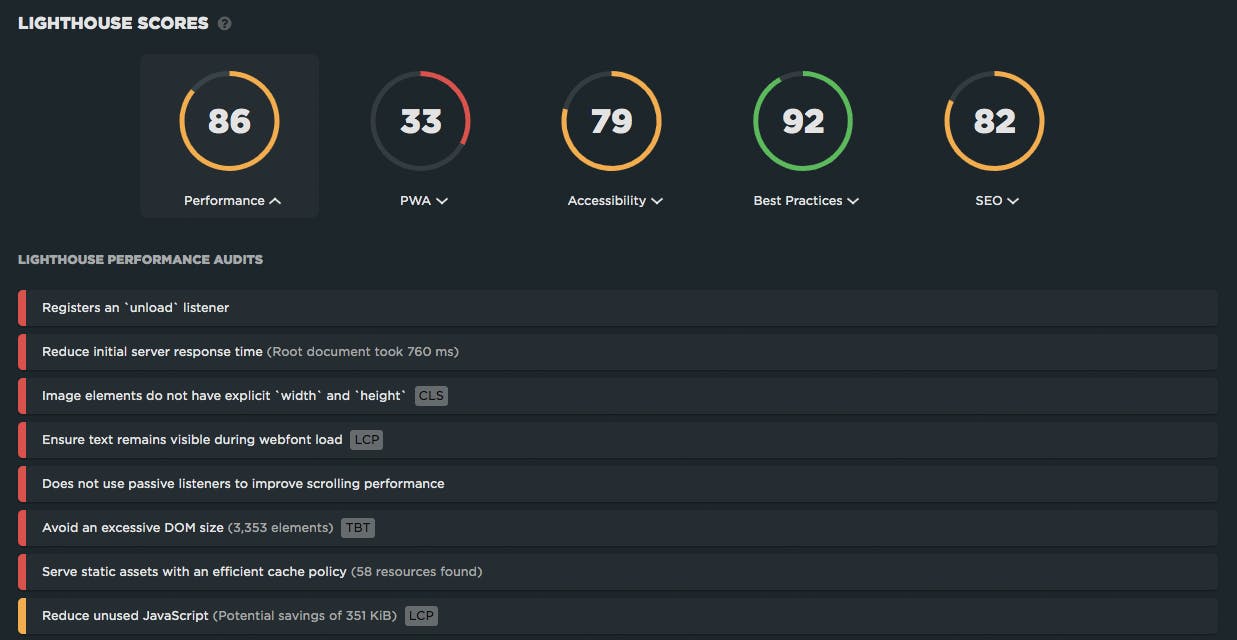
Elsewhere in SpeedCurve, all the performance recommendations you see in your Vitals and Improve dashboards – as well as in your synthetic test details – are now badged so you can see which Web Vitals they affect. Fix those issues and you should see improvements in your Vitals and Lighthouse scores.
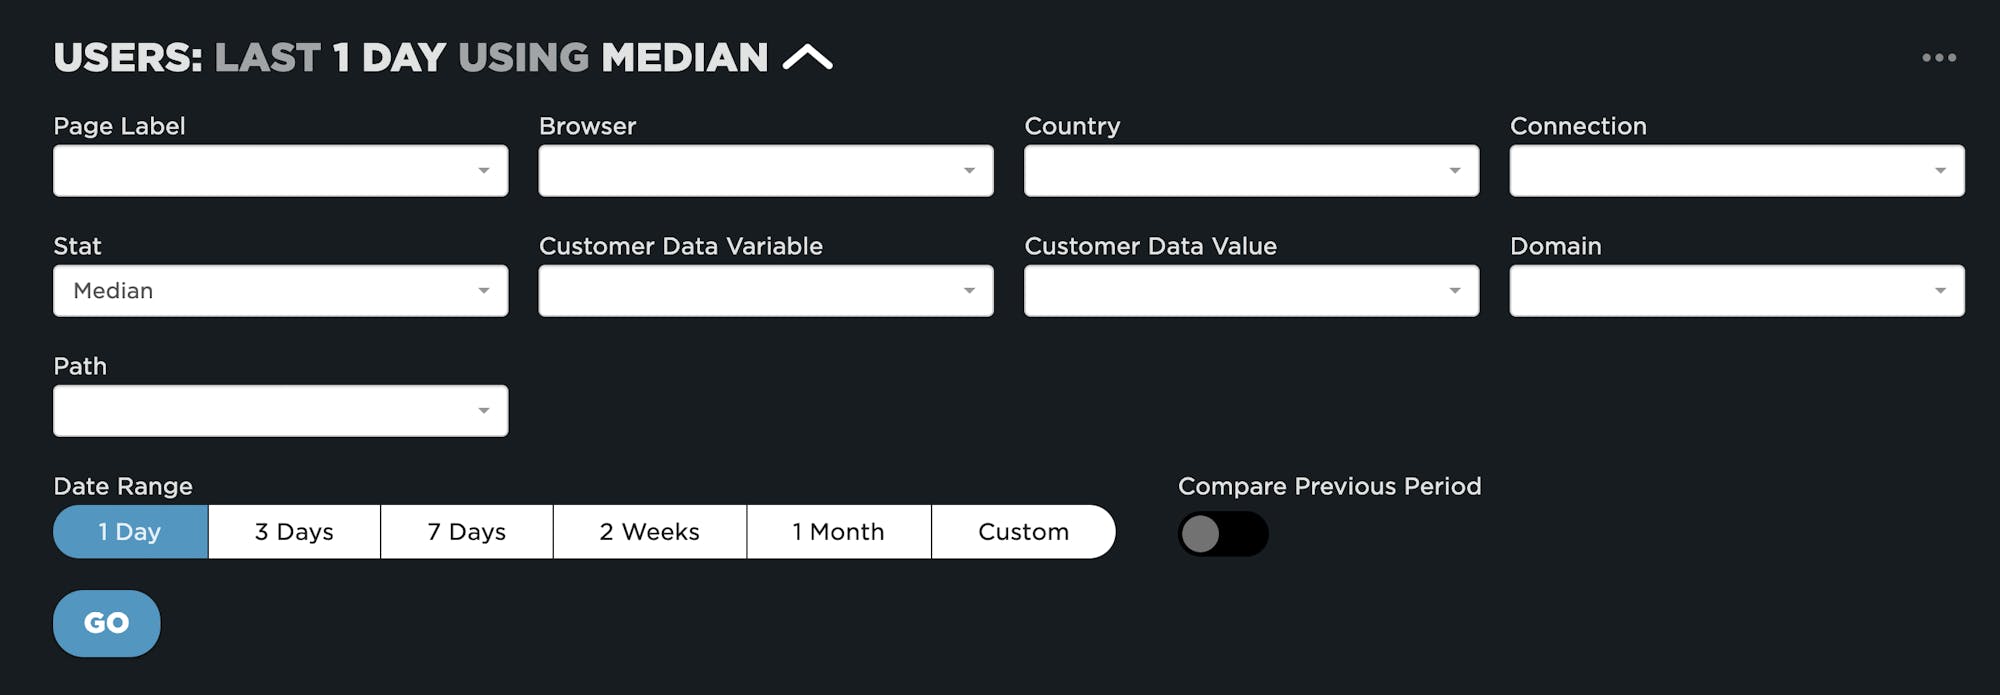
RUM update: Path filters
RUM update: lux.js v301
New features:
- The synthetic onload time for SPAs can be marked with
LUX.markLoadTime(), allowingLUX.send()to be called later in the page lifecycle. - Added the SpeedCurve RUM Debug Parser to help interpret the debug messages.
LUX.getDebug()now includes events that help to debug some metrics including LCP, CLS, element timing, and long tasks.- Source maps are now available for lux.js.
Bug fixes:
- Fixed a bug where JavaScript errors were only tracked on the first SPA page view.
Synthetic update: Compare third parties
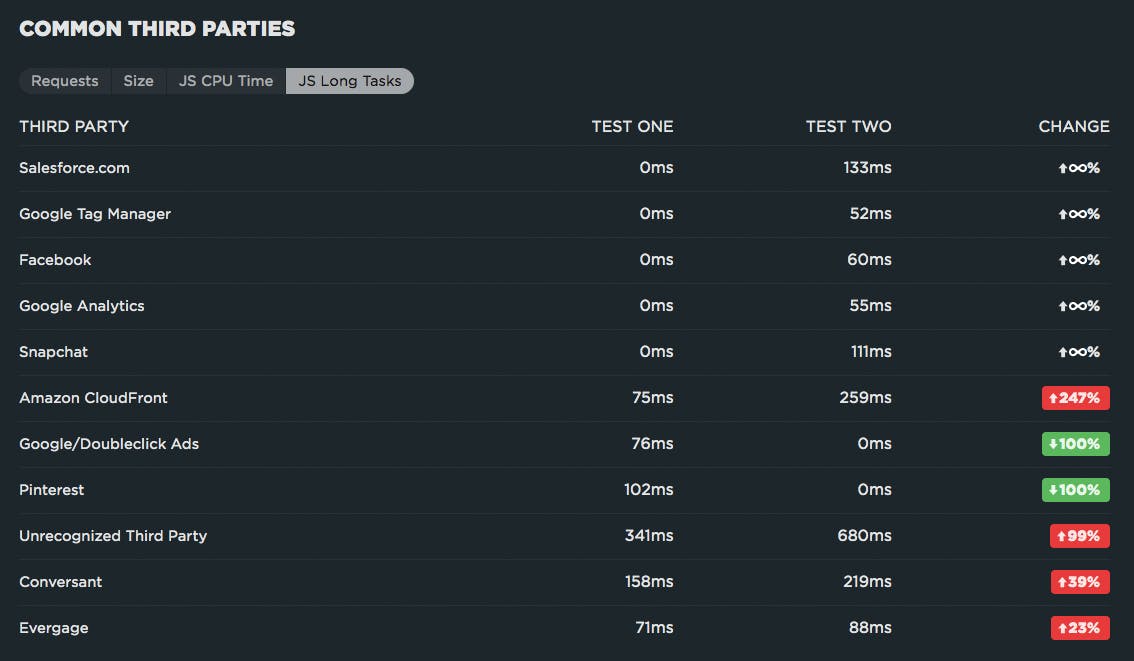
When comparing two tests, we now give you a comparison of common third parties. We also identify which third parties are unique to each test. Using this feature, you can quickly identify new and problematic third parties. This short video explains how to diagnose third-party regressions in SpeedCurve.
New in the Support Hub
- Get started with Core Web Vitals
- SEO and web performance
- Custom metrics for anti-flicker snippets
- Understand Cumulative Layout Shifts (CLS) scores in RUM vs synthetic
- Investigate RUM Sessions
Questions? Feedback? Suggestions?
We'd love to hear from you! Send us a note at support@speedcurve.com