UPDATE: Bookmark and compare synthetic tests

One of the huge benefits of tracking web performance over time is the ability to see trends and compare metrics. Last year we added new functionality that makes it easy for you to bookmark and compare different synthetic tests in your test history. We recently added some additional enhancements to make comparing tests even easier.
With the 'Compare' feature, you can generate side-by-side comparisons that let you not only spot regressions, but easily identify what caused them:
- Compare the same page at different points in time
- Compare two versions of the same page – for example, one with ads and one without
- Understand which metrics got better or worse
- Identify which common requests got bigger/smaller or slower/faster
- Spot any new or unique requests – such as JavaScript and images – and see their impact on performance
Along the way, we've also made it much more intuitive for you to drill down into your detailed synthetic test results. Let's take a look...
How to bookmark sites for comparison
(If you're more into watching than reading, scroll down to the bottom of this post to check out our short explainer video.)
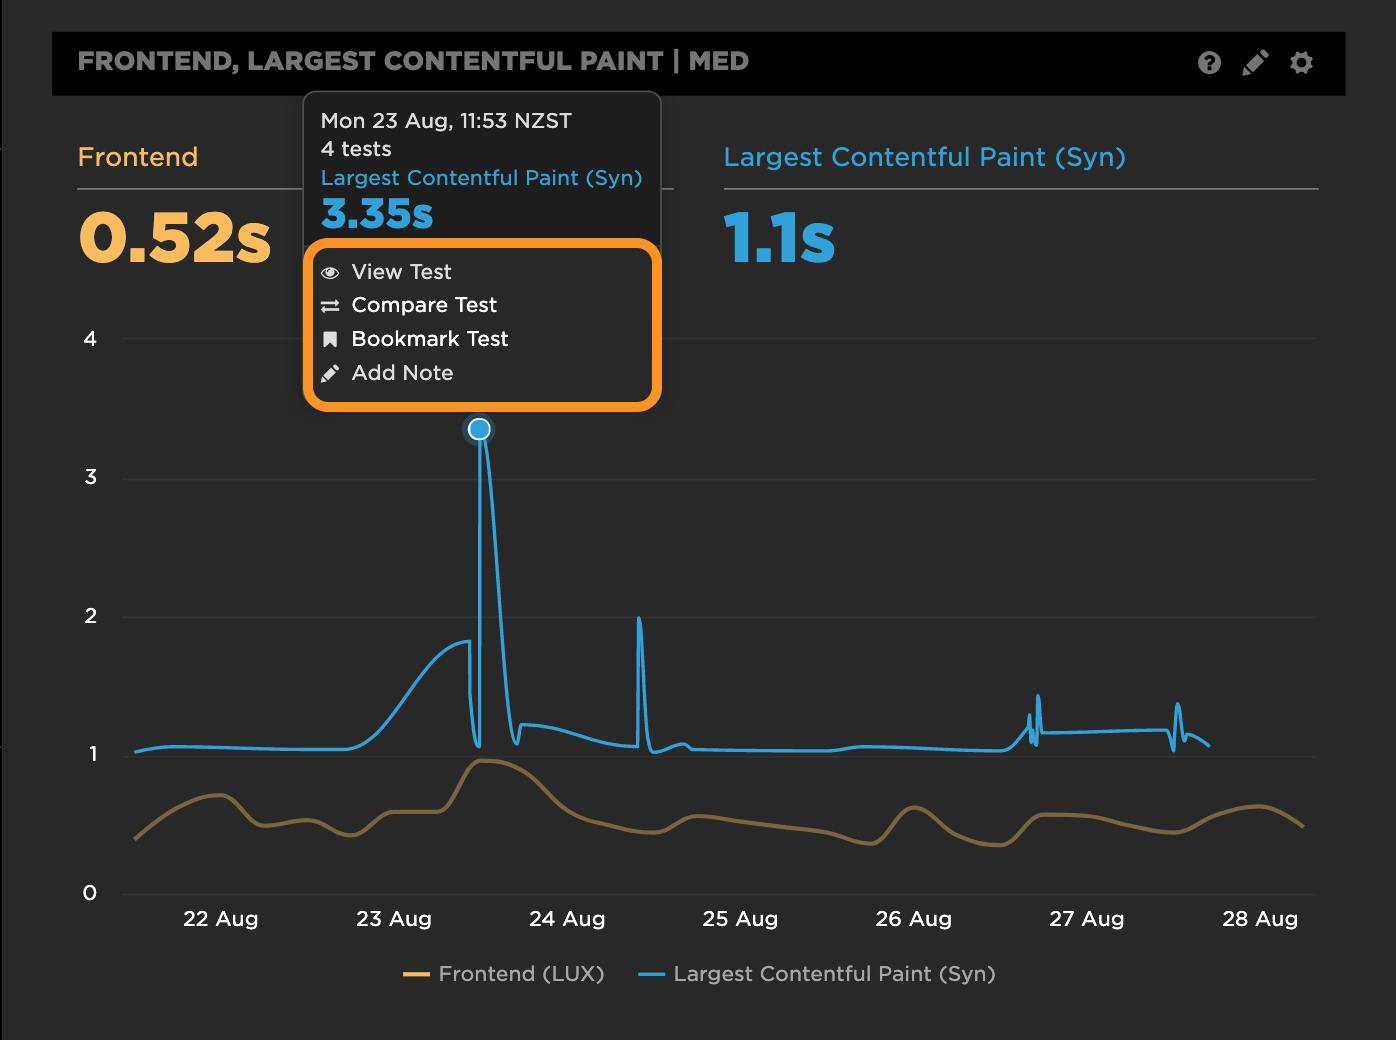
To get started, hover over data point in any time series chart and click. Within the popup, you can click "View Test" to see the full median test result for that test run. Or, if you already know that you want to bookmark that test for comparison, you can simply hit "Bookmark Test" within the popup.
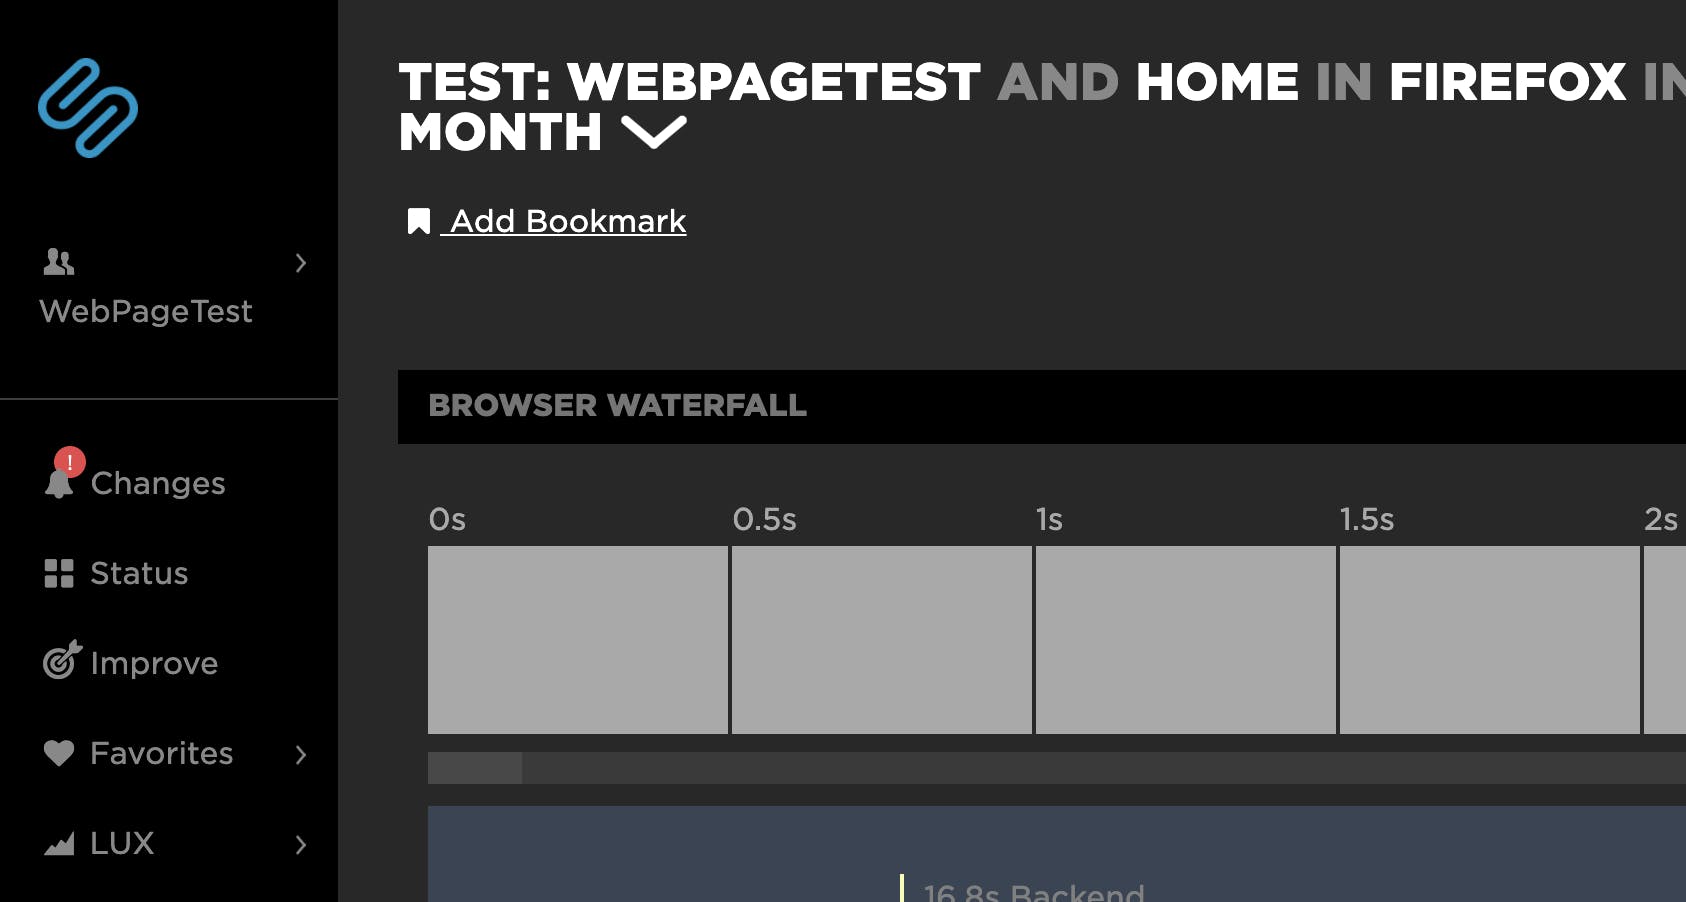
If you've drilled down into a Synthetic test result and confirmed that you want to bookmark it for comparison, all you need to do is click the "Add Bookmark" link in the top-left corner of the window.
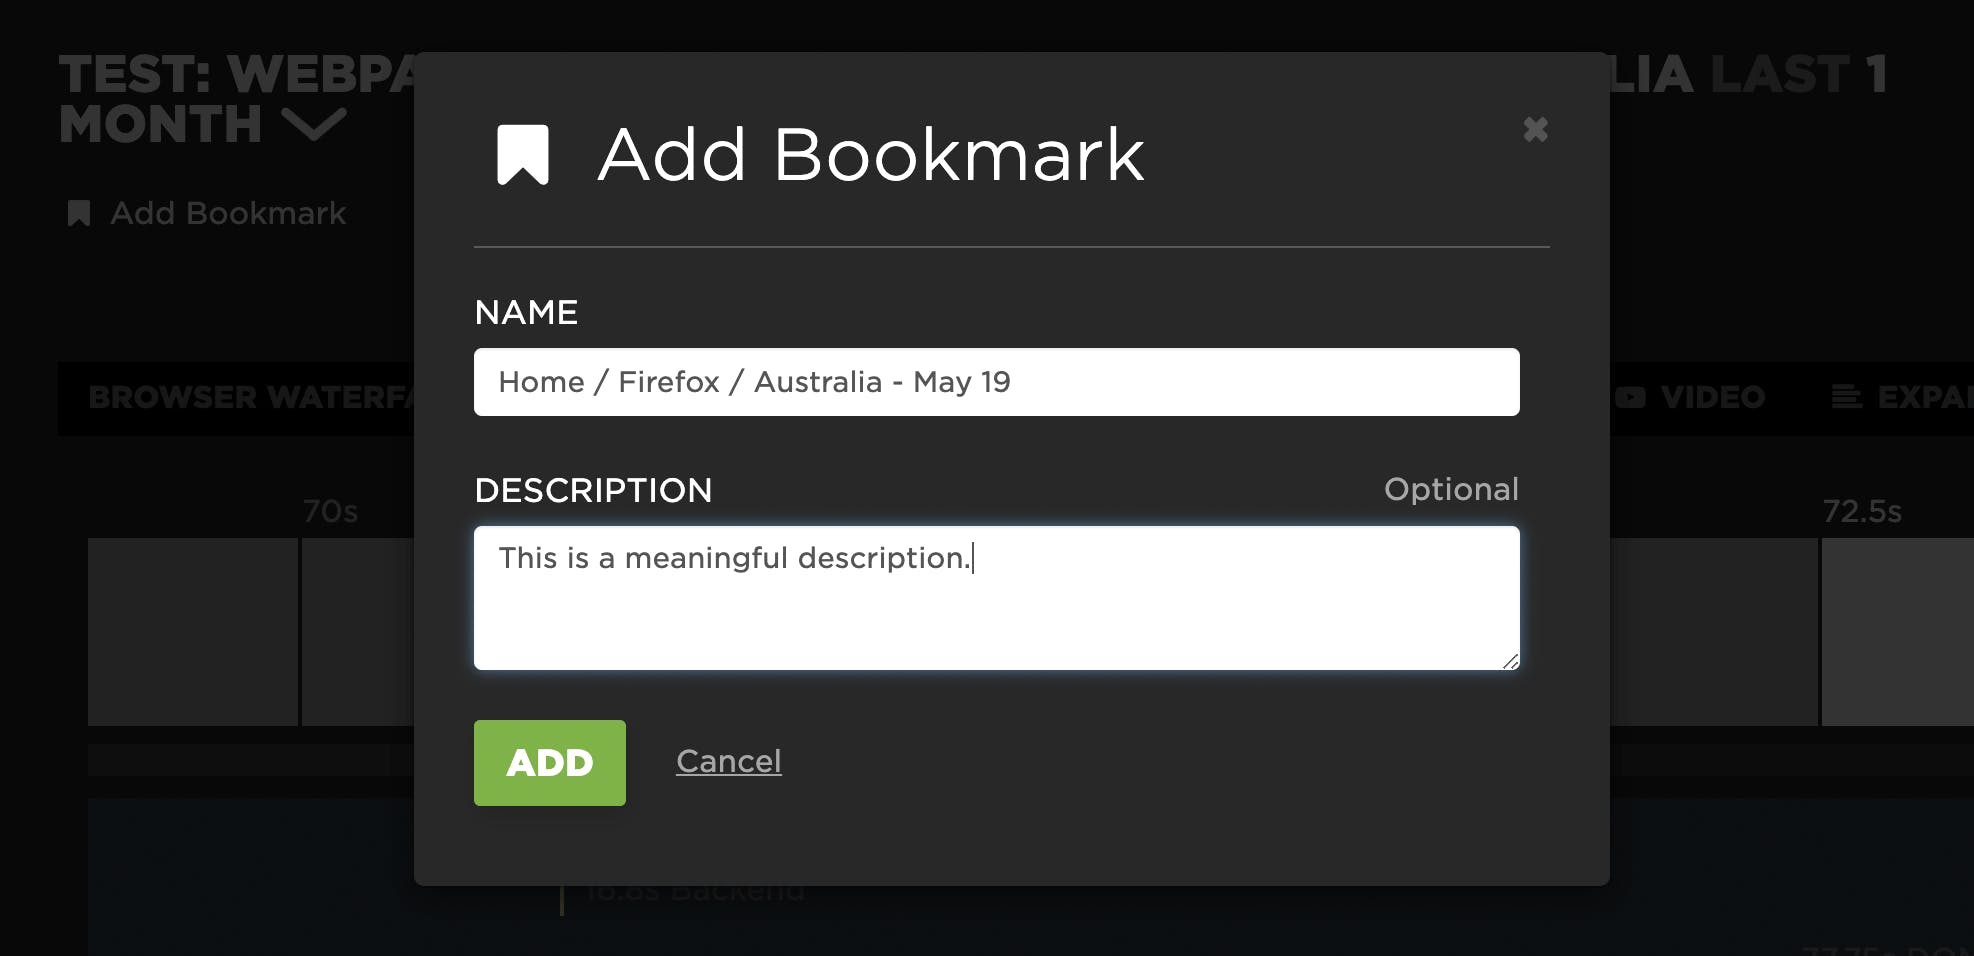
Then you have the option of giving the bookmarked test a meaningful name and/or description.
If you change your mind, just click "Remove Bookmark".
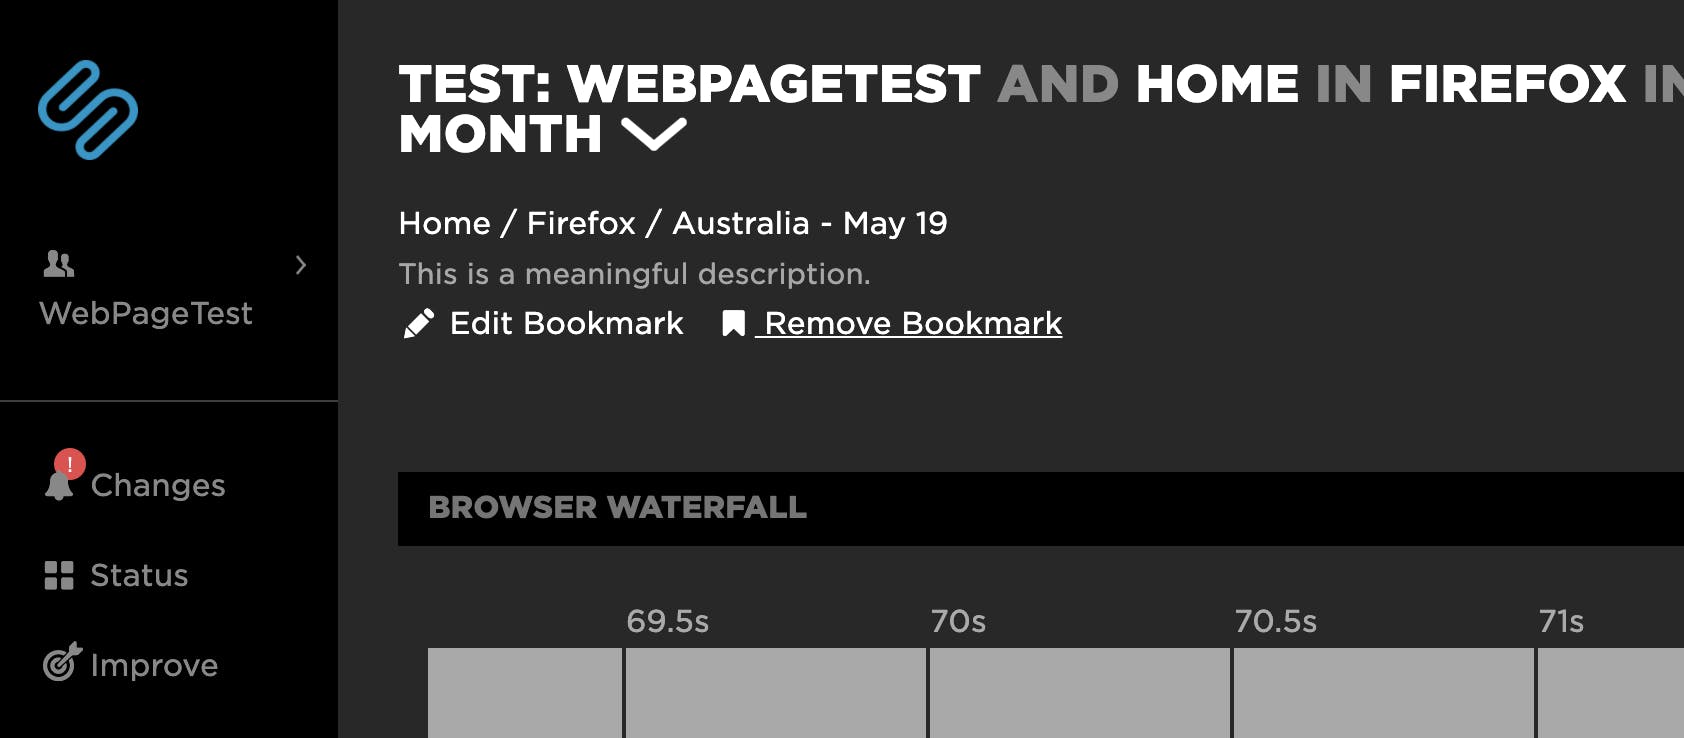
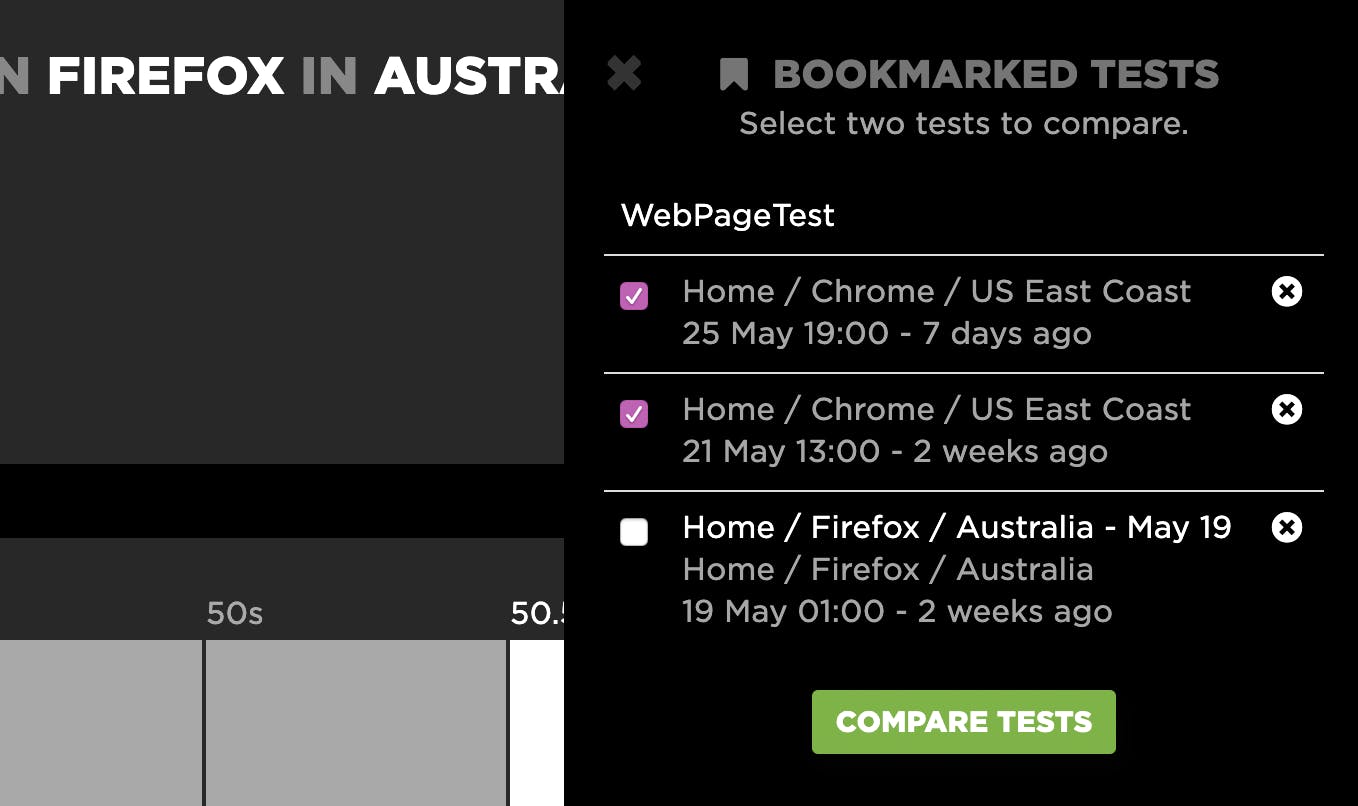
Clicking on the bookmark icon in the top-right corner of the window shows you a list of all the tests you've bookmarked for comparison. Note that you can bookmark multiple tests, but you can only compare two at a time.
NEW: Compare directly from your charts
If you just want to compare two tests and aren't interested in bookmarking them, just click on "Compare Test" within the popup. You'll then see a message instructing you to select another test for comparison.
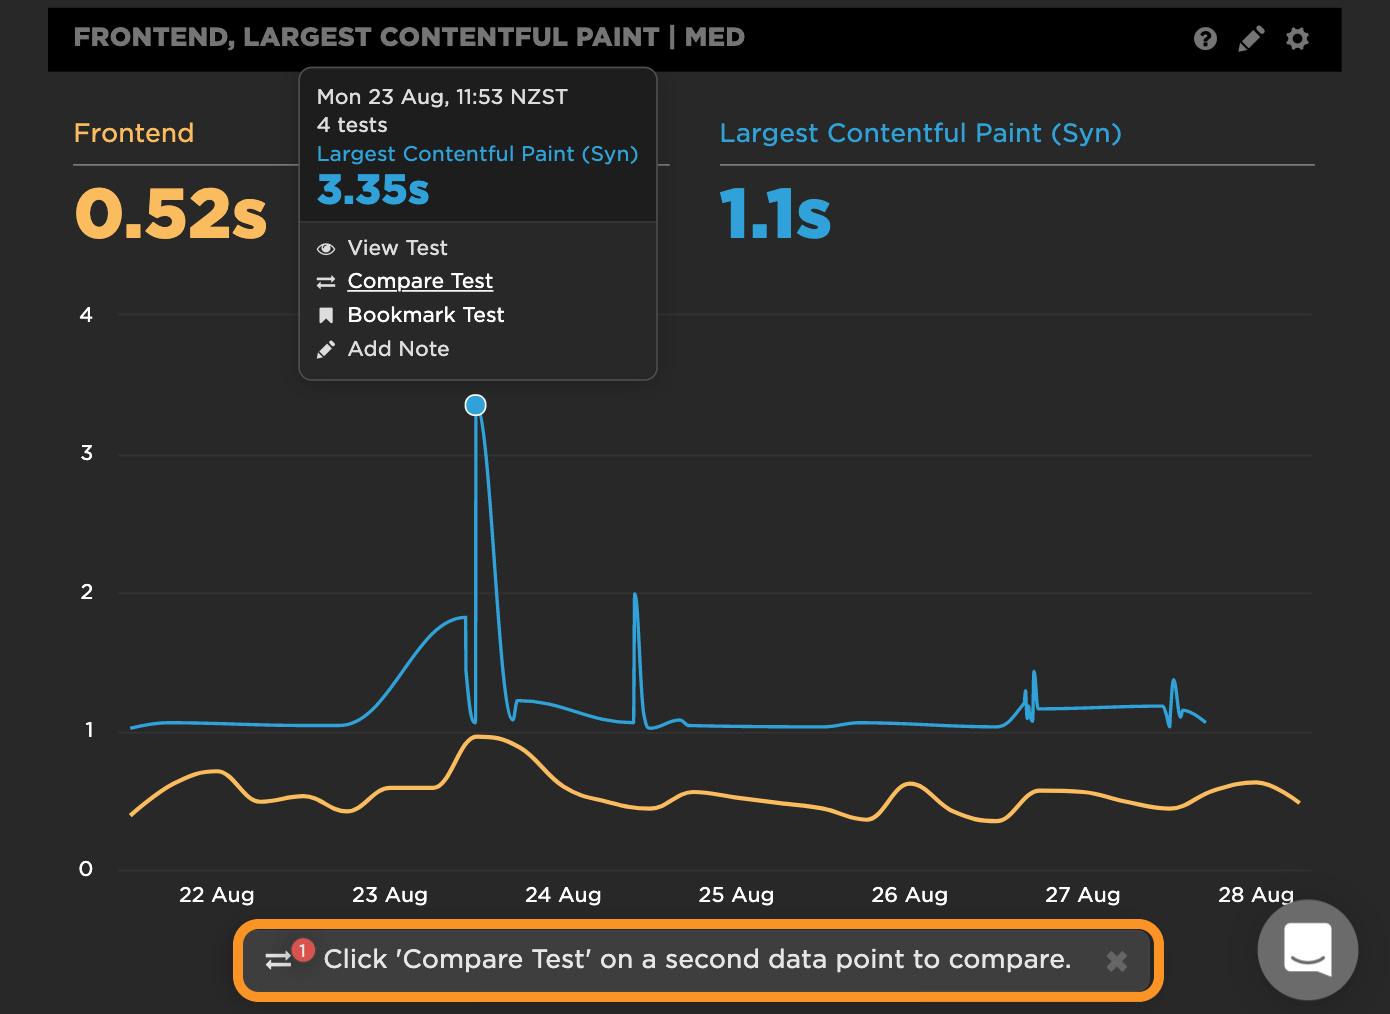
You can click on any synthetic test within the dashboard (or another dashboard with synthetic charts). Once you click on the second test, you'll be directed to the Compare dashboard.
Test case: CNN
Now let's walk through how to run a comparison and analysis using a real-world example from our "Top Sites" demo account. In this demo account, we track a number of leading retail, travel, and media sites. I've randomly selected CNN for the purpose of this post.
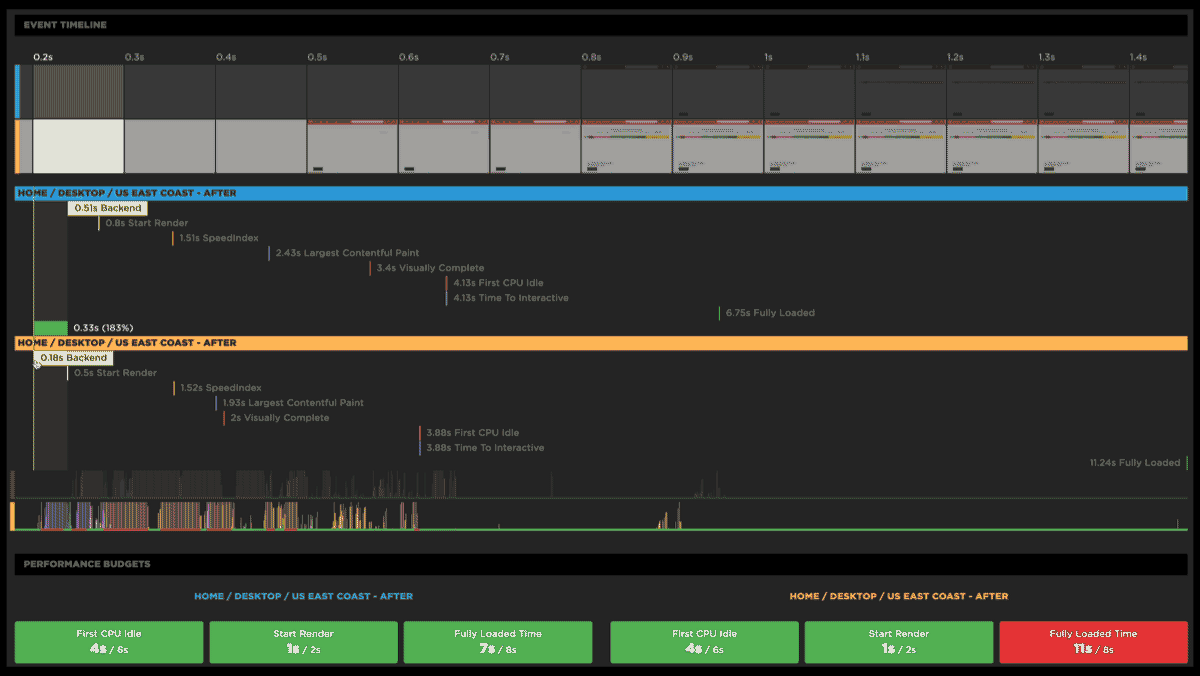
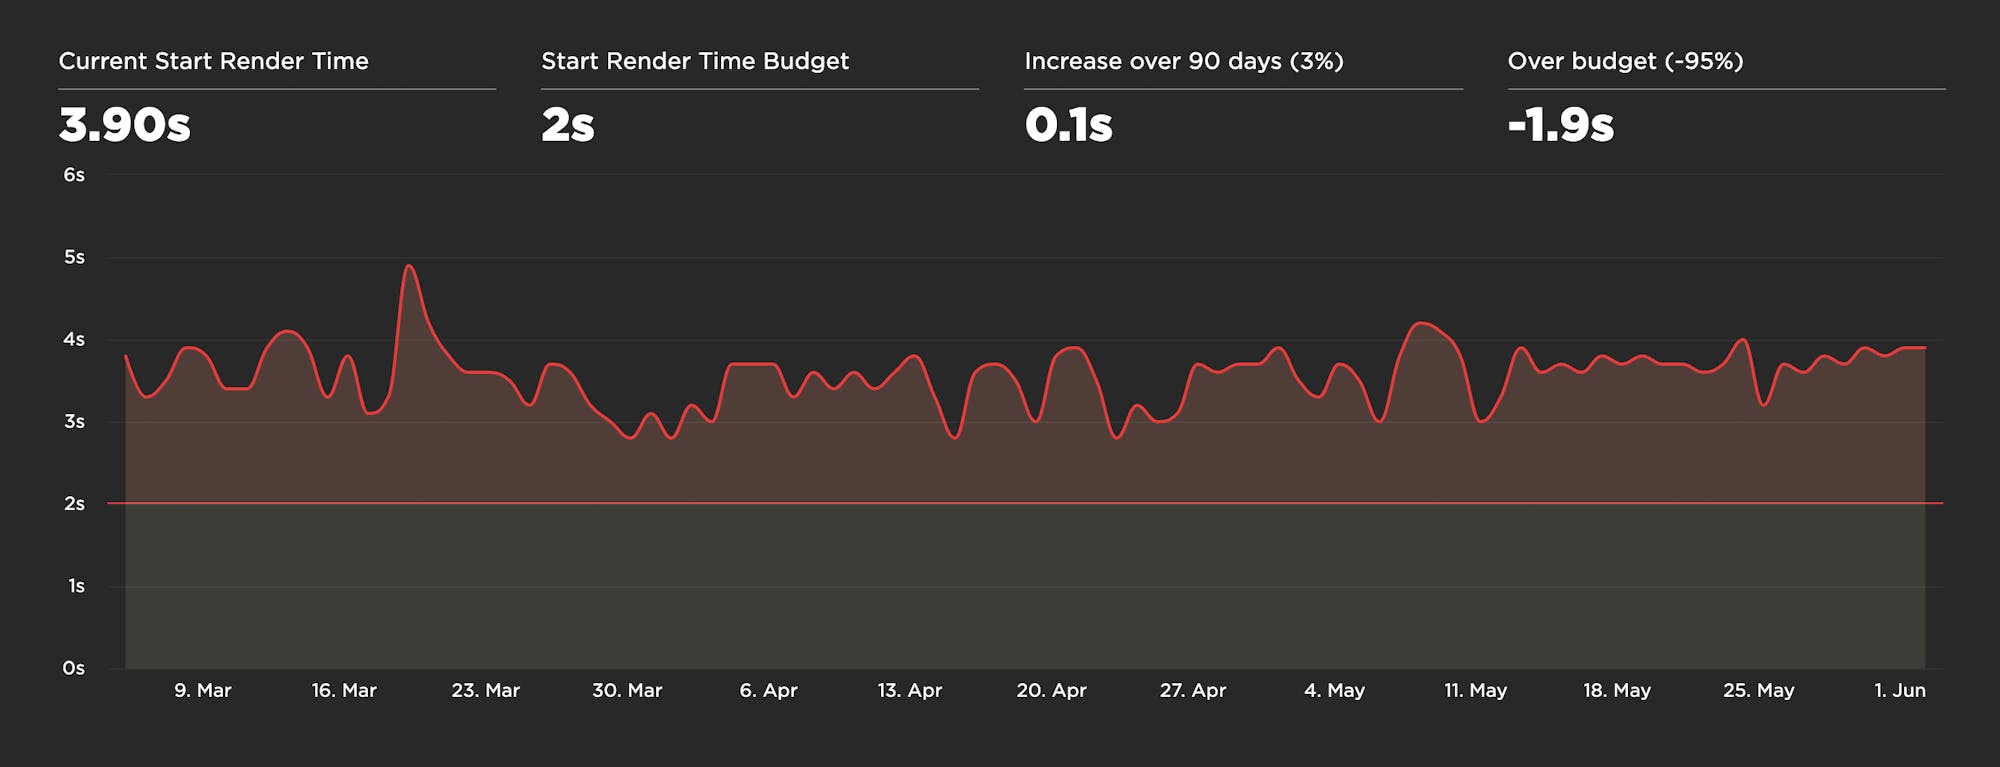
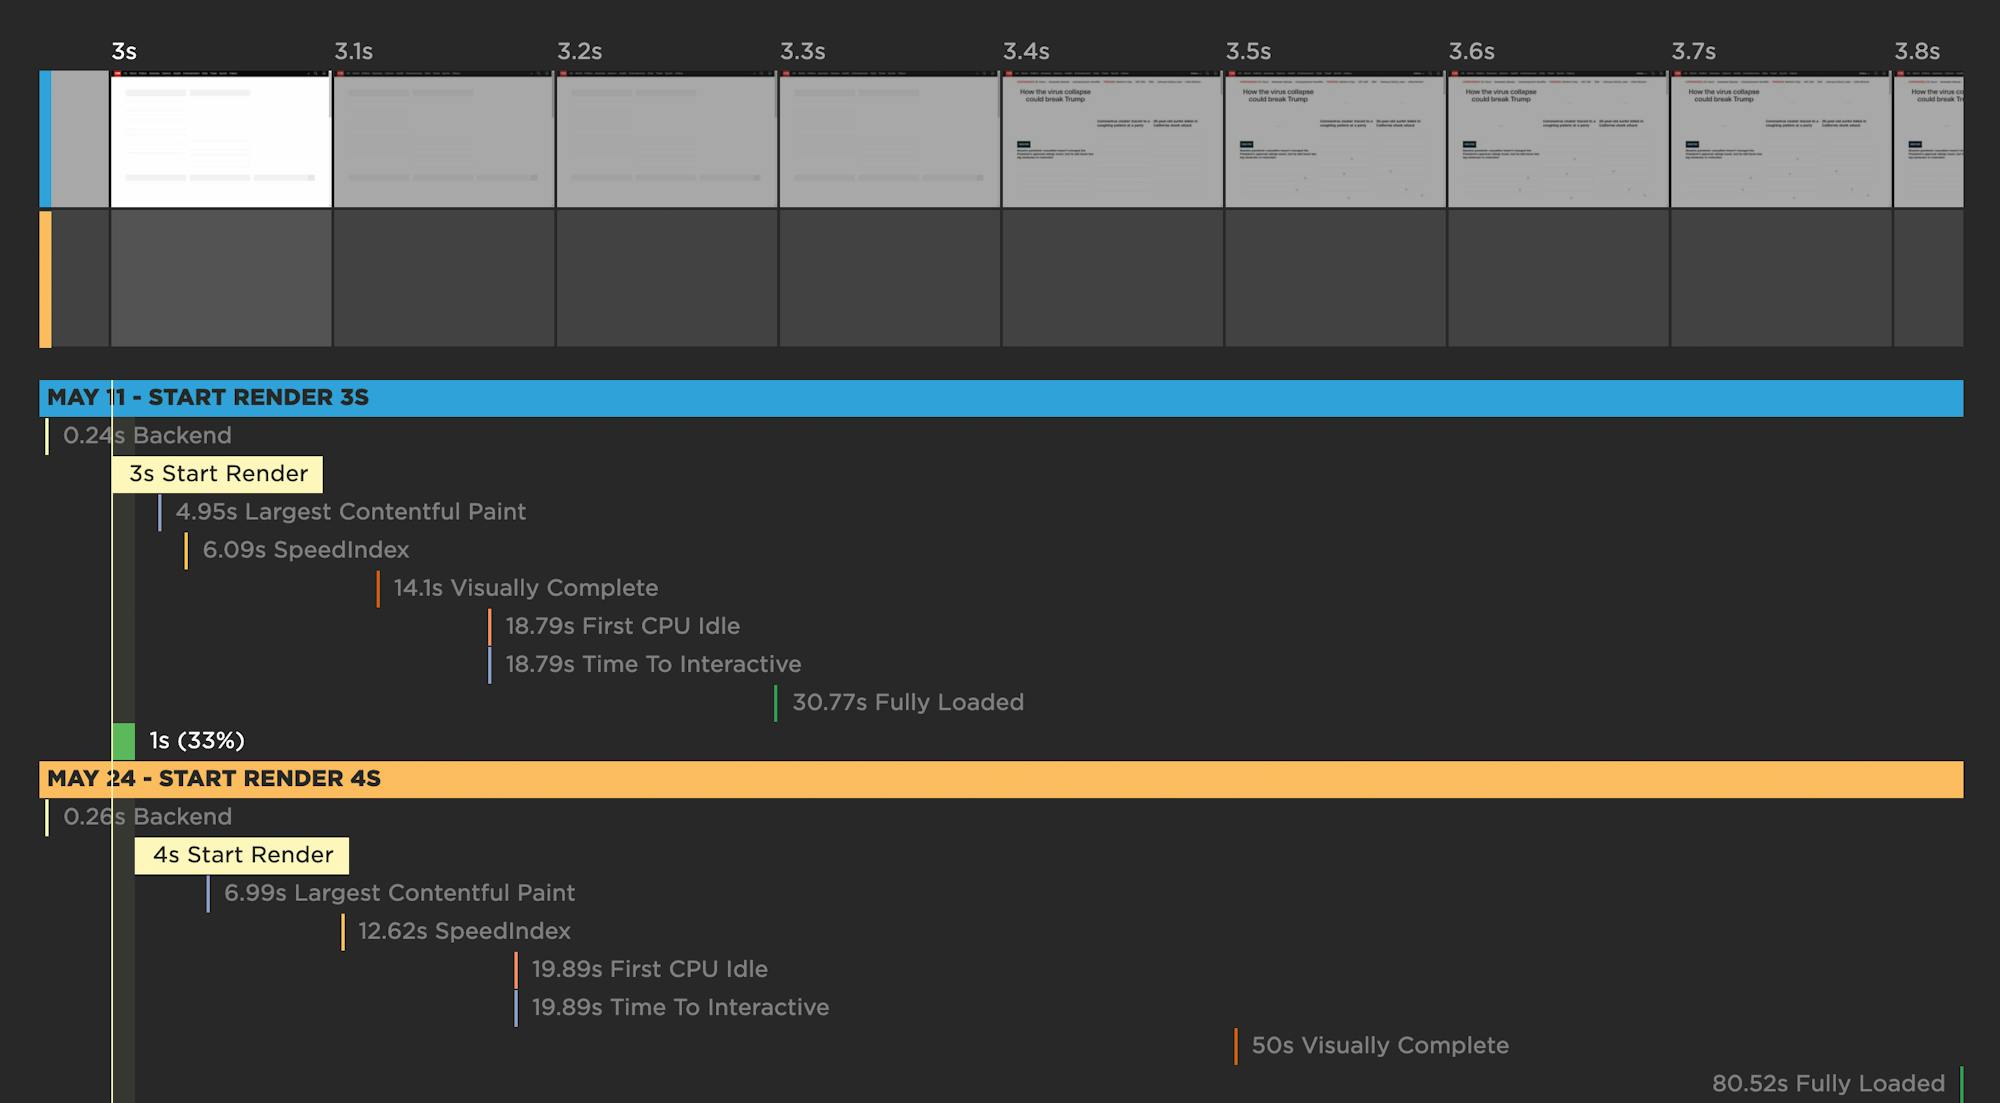
Looking at the last three month's worth of Synthetic test data, we can see that the CNN home page has a Start Render time that's consistently above the 2-second threshold that we usually recommend – and that Start Render has sometimes hit almost 5 seconds.
Let's look at some of the peaks and valleys on their time series chart to see if we can spot the issues. To start, we'll quickly bookmark these two tests:
- Monday 11 May - Start Render 3s
- Saturday 24 May - Start Render 4s
Now that we've selected these two tests, let's look at them side by side.
Here you can see the visuals are stacked compactly so you can easily spot any differences. Hovering over any metric in the waterfall chart shows you the metric for both tests. It also shows you how the metrics align with the rendering filmstrips. For example, you can see that not much is happening in either filmstrip when Start Render fires:
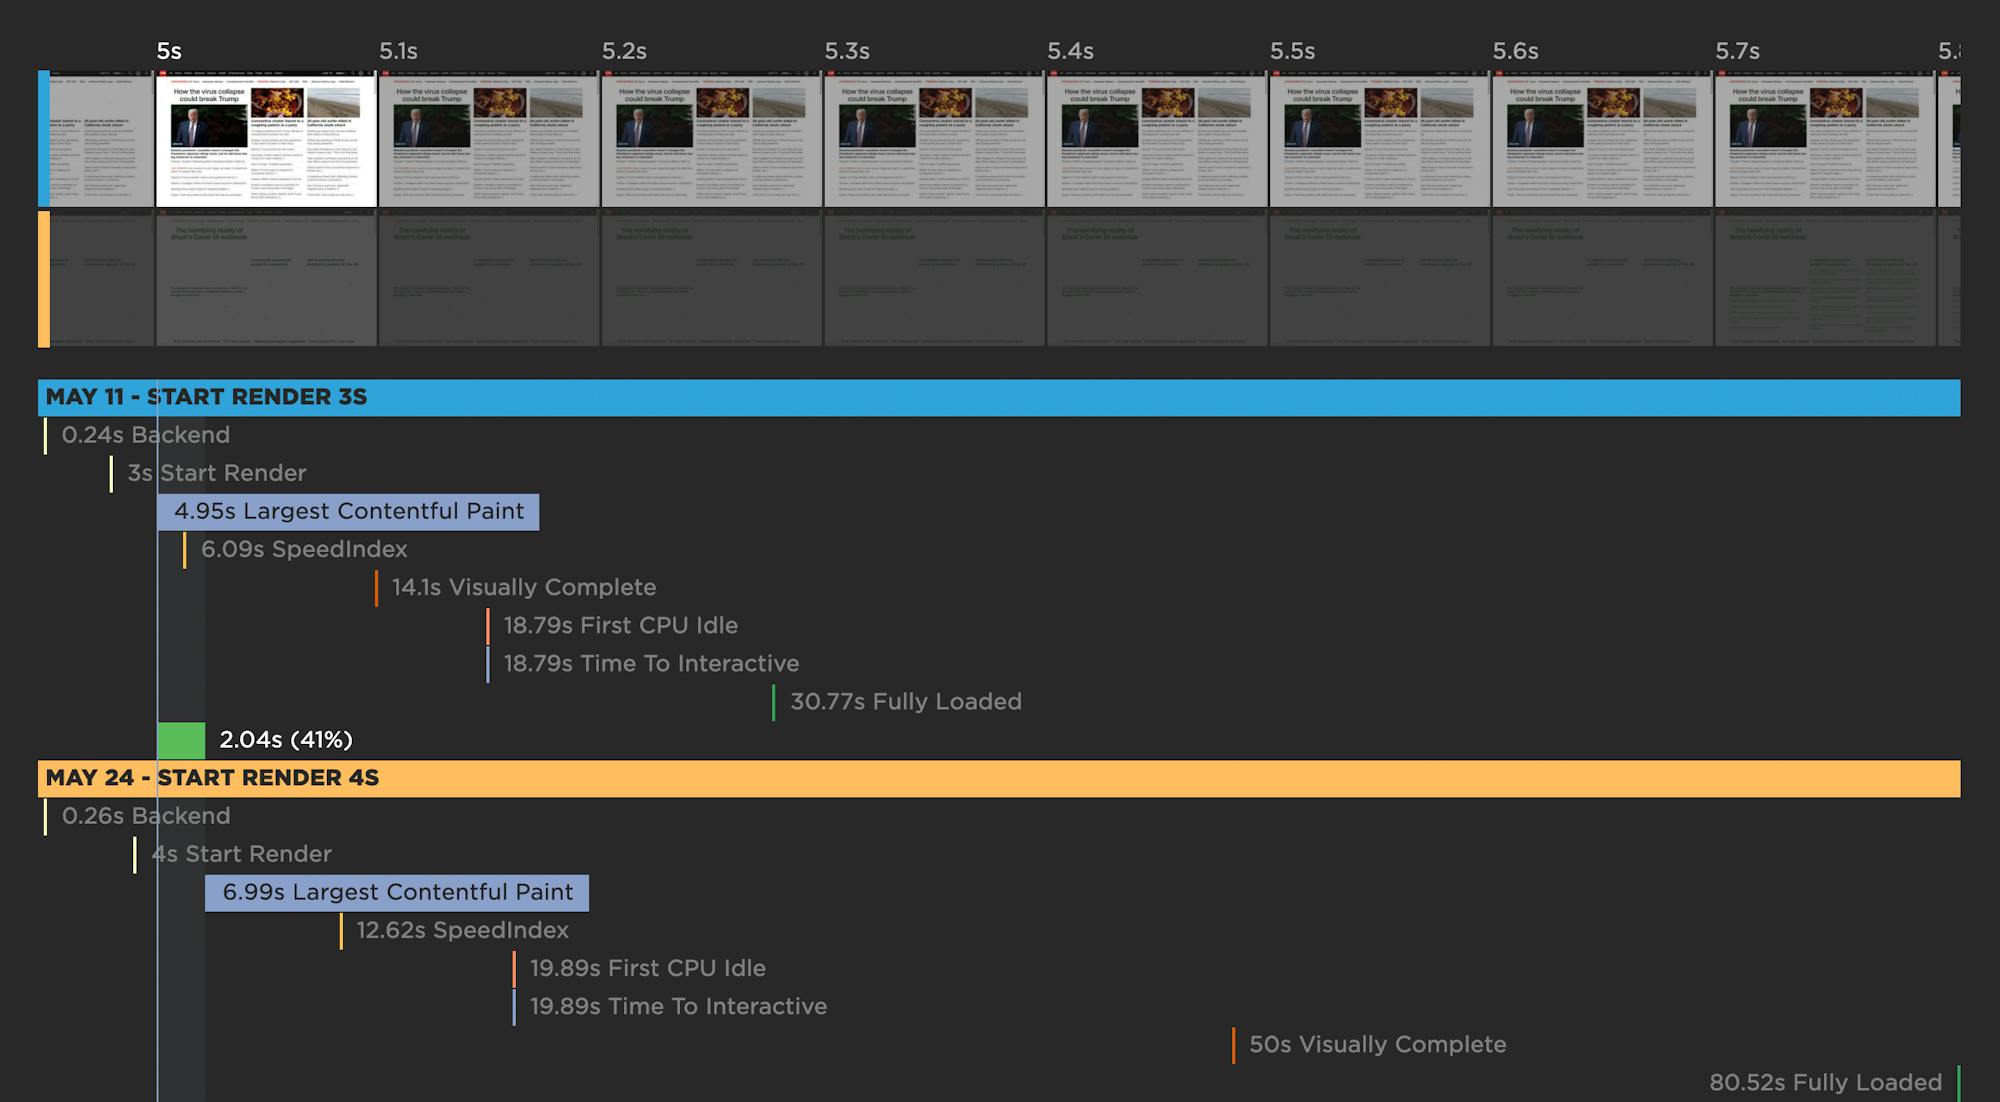
For this particular page, it looks like Largest Contentful Paint is a more meaningful metric, in terms of tracking when important content has rendered, so let's look at that. Things look a bit better in the May 11 test when Largest Contentful Paint fires at 4.95 seconds. In the May 24 test, LCP lags at almost 7 seconds.
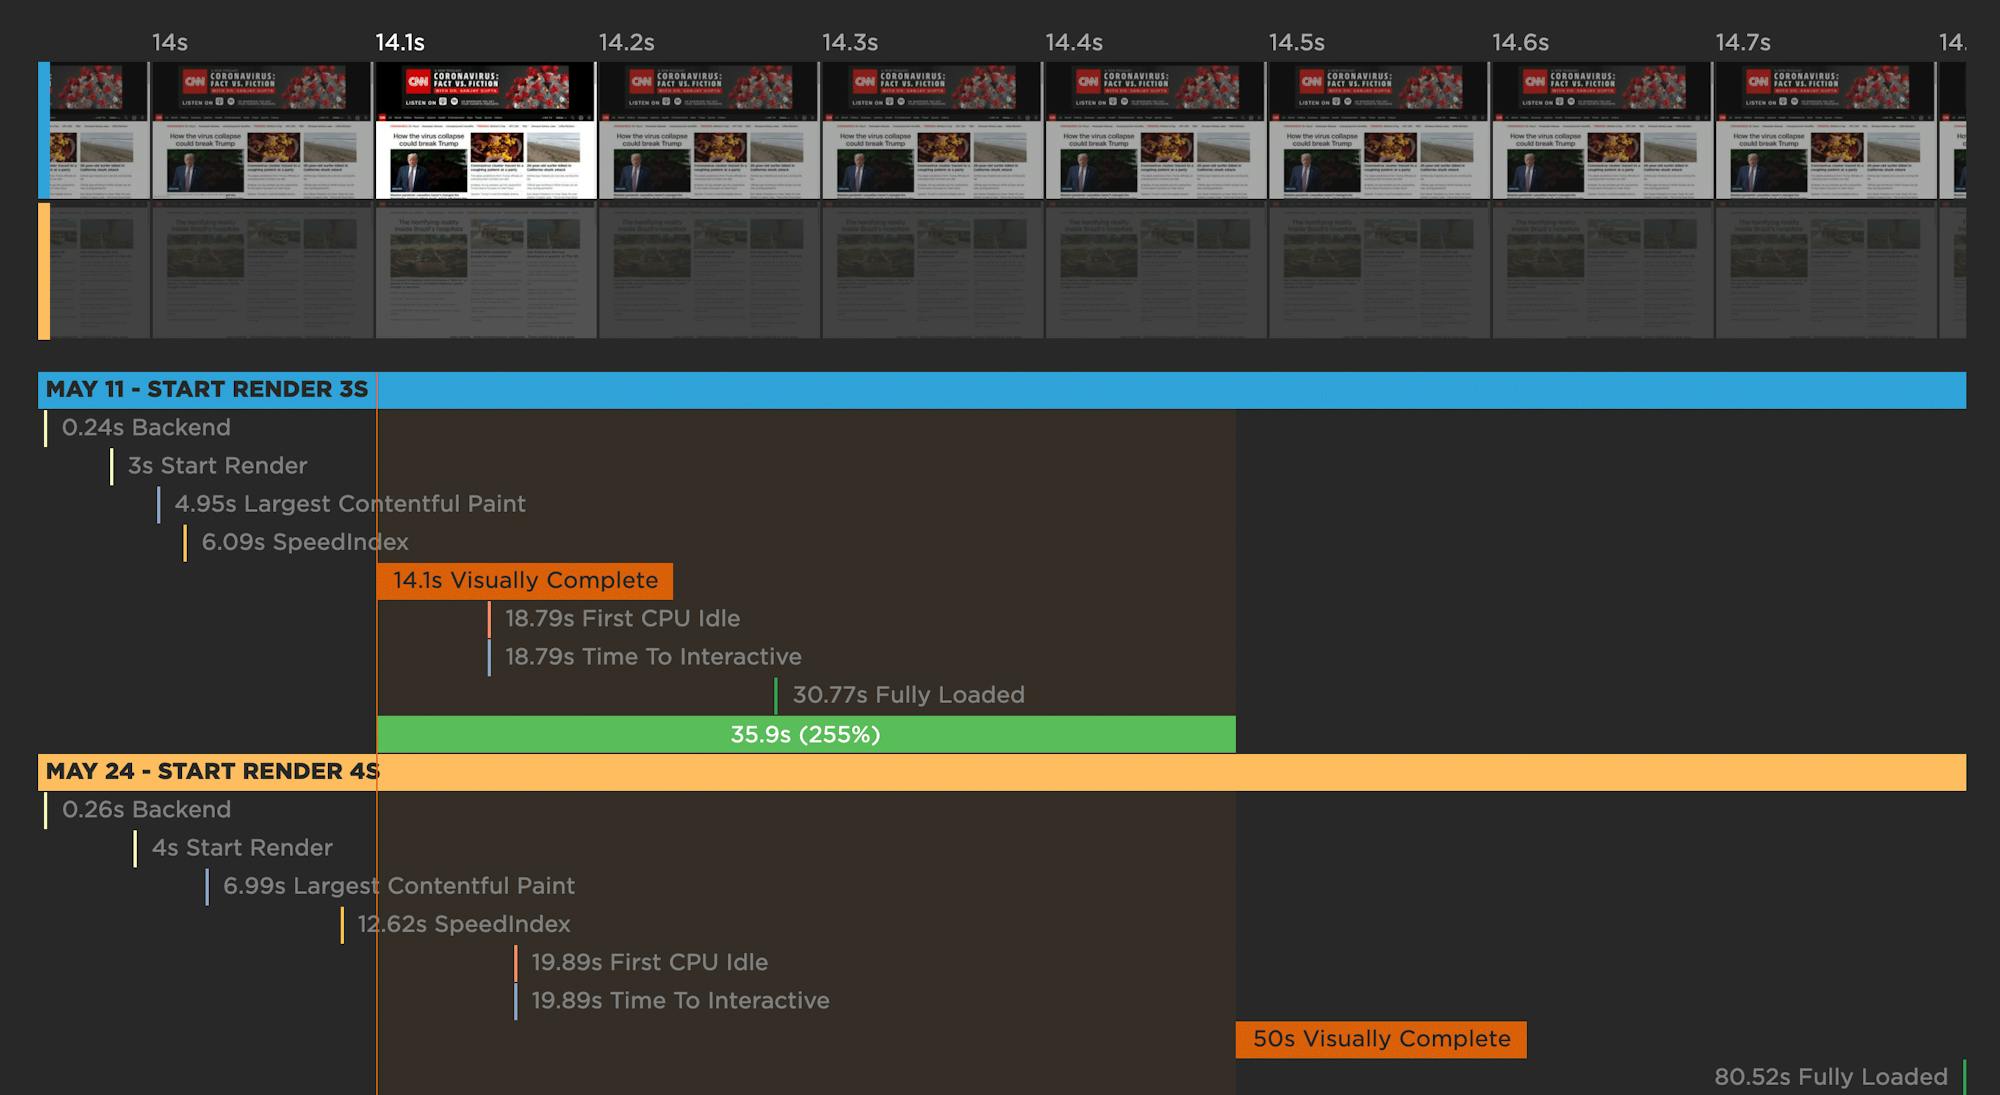
The gaps get much broader when you look at Visually Complete and Fully Loaded (below). Delays in those metrics can be an indicator that, even though the page's visible content might have rendered, the page might be janky and unpleasant to interact with.
Just below the waterfalls, the CPU timelines are really telling:
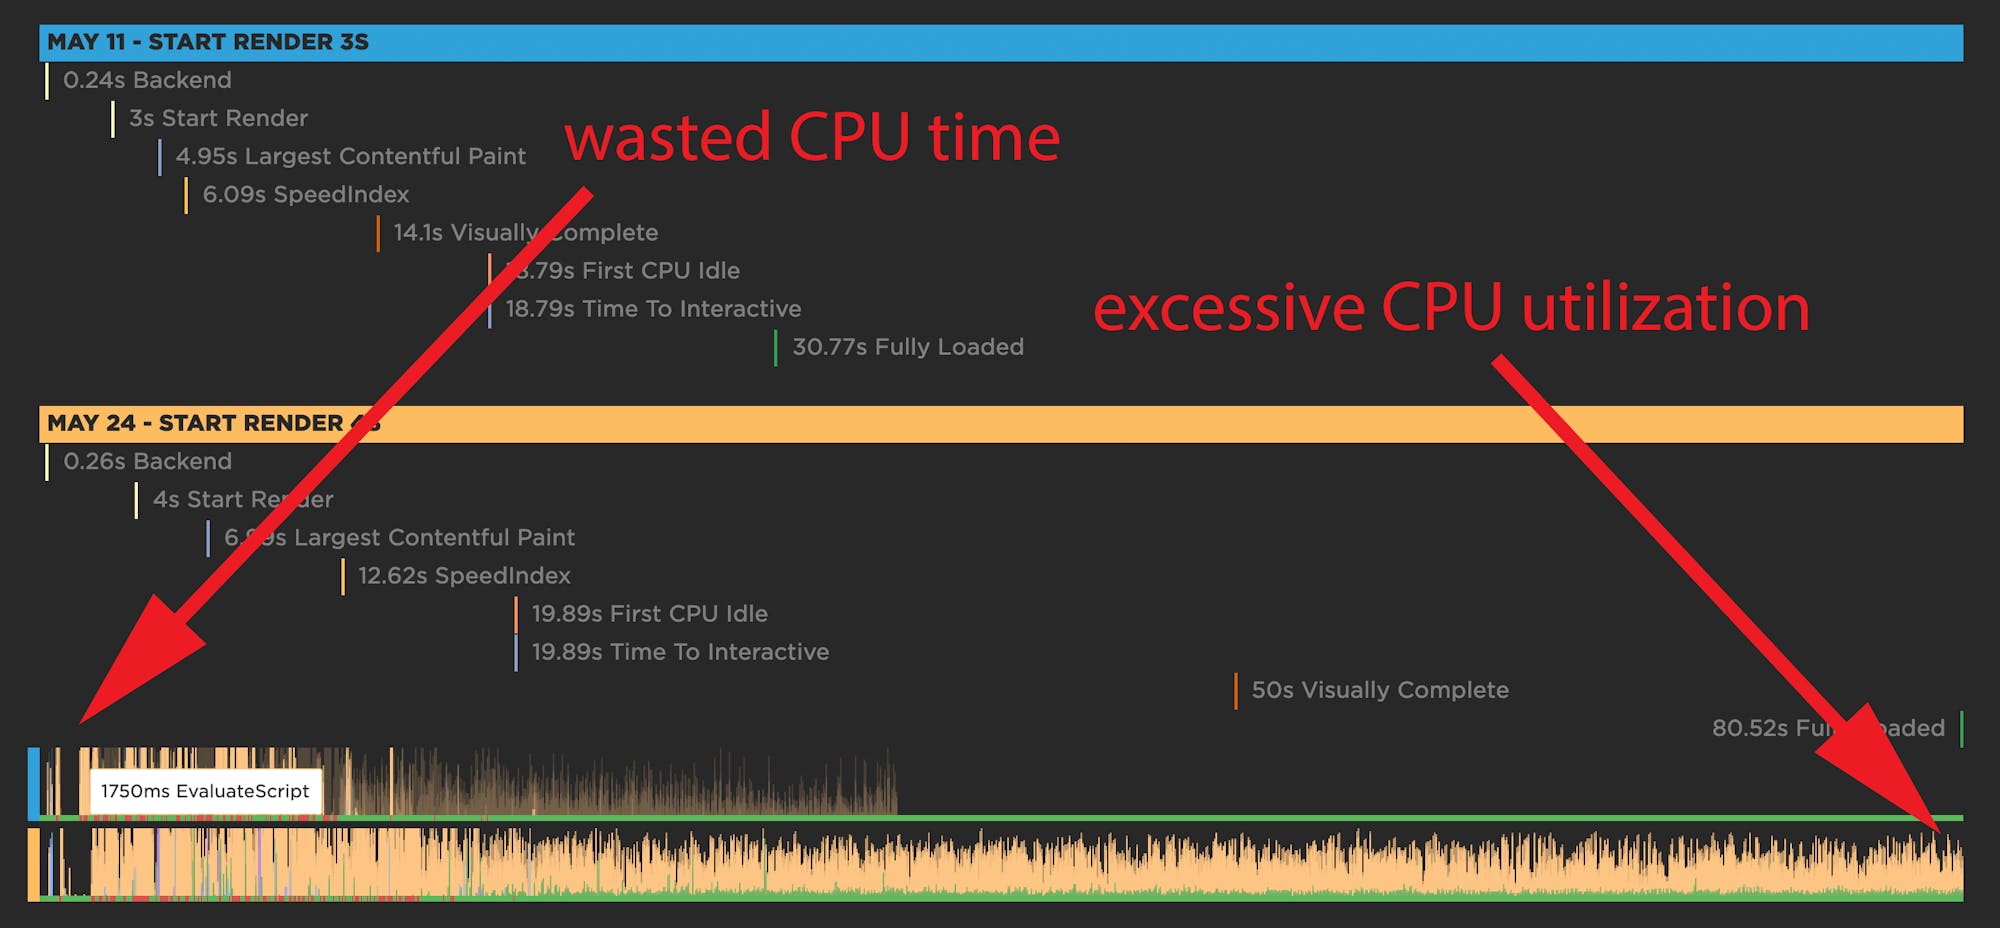
Ideally, you want to see a busy CPU at the start of the page render, but both tests show pockets of dead time early on. CPU utilization doesn't pick up till around 1.7 seconds for the May 11 test and 2.2 seconds for the May 24 test. This begins to explain the slow Start Render.
The CPU timeline for the May 24 test also shows that the CPU is thrashing for the entire 80-second duration that the page is rendering.
Two questions for investigation
Based on the comparison so far, there are two questions for investigation:
- What is causing the delays in Start Render and Largest Contentful Paint? High Start Render and LCP times can give users the feeling that the page is unresponsive.
- What is causing the excessive CPU thrashing? This thrashing can give users the feeling that the page is janky.
Time to dig deeper. To do that, we show you detailed metrics, along with a calculation of what got better or worse. For obvious reasons, the metrics that see the biggest changes are shown at the top of each list.
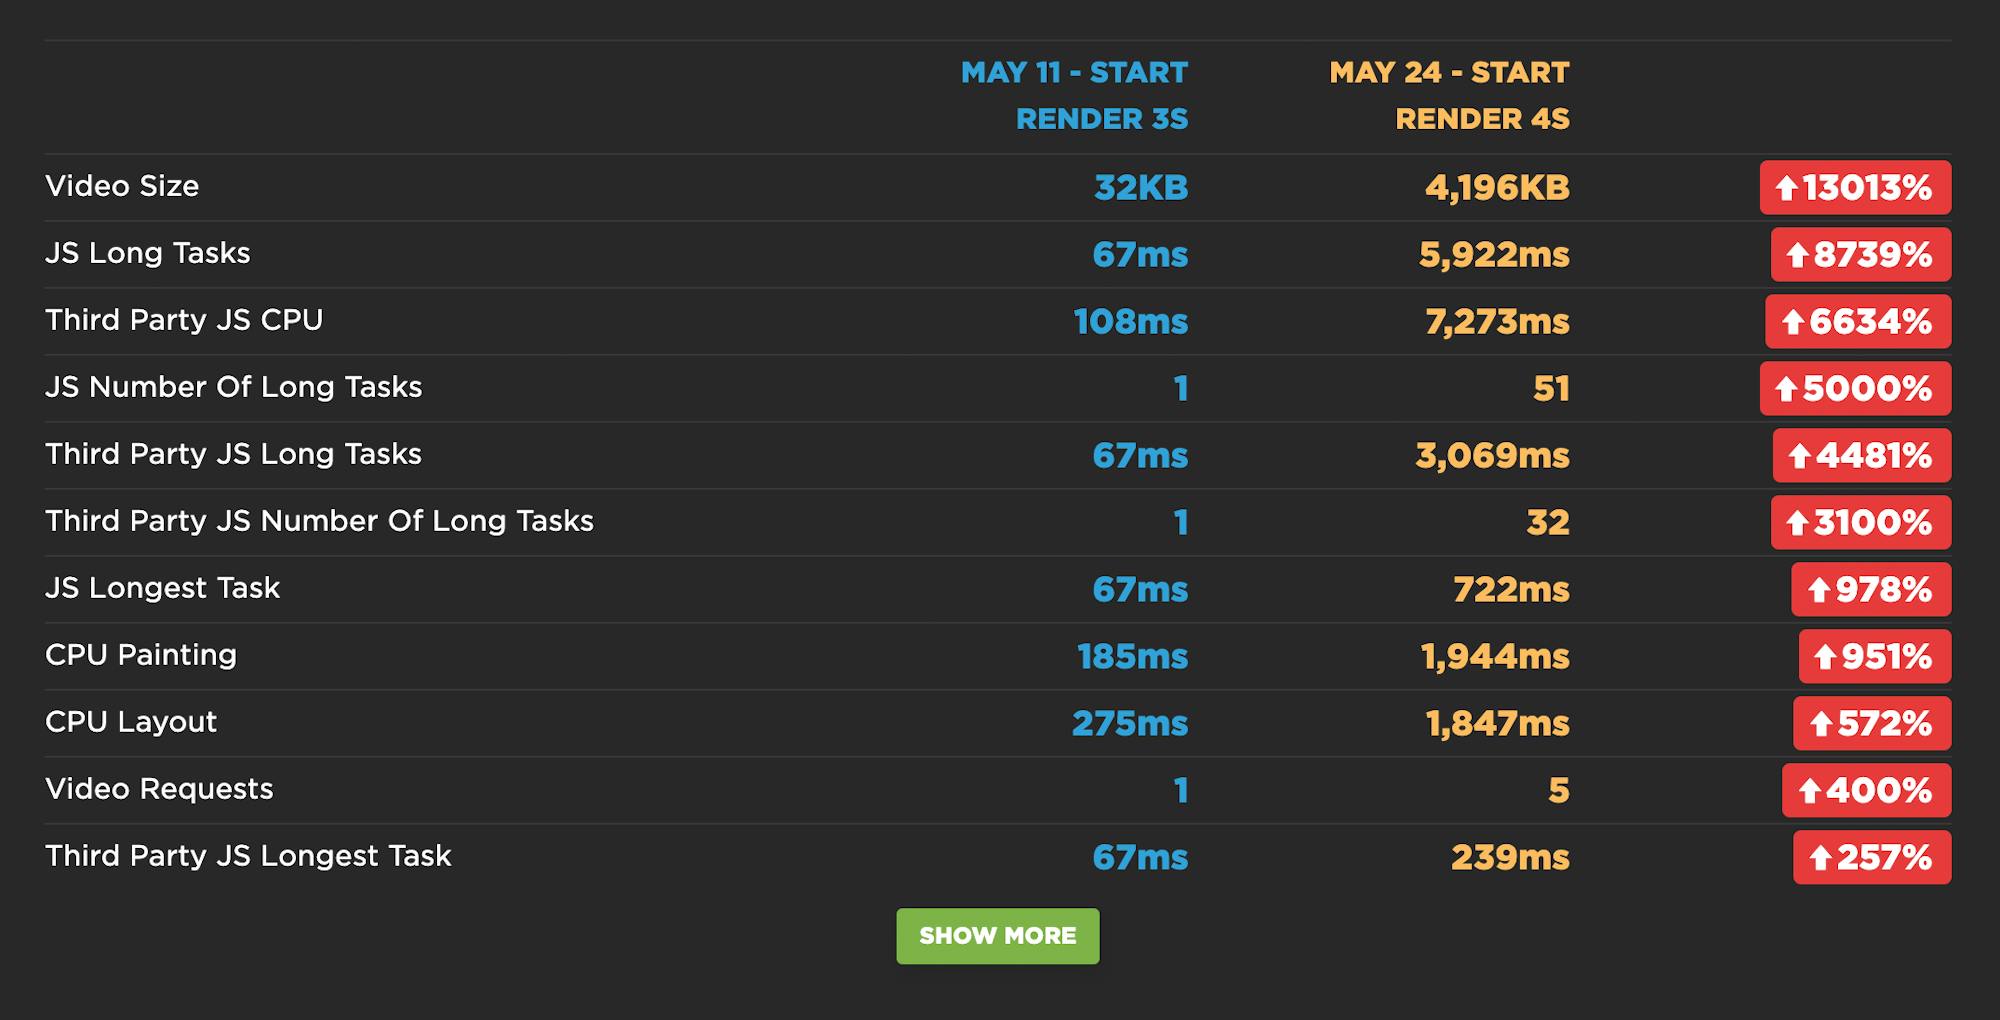
Looking at this list, it's pretty clear where some of the issues lie:
- Video size has jumped from 32KB to more than 4MB. This would help explain the extremely delayed Visually Complete and Fully Loaded times.
- The number of JavaScript Long Tasks has leapt from 1 to 51 – and 32 of these are third parties. The longest Long Task is 722ms.
- On the slower page, third-party JavaScript CPU time is more than 7 seconds – 3 of which are blocking the CPU.
Now that we know that the number and complexity of JS requests is a major issue, we can find out exactly which scripts appear to be the culprits. This is a list of all the common requests that are shared across both pages, along with a calculation of how much performance degradation each request experienced:
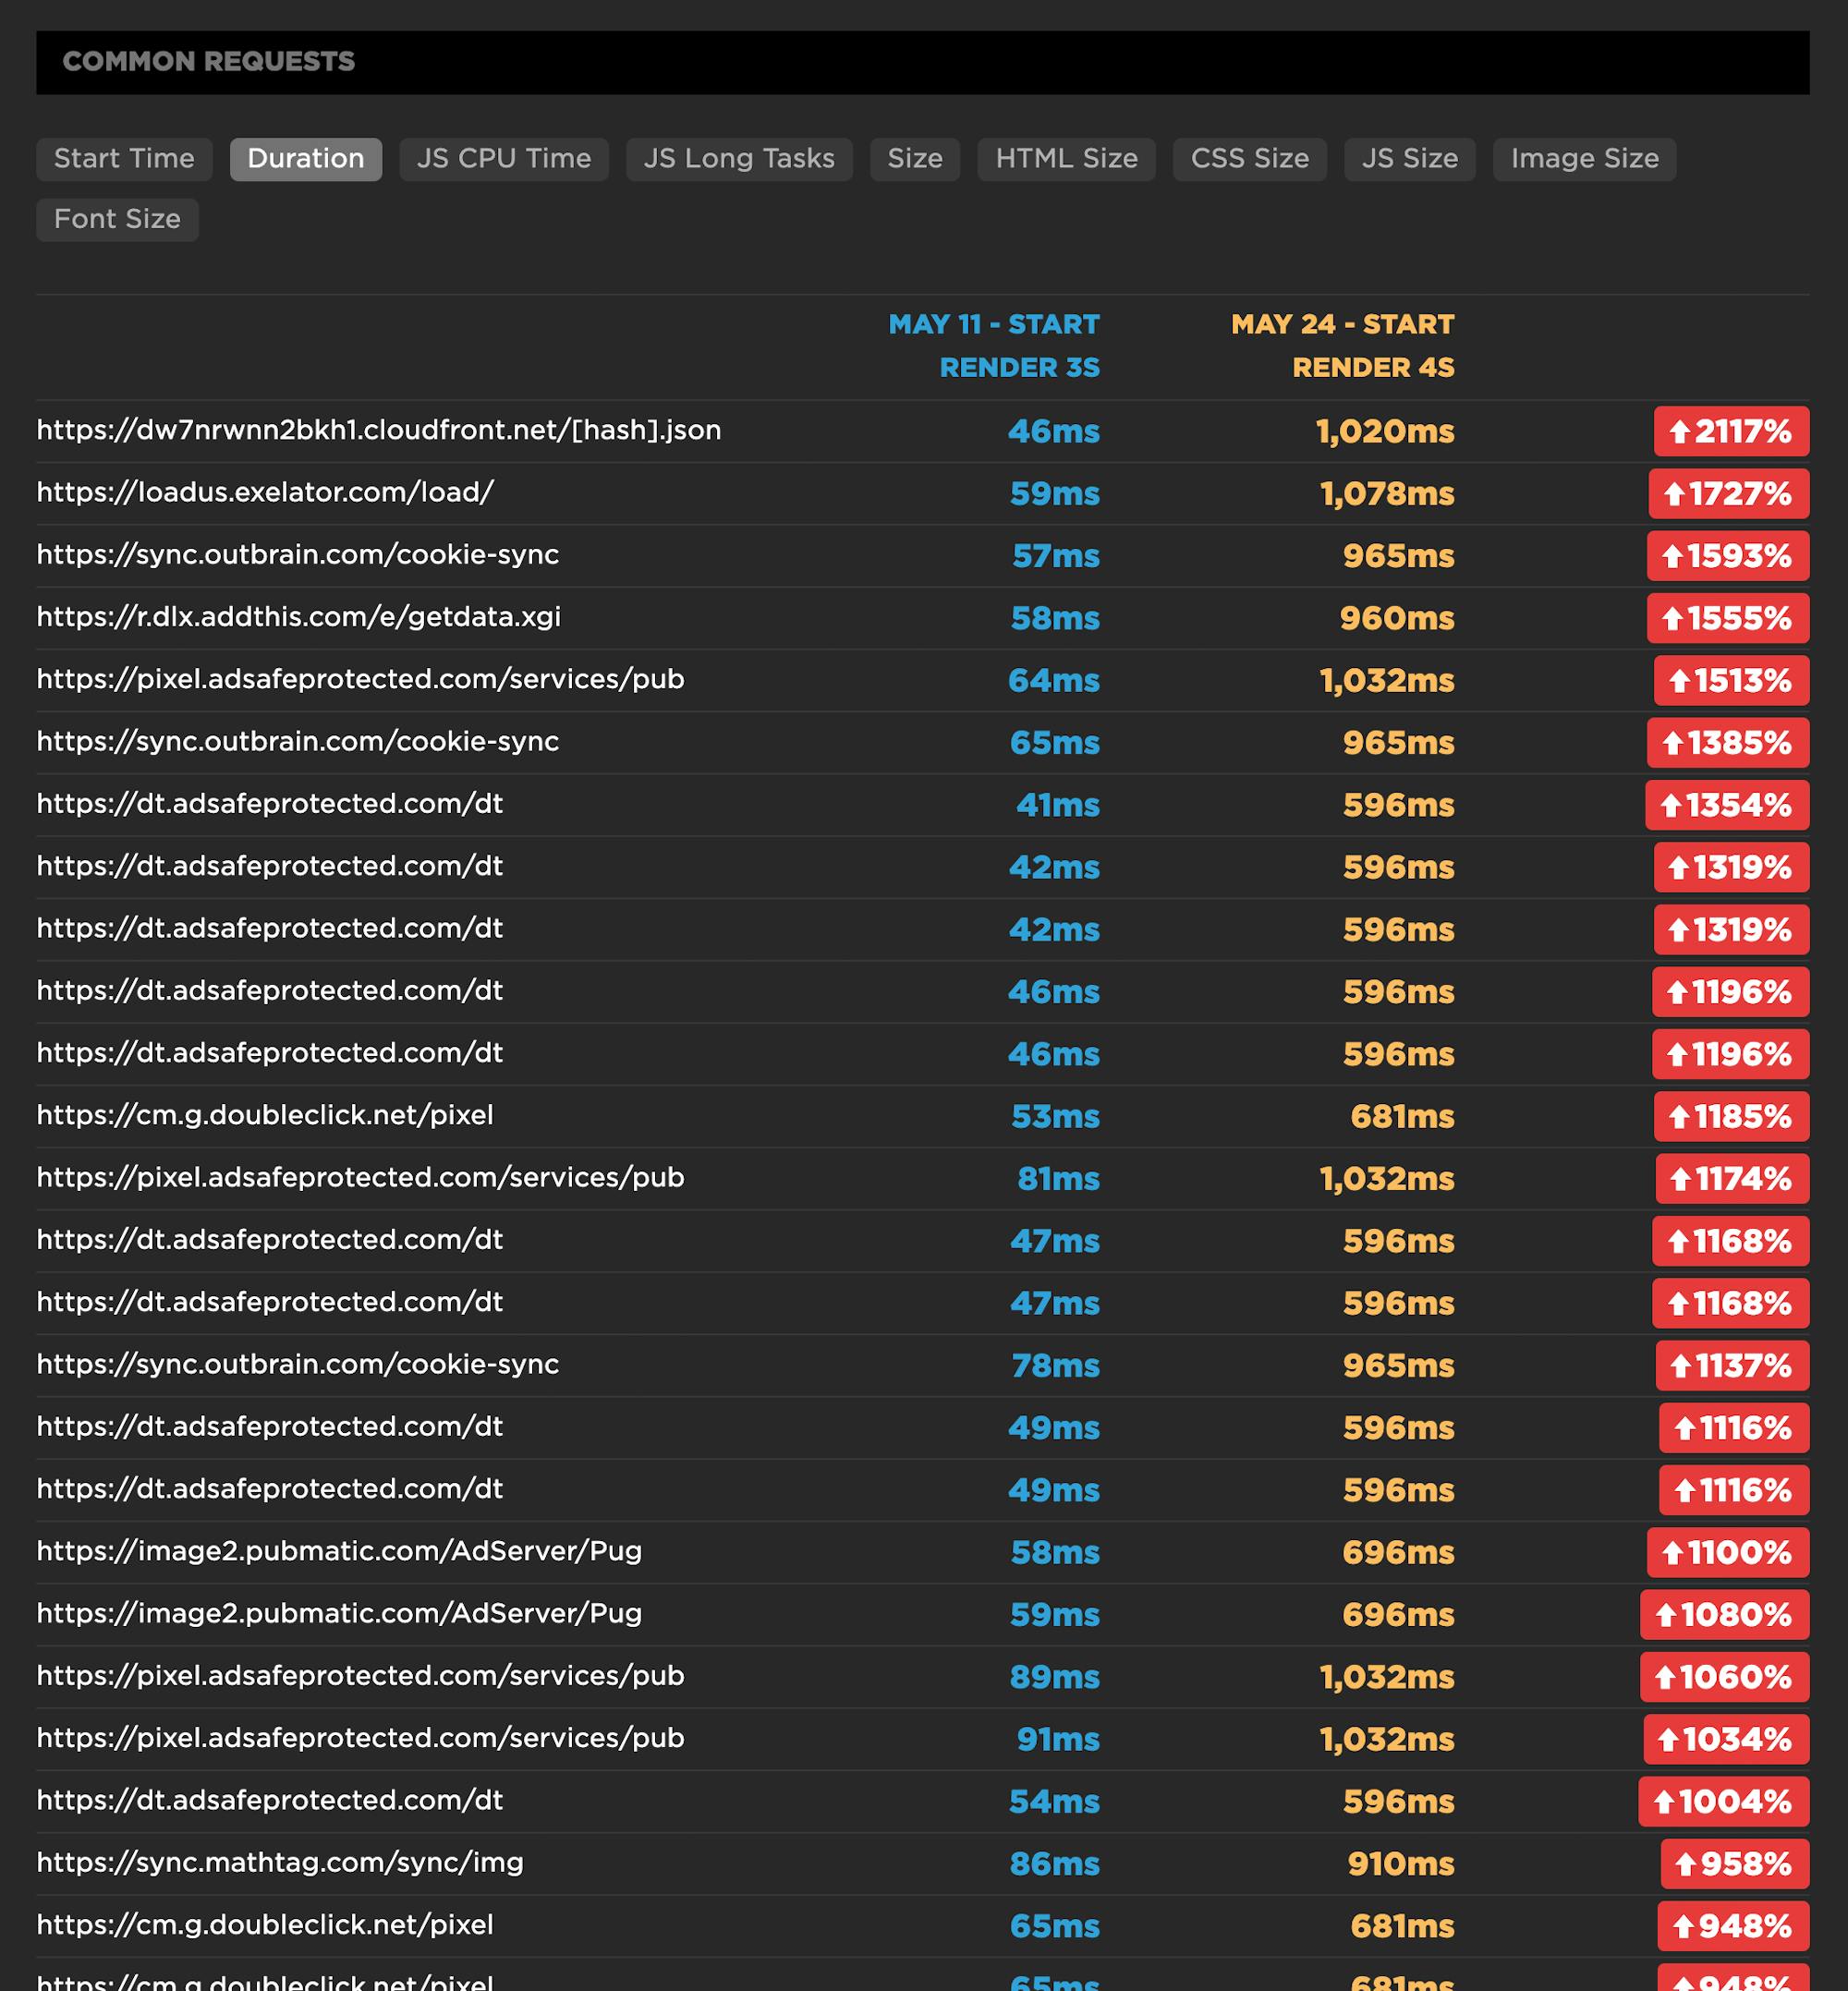
Now let's take a closer look at one of those scripts:
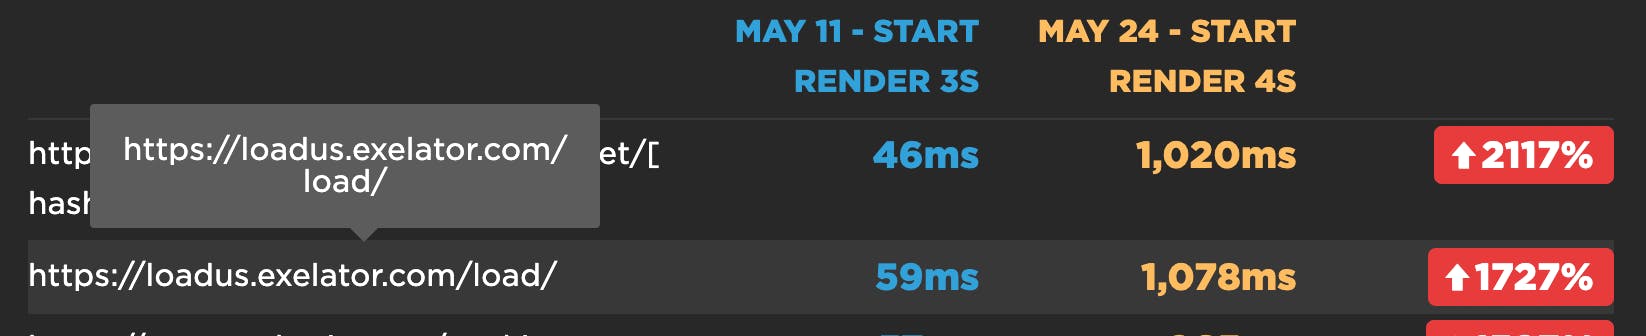
I'm not familiar with Exelator, so I had to look it up to identify it as a data collection tracker that is reportedly owned by Nielsen. Whatever it is, its duration has increased by 1727% – from 59ms to 1078ms. Clicking through to the full test result page for May 24 and searching for Exelator yielded four separate requests, with a total duration of more than 1600ms. Here's one of those requests:
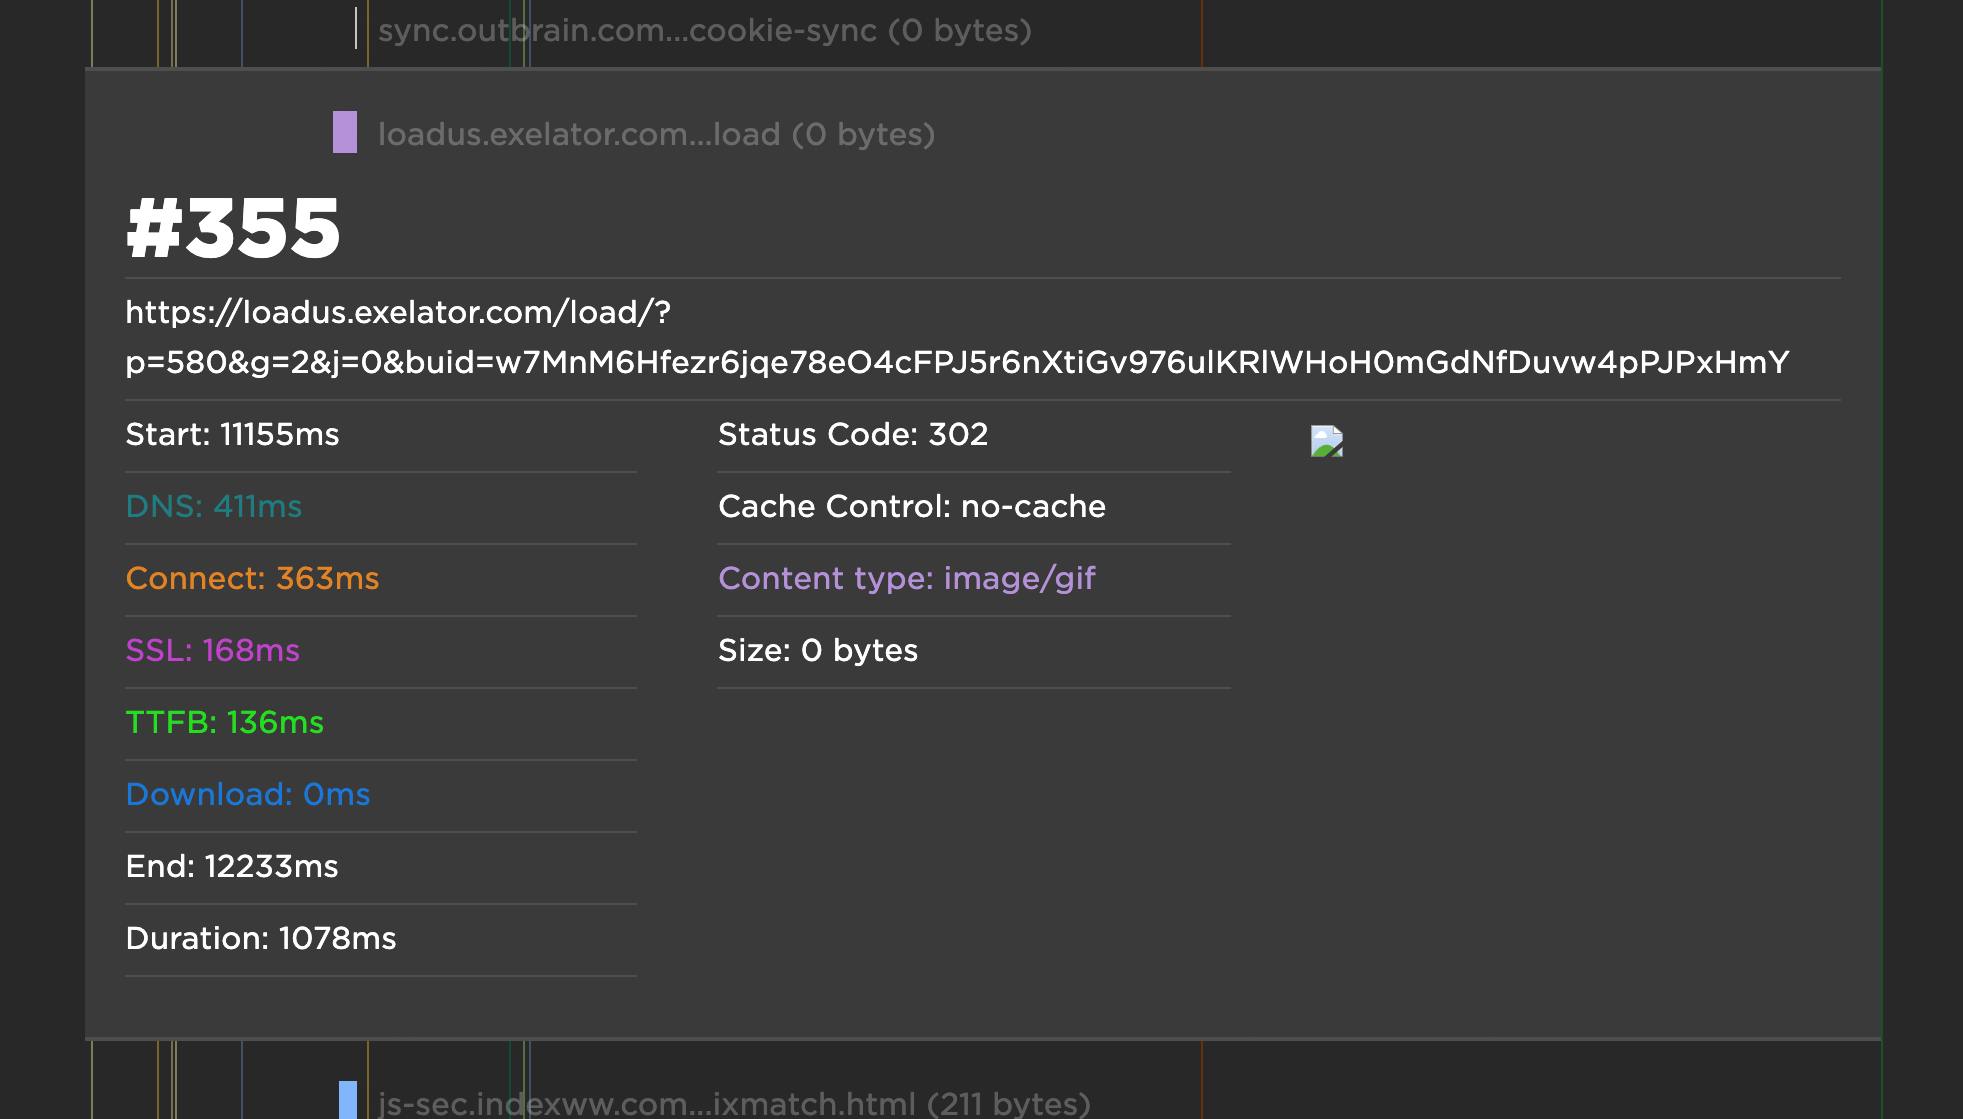
Something that's important to note here is that three out of four of those requests had a size of 0 bytes, and the fourth was only 43 bytes. Keep this in mind next time you ponder adding an allegedly small third-party request to your pages.
That was just one request issue among the many listed above. To drill down further, next steps could include looking at the detailed waterfall charts for each test run – May 11 and May 24 – to see what else is happening before Largest Contentful Paint and Start Render to delay those metrics.
A quick glance at the waterfalls for both tests reveals:
- 40 requests before Start Render fires on the May 11 test
- 64 requests before Start Render fires on the May 24 test
- 105 requests before First Contentful Paint fires on the May 11 test
- 144 requests before First Contentful Paint fires on the May 24 test
I hope I don't have to tell you that those are a LOT of requests. The volume alone is enough to create performance issues. Add to that any episodic issues with serving those requests, and you can see how easily performance can degrade.
We'd love your feedback!
I adore this feature. We've been talking about building this for quite a while – not least because it's been requested by a number of our customers. Take it for a spin and let us know what you think!
Here's Cliff's tutorial, for all you video lovers out there.