Debugging Interaction to Next Paint (INP)

Not surprisingly, most of the conversations I've had with SpeedCurve users over the last few months have focused on improving INP.
INP measures how responsive a page is to visitor interactions. It measures the elapsed time between a tap, a click, or a keypress and the browser next painting to the screen.
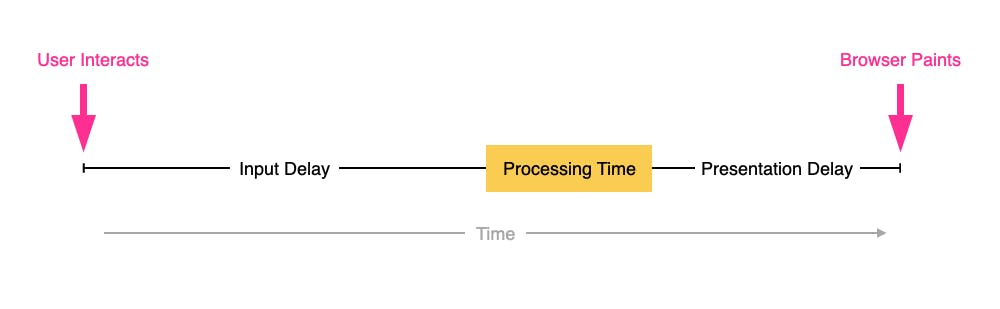
INP breaks down into three sub-parts
- Input Delay – How long the interaction handler has to wait before executing
- Processing Time – How long the interaction handler takes to execute
- Presentation Delay – How long it takes the browser to execute any work it needs to paint updates triggered by the interaction handler
Pages can have multiple interactions, so the INP time you'll see reported by RUM products and other tools, such as Google Search Console and Chrome's UX Report (CrUX), will generally be the worst/highest INP time at the 75th percentile.
Like all Core Web Vitals, INP has a set of thresholds:
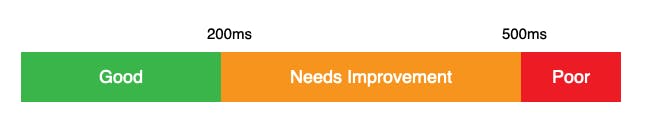
INP thresholds for Good, Needs Improvement, and Poor
Many sites tend to be in the Needs Improvement or Poor categories. My experience over the last few months is that getting to Good is achievable, but it's not always easy.
In this post I'm going to walk through:
- How I help people identify the causes of poor INP times
- Examples of some of the most common issues
- Approaches I've used to help sites improve their INP
Identifying Interactions
The Chrome UX Report (CrUX) can provide a high-level view of INP. Individual pages can be spot checked via the CrUX API or tools such as Page Speed Insights
But as Cliff's already covered in How to find (and fix!) INP interactions on your pages, CrUX is no substitute for having your own RUM data that you can group and filter by dimensions such as the different page and device types.
My favourite place to start is with the Web Vitals heatmap on SpeedCurve's RUM > Performance dashboard. It gives a high-level summary that can be filtered by page label to check if the behavior is consistent across all paths in the group.
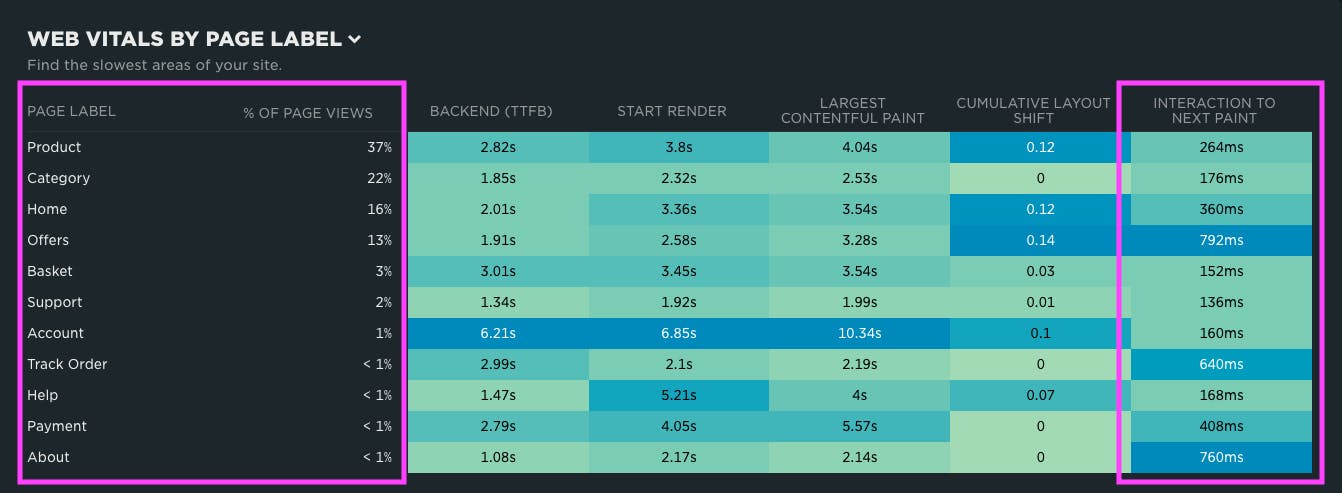
Heatmap of the most popular pages and their Web Vitals metrics
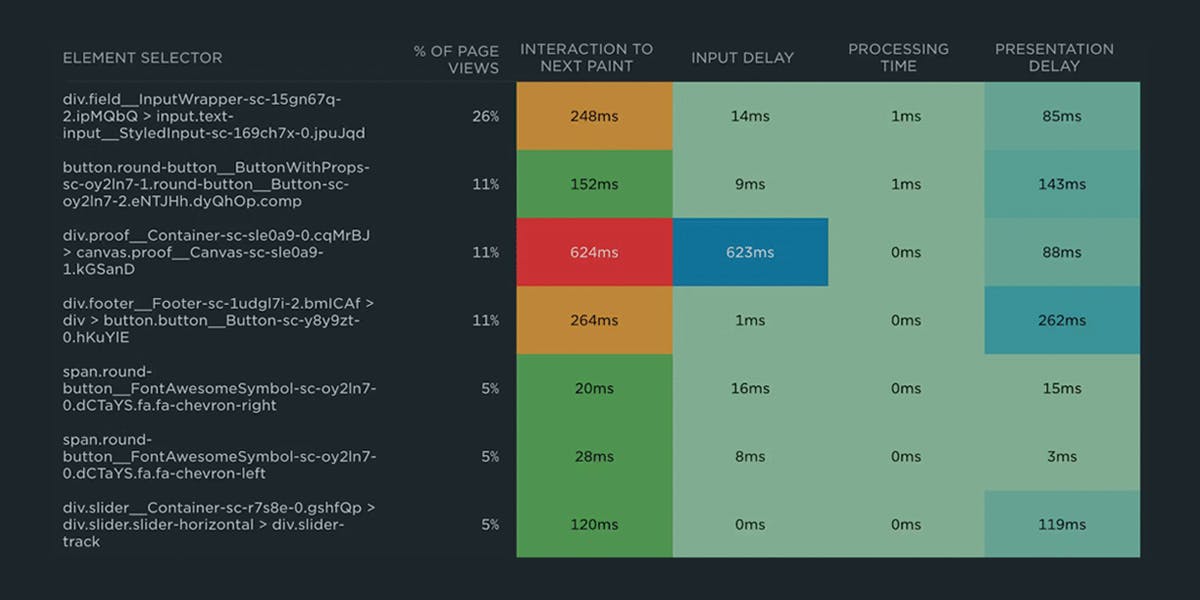
I then typically switch to the RUM > Design dashboard and use the list of popular interaction elements to determine which ones I want to investigate further.
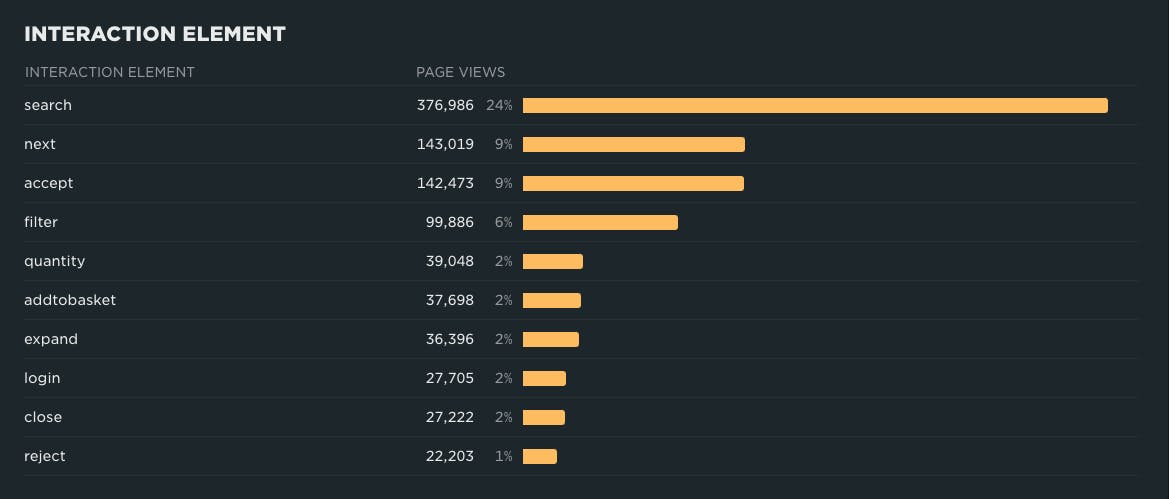
Most popular interactions
Ideally we'd have a view that shows which interactions are responsible for high INP times. (We're currently working on adding full attribution for INP to SpeedCurve.) In the meantime, we've discovered that, in practice, just knowing which page types have high INP times and the interactions visitors are using on those pages is really effective at identifying interactions to investigate further.
Some companies I work with don't have RUM. In those cases, we think about the common interactions visitors are likely to use – dismissing cookie dialogs, opening menus, zooming on product images, etc. – and investigate those further. The caveat here is that it's not as effective as having RUM data to work from and can lead improvements that don't seem to influence INP much.
Profiling Interactions
Once we know which pages have high INP times, and what are the popular interactions on those pages, I switch to Chrome DevTools, profile the interactions, and identify ways to improve them.
The Performance panel can be overwhelming – even for experienced engineers – as it exposes how much work the browser is doing to load pages or handle interactions.
Here is the approach I use when debugging interactions. Although I'm using Chrome Canary in these examples, the same approach works in stable Chrome and other Chromium-based browsers.
1. Switch to a guest user profile
As guest user profiles don't load extensions, they help minimise some of the noise that extensions and other factors can have on performance analysis.
Guest profiles also start with empty caches, empty cookie stores, empty browser storage, etc. These may get populated during testing, but we can clear them at any time via Application > Storage > Clear Site Data in DevTools.
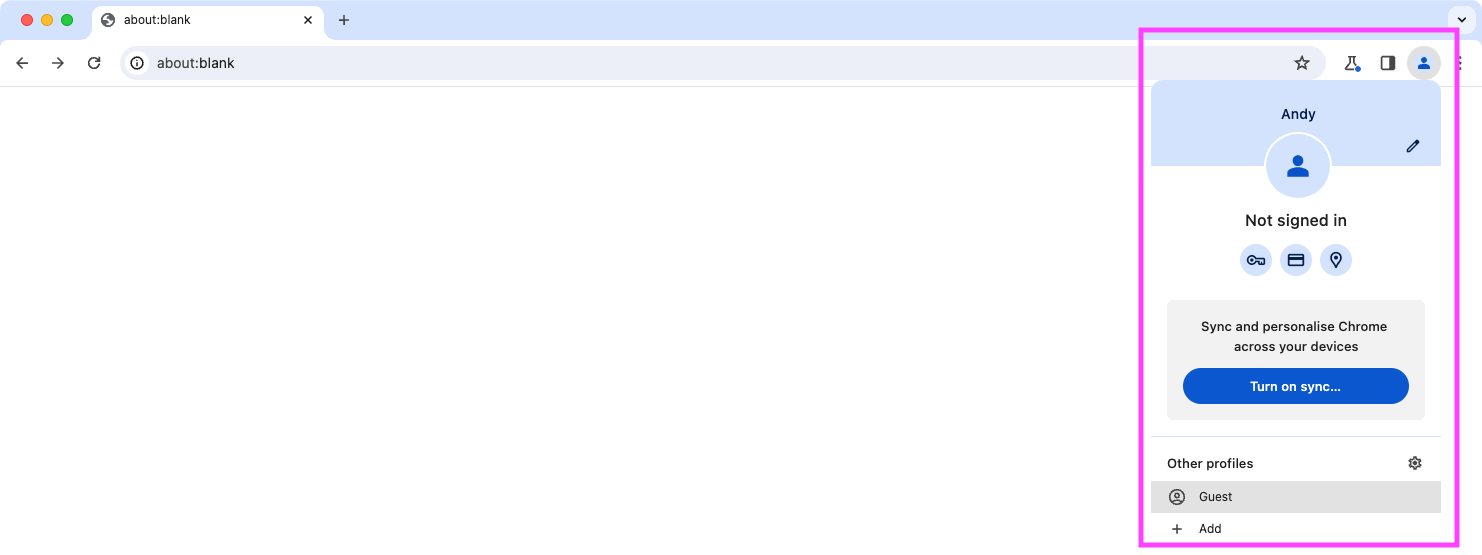
Opening a guest profile in Chrome
2. Open DevTools and switch to the Performance panel
As mobile visitors tend to be the majority of visitors for most sites, I also switch to mobile emulation.
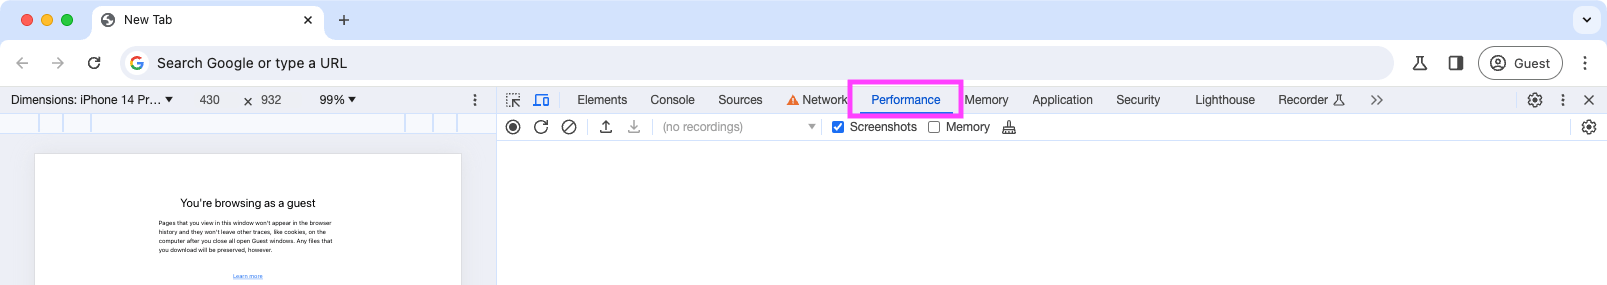
Switching to the DevTools Performance panel
3. Load a page
Load the page you want to investigate. Wait until has finished load before profiling it.
4. Hit 'Record' and interact with the page
After the page has loaded, press the record icon in the DevTools toolbar, wait for the profile to start recording, and then interact with the page.
The profiler starting up often creates a Long Task right at the start of the profile, so I tend to wait a second or so before actually interacting.
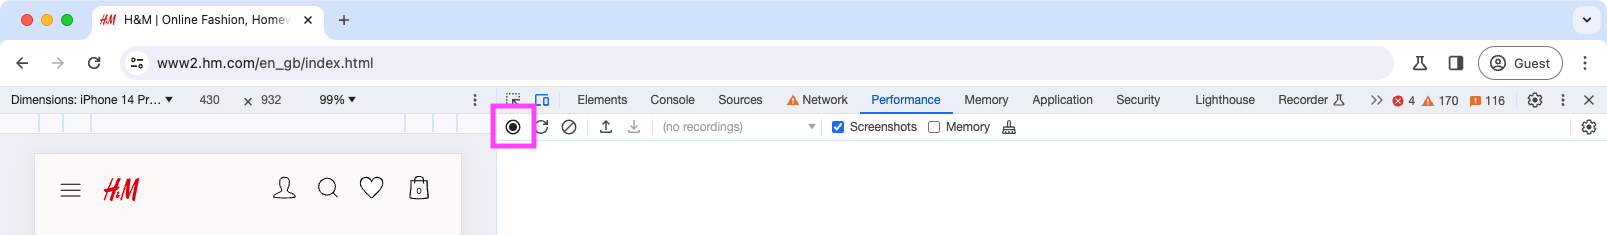
Recording a profile
5. Stop recording
After you've recorded data on the interactions you're interested in, stop recording. After a few moments you should be greeted with a view something like the one below.
In this view I've opened the tracks for Frames, Interactions, and Main Thread so I can see what's visible on the page when I interacted with it as well as the activity that happened on the main thread.
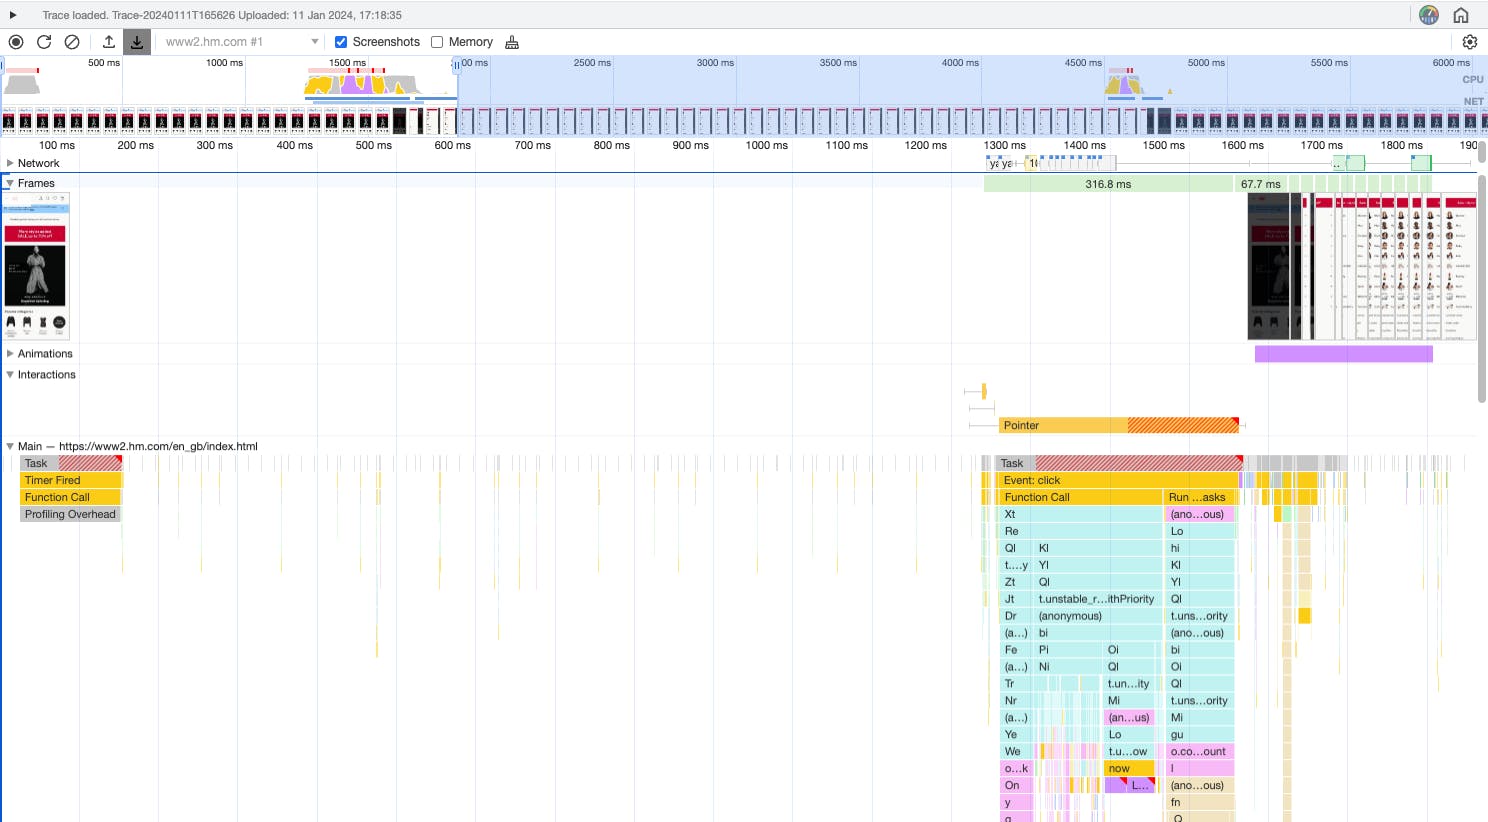
Example performance profile in Chrome DevTools
In the Main Thread track you can see the Profiling Overhead task right at the start of the profile and then a second call stack in response to the interaction.
A quick guide to interpreting this panel:
- The width of each cell in the call stack represents the elapsed time it (and its children) executed.
- The dark yellow, magenta, and green cells represent internal browser work.
- The pastel cells represent the scripts included in the page. (Each script gets its own color.)
Clicking on an individual cell will show more detail in the summary panel at the bottom of the tab (not shown in screenshot). You can zoom in/out and scroll using either the mouse or the W A S D keys.
Analyzing Interactions
After we've captured profiles, we can start analyzing them to understand why we're seeing long INP times, and perhaps more importantly, what we can to do reduce them.
While writing this post, I tested interactions on a few sites and chose three examples that illustrate the common issues I see.
The examples were captured in Chrome Canary on a 2020 i5 MacBook Pro without CPU throttling enabled. If CPU throttling was enabled or the tests were carried out on an actual Android device, then I'd expect the INP times to be higher.
If you want to explore the traces in more detail I've uploaded them to Paul Irish's trace.cafe
Example 1 – Opening the menu on H&M
In this first example, I opened the menu on the mobile version of H&M by clicking on the icon in the top right.
Even though I only clicked on the page once, multiple event handlers were invoked. The one for the menu was the longest and had INP time of 350ms – in other words, 150ms longer than Google's 200ms threshold for 'Good'.
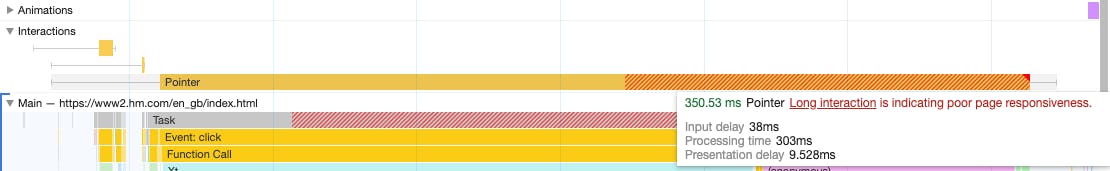
Long interaction when opening the menu on H&M
In this case, most of the time is spent in the actual event handler (Processing Time) for the menu, but there is a slight delay before the event handler can execute.
Examining the flame chart reveals four main groups of processing that happen in response to the interaction:
- Akamai's bot manager is the source of the first two event handlers. These event handlers execute before the one for the menu, so creating the Input Delay for the menu interaction.
- Within the longest event handler, the first group of processing creates an analytics event to record the visitor opening the menu.
- The second group is a JS component that constructs the menu and then adds it to the DOM, triggering style recalculations and layout.
- The last group adds a style element to the DOM, again triggering style recalculations.
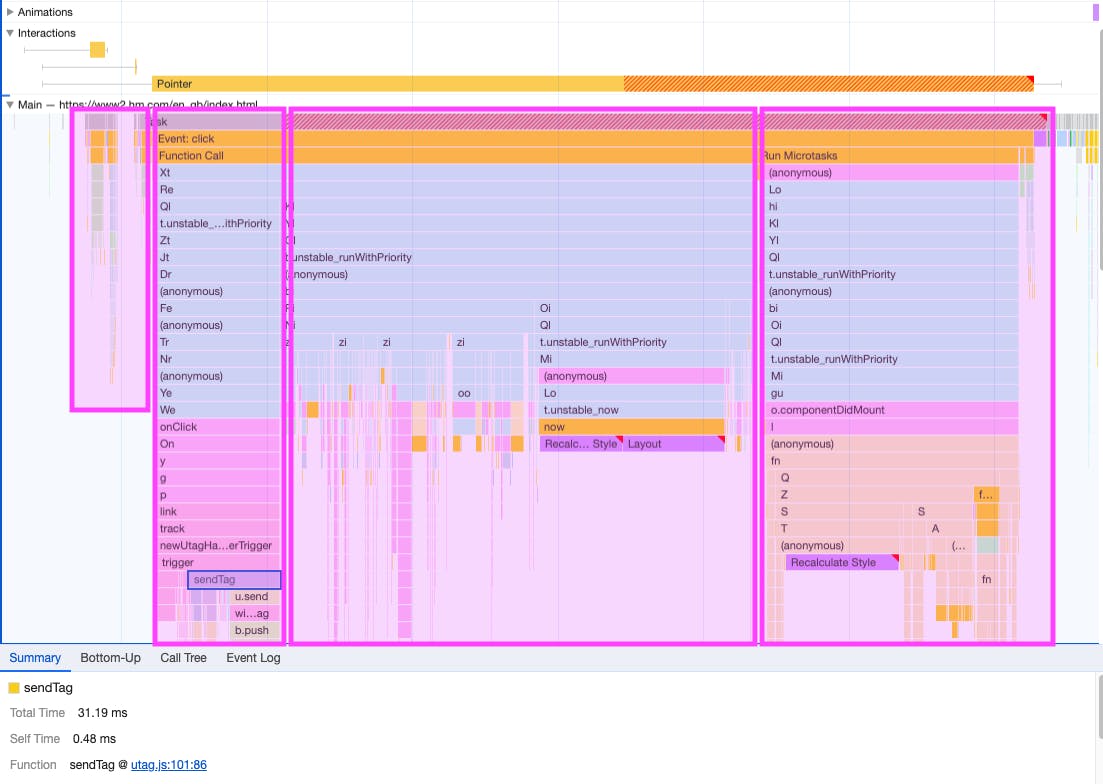
Main thread activity when opening the menu on H&M
Here I'd start by focusing on what's the source of the long Processing Time, asking questions such as:
- Can the menu be rendered without using React?
- Does the stylesheet need to be injected?
- Could the design of the interaction be changed to avoid it?
Example 2 – Opening the menu on John Lewis
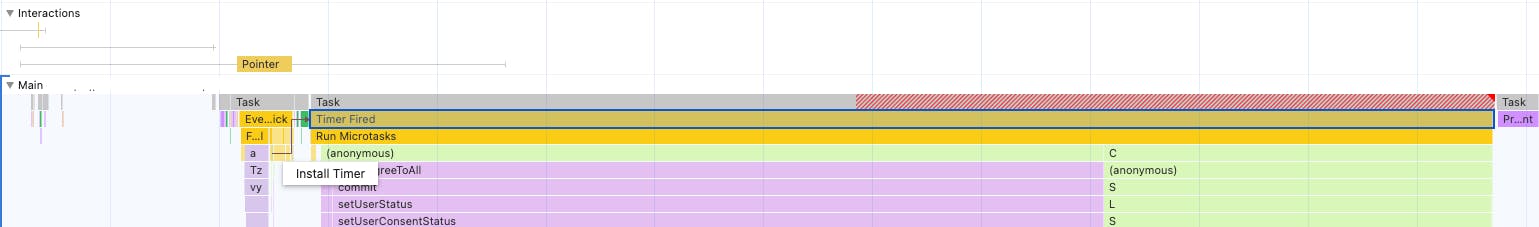
For the second example, I've also chosen to open the menu. The trace for John Lewis shows similar patterns to the one for H&M.
Again there's another event handler that fires before the handler for the menu, but the execution of the both handlers is also delayed by a separate task on the Main Thread. These tasks create a 170ms Input Delay before the interaction handler for the menu executes.
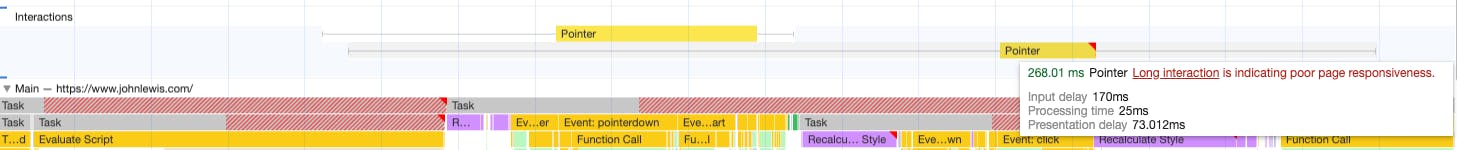
Long interaction when opening the menu on John Lewis
Breaking down the main thread activity shows eight groups of activities that delay the response to the interaction:
- Initial interaction occurs while a Long Task caused by a customer feedback widget is executing.
- Even though feedback widget isn't visible, it triggers a style recalculation and layout.
- A pointerdown event handler within the site's own code executes.
- Akamai's bot manager is listening to pointerdown and touchstart events, and handlers for these events execute.
- Handlers within the site's own code for gotpointercpature, lostpointercapture, pointerup, pointerout and touchend events execute.
- A style recalculation (which I believe is triggered by the bot manager) and a mousedown handler registered by Akamai bot manager execute.
- The menu hander finally executes and generates the DOM for the menu.
- Lastly, a style recalculation triggered by the menu hander executes.
John Lewis uses New Relic. New Relic wraps many of the script calls, and this has some impact on the duration of the tasks. If I were investigating this further, I'd profile with New Relic disabled to measure what impact it's having (if any).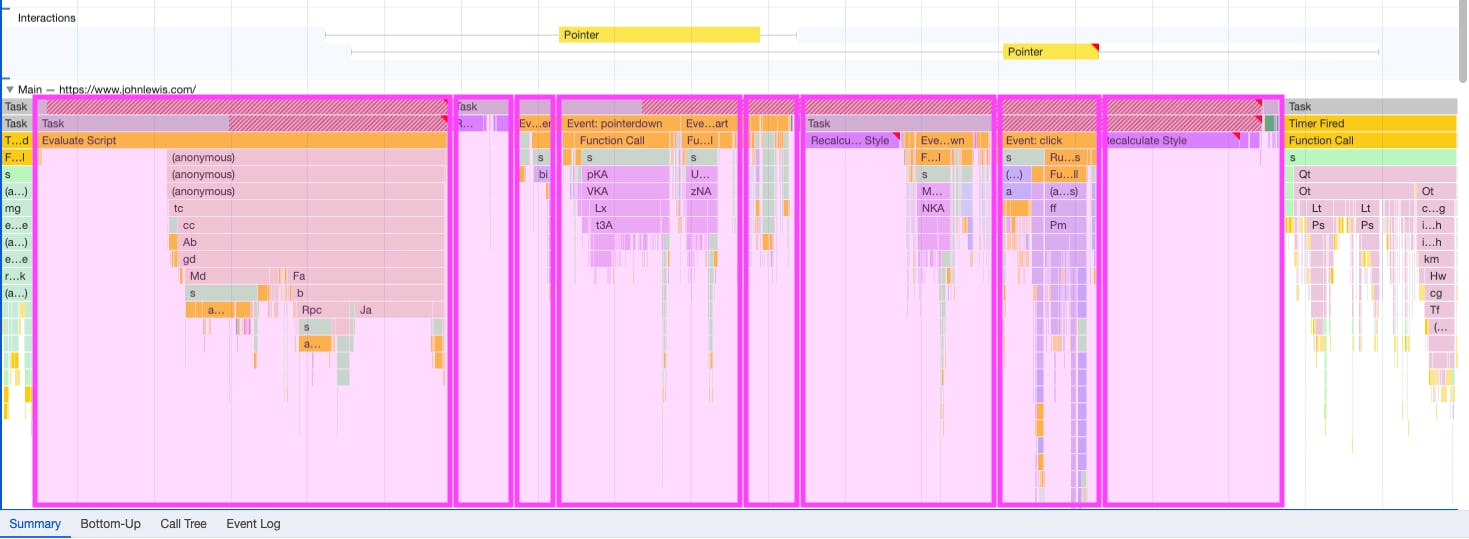
Main thread activity when opening the menu on John Lewis
The main question I'm asking when I see this kind of profile is this:
What can be done to reduce the Input Delay – the Long Task at the start, then focusing in on the intermediate event handlers, and lastly the style and layout calculations?
(In the chart above, the whisker for the Presentation Delay extends into a GTM task, but I believe this is a Chrome issue. You might also notice Chrome Canary doubles up some Long Tasks in the Profile, too.)
> Explore the trace
Example 3 – Accepting the consent dialog on Wales Online
For the last example, I'm closing the consent dialog that all sites in Europe are required to display before they inject third-parties such as ads and analytics into the page.
Here the main issue is the amount of work the event handler is trying to complete in a single task. The Processing Time for the interaction is 382ms
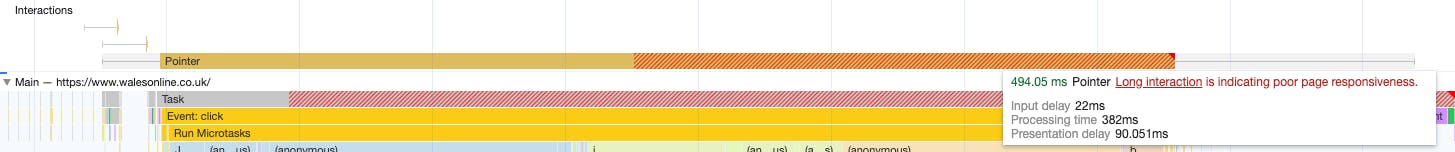
Long interaction when clicking 'accept' on Wales Online
Examining the flame chart reveals six main groups of processing that happen in response to the interaction:
- Closing the dialog is actually pretty quick as it just needs to be removed from the DOM.
- The consent manager starts communicating consent to the ad providers, so they can begin to load.
- Amazon Ads executes.
- Prebid executes.
- A second Prebid component executes .
- A 'Bad Ads reporting tool' adds a stylesheet. After the styles are parsed and recalculated, something forces a layout task.
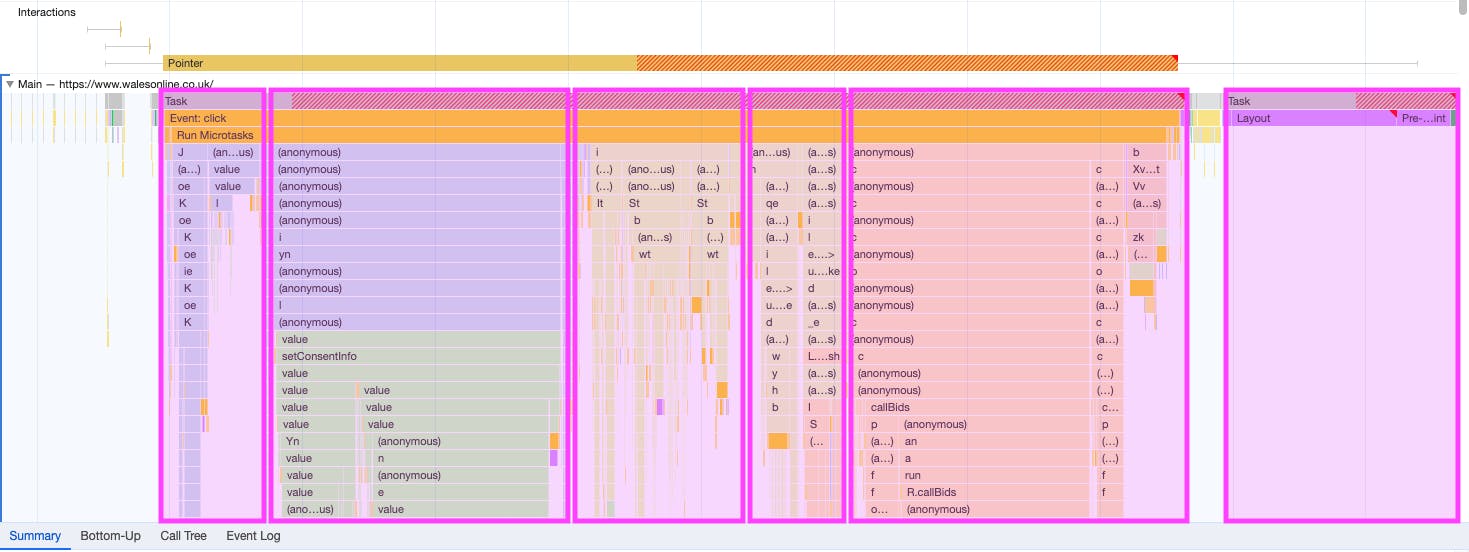
Main thread activity after clicking 'accept' on Wales Online
One thing that's noticeable with the Wales Online example is that the Processing Time is entirely due to third-party scripts. That can limit the options to reduce it, but even then it should be possible to divide the task up.
> Explore the trace
Fixing Interactions
After we've identified why an interaction has a high INP time, our next goal is to reduce it. I find that separating how I think about Input Delay versus Processing Time and Presentation Delay can help.
- Input Delay is due to other tasks blocking the main thread and so delay when the interaction handler can execute. As such, Input Delay is outside an interaction handler's control.
- Processing Time and Presentation Delay are the time the interaction handler takes to execute, and then the time it takes the browser to complete layout, styling, paint, and other tasks created by the event handler.
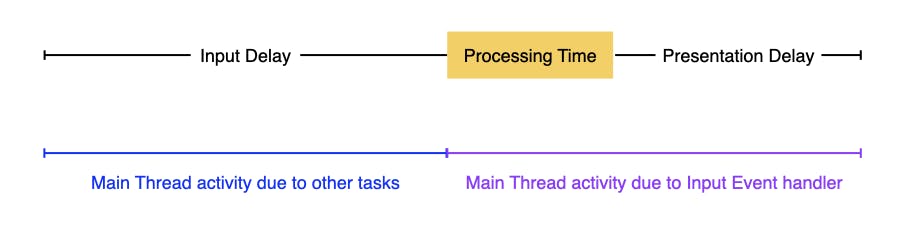
Split between Input Delay, and combined Processing Time and Presentation Delay
As Processing Time and Presentation Delay are easier to identify and fix, I'm going to cover them first before moving on to Input Delay.
How to improve Processing Time and Presentation Delay
When it comes to reducing Processing Time and Presentation Delay, many articles focus on breaking up Long Tasks up or 'yielding to the main thread' with setTimeout, scheduler.yield or requestIdleCallback, etc.
While that is one place to start, it's not the only approach. My view is that reducing the time Long Tasks take to execute is just as important as splitting tasks up.
My other guiding view is to focus on what's most important from a user perspective and optimize that. For example, if the user is opening a menu, then showing them the menu is the most important activity. Anything else that might be triggered by the same action should be secondary.
1. Defer less important activities
Both the H&M and John Lewis menus record an analytics event when someone opens the menu. These calls happen before the menu is actually displayed. (I've seen this pattern on many other sites, too.)
While analytic events are useful to help us understand our visitors' behavior, they're secondary and shouldn't delay the visitors primary goal, in this case opening the menu.
Scheduling these events into a new task via setTimeout (e.g. setTimeout(analytics_fn, 0) or scheduler.postTask for browsers that support it) moves the work out of the interaction handler to be executed later and allows the interaction handler to complete sooner.
The same method can be used with Wales Online's consent manager. After the visitor has clicked 'accept' or 'reject' they want to get on and read the news rather than wait for multiple ad providers to be given permission to load (or not). Scheduling setConsentInfo into a separate task enables the browser to paint the next frame sooner, while the ad providers can carry on loading in the background.
Here's an example of what this looks like in a trace:
Breaking up a click event handler by scheduling work into a separate task
The Long Task was originally part of the click event handler. Using setTimeout to schedule it into its own separate task allows the browser to paint before the Long Task executes. The Long Task might still be a problematic if someone interacts while it's executing, but it's no longer part of the click handler's INP.
I've seen many examples where publishers have improved INP by scheduling the setting of consent into a separate task. I expect consent managers to adopt this approach as a default.
2. Do less work
Ryan Townsend spoke about The Unbearable Weight of Massive JavaScript at performance.now() in November 2023. He shared a case study where they replaced over 50,000 lines of JavaScript with native HTML and CSS features. The result was a faster user experience with more maintainable codebase.
H&M relies on JavaScript components to create the menu elements, add them to the DOM, and apply styles. The result: a processing time of 303ms.
Long interaction when opening the menu on H&M
Let's compare this to another fashion retailer, French Connection. French Connection creates the menu elements when they render the page server-side, and then just changes the elements styles to display the menu. This illustrates the dramatic difference in processing time between the two approaches:
- H&M processing time: 303ms
- French Connection processing time: 22ms (of which nearly half is sending an analytics event to Google Tag Manager!)
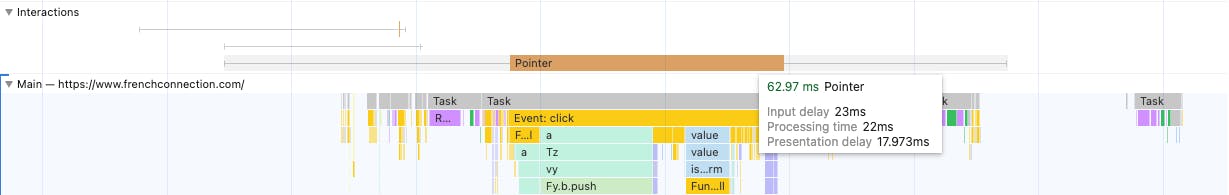
Interaction when opening the menu on French Connection
Of course the French Connection page is going to have more DOM elements. When tools like Lighthouse warn you to "avoid an excessive DOM size", it's tempting to choose other approaches without perhaps fully considering the tradeoffs. Menus often contain large numbers of DOM elements. The choice is whether they're created when the page is initially generated, or at runtime using JavaScript when the menu is requested.
Lighthouse warns about DOM size because it "will increase memory usage, cause longer style calculations, and produce costly layout reflows." But when used carefully, CSS properties like content-visibility, isolation, and will-change can help reduce the cost of a large number of DOM nodes.
Talking of CSS, you might have noticed that in some of the examples above, INP was affected by some long style and layout calculations. These were caused by interaction handlers injecting styles that affected the whole DOM, or by interaction handlers querying style or size properties via methods like getComputedStyle or getBoundingClientRect, so forcing recalculations. (Paul Irish keeps a list of JavaScript methods that typically trigger style and layout calculations.)
Think about the work you're asking the browser to do and whether there are more efficient ways of achieving the end result.
3. Yield to the main thread
Sometimes there isn't work that can be deferred, or the efficiency of interaction handlers can't be improved. In those cases, we just need give control back to the main thread so that it can get on with painting the next frame.
One approach is to use setTimeout wrapped in a Promise:
function yieldToMain() {
return new Promise(resolve => {
setTimeout(resolve,0);
});
}
And then at suitable points in the code insert:
// Yield to the main thread:
await yieldToMain();
setTimeout creates a new task, so enabling the browser's scheduler to take over and process other tasks like input before resuming.
Jeremy Wagner discusses this approach in more detail in his web.dev posts on Optimizing INP and Optimizing Long Tasks. I'd suggest you read those for a deeper view.
The other option to consider for tasks that are hard to optimize is whether the work they're doing can be moved off the main thread via a Web Worker. I've not had the need to use this approach with clients yet.
How to improve Input Delay
Diagnosing the causes of slow Input Delay isn't always easy with just Synthetic monitoring and DevTools. That's because the length of the delay depends on when the visitor interacted with the page and what tasks were executing when the visitor interacted.
The Long Animations Frame (LoAF) API, which is set to ship in Chrome 123, will help RUM tools identify the tasks that caused Input Delay. Once identified, we will be able to profile the tasks in DevTools.
Until LoAF is widely supported, there are profiling approaches in DevTools that can help identify some of the problematic scripts.
1. Investigate other interaction handlers
As the H&M and John Lewis examples demonstrated, other touch, mouse, and keyboard event handlers are also triggered by interactions and can execute before our event handler for the main interaction.
Fortunately these event handlers are captured in the DevTools profile. We can also inspect which event handlers are active using the Event Listeners panel in the right sidebar of the Elements panel in DevTools.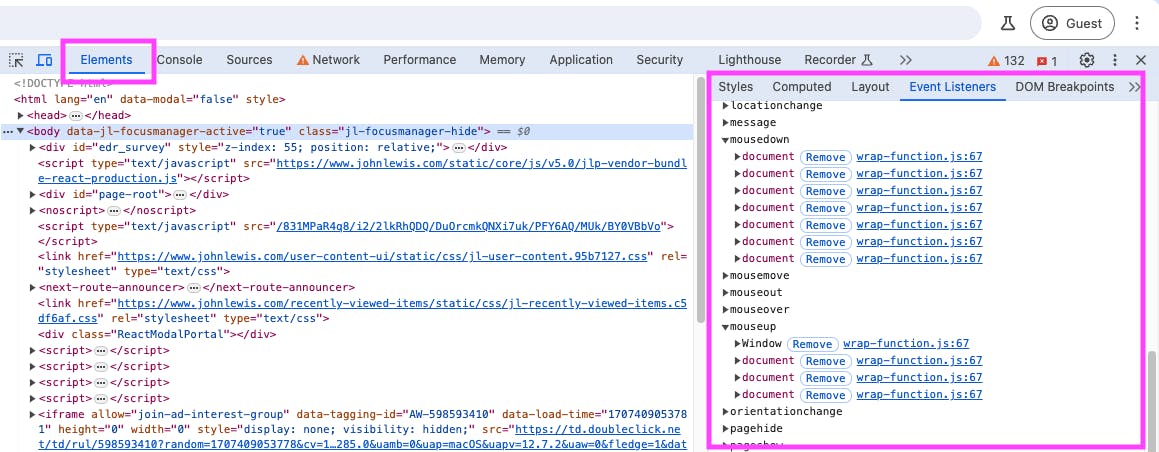
Viewing active event listeners in Chrome DevTools
Some monitoring products, such as New Relic, wrap other scripts calls. This can make identifying the code that's actually going to execute a bit harder. To identify the actual event handler, you can either:
- Block the external instrumentation script
- Use DevTools Content Overrides to create a copy of the page with New Relic, etc., removed
Once we've identified event listeners that are active for click, key, mouse, and tap events, we can review and remove any that aren't really necessary.
If third-party tags are adding their own event handlers, then it's a case of:
- Evaluating the tradeoff between the features the third party provides and its impact on the visitors experience
- Raising the issue with the provider
- Expecting the provider to fix the issue
Some third-party providers are serious about addressing the impact they have on INP. If you're using one that's not, then I'd advocate switching to an alternative.
2. Investigate other Long Tasks
It's harder to identify any other Long Tasks that contribute to Input Delay. It depends on what task is executing when the visitor interacts (this is where LoAF will really help) and how long the task continued executing after the initial interaction.
But we do know there is a relationship between total Long Task Time and INP:
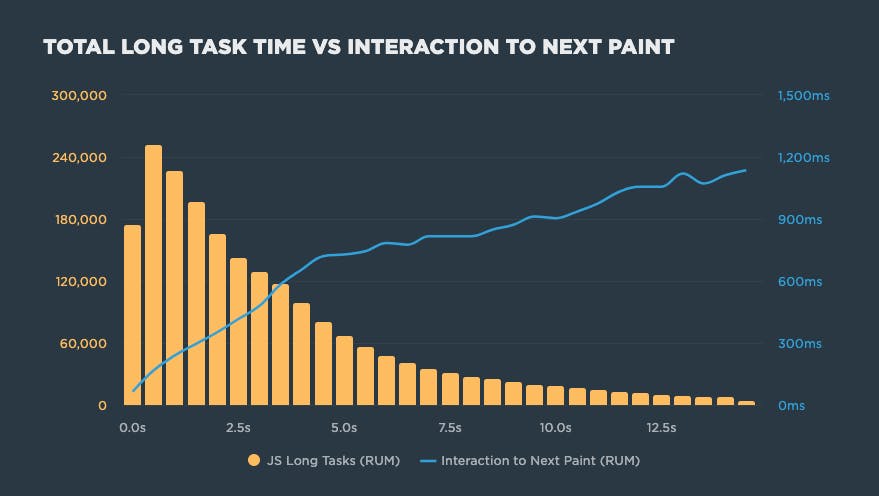
Relationship between Long Tasks and Interaction to Next Paint (INP)
And we also know that visitors start to interact shortly after they start to see content:
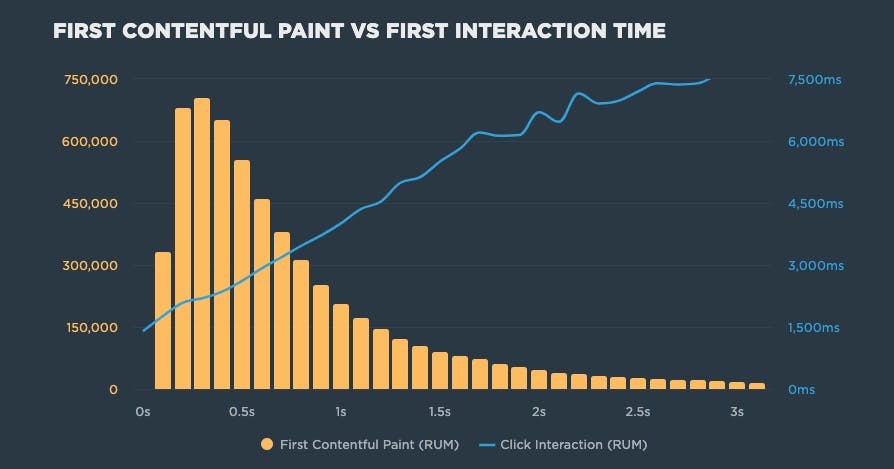
Relationship between First Contentful Paint (FCP) and First Click Interaction
The exact relationships will vary from site to site, but the overall pattern was pretty consistent across the many sites I checked.
Knowing this, we can make an informed guess that any Long Tasks that occur after useful content starts to appear are in danger of contributing to Input Delay.
In John Lewis' case, profiling the page while it loads shows there are a bunch of Long Tasks that happen after 2.2s – notice the gap in the filmstrip – and these are likely to lead to higher INP times if the visitor tries to interact at this point.
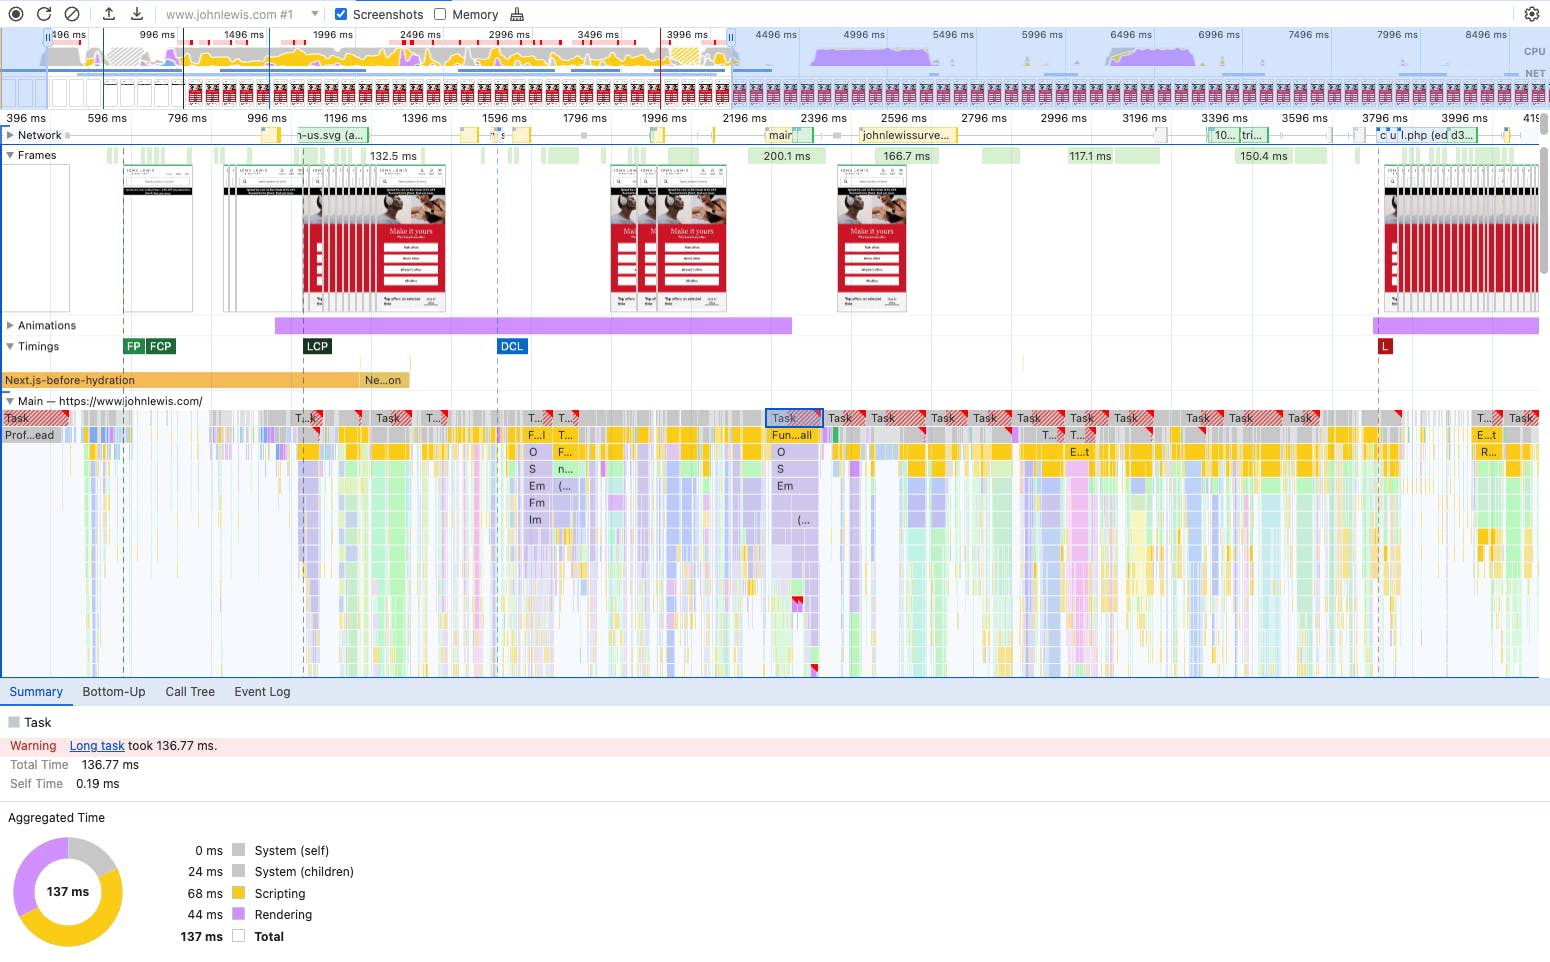
Profile showing Long Tasks during John Lewis home page loading
Some other things you might want to experiment with:
- Profiling a page while it loads and then trying to interact as soon as there's visible content.
- Profiling the acceptance of a cookie consent dialog and then interacting immediately after while third parties might be still starting up.
- If you have tasks that repeat at a regular frequency (e.g. ad refreshes), you can profile what happens if a visitor interacts during those.
As far as optimising these Long Tasks goes, my advice is very similar to optimising slow interaction handlers:
- Defer secondary work into new tasks
- Optimize code so it uses the browser efficiently
- Yield to the main thread appropriately
One thing to watch out for:
There's often a Long Task just before the DOM Content Loaded event. This is because any deferred and module scripts execute as a single – potentially long – task just before DOM Content Loaded. Until browser makers change this behaviour, there's always a potential for this Long Task to create Input Delay if someone interacts at this point.
Wrapping up
Getting to the root of high INP times and fixing them can be quite complex and sometimes overwhelming. It's important to remember that even small incremental changes add up to larger overall improvements.
Some other things to keep in mind...
Use RUM when you can
RUM is great for quickly identifying pages and interactions with high INP times. But even without RUM it's possible to start improving INP. There's just a danger that you might not be profiling the most influential interactions.
When it comes to actually understanding and optimizing INP:
- Profile in a guest window to remove noise caused by extension or previous state
- Identify secondary activities and defer them into separate tasks
- Optimize the primary tasks – lean on the native power of browsers but watch activities that create unnecessary style and layout calculations
- Break remaining Long Tasks up by yielding to the main thread
- Review other interaction handlers to check they're necessary and aren't contributing to Input Delay
It's easy to write a list of actions, but not always easy to implement them
This is especially true if a site is heavily reliant on a JavaScript framework.
Measurement of INP isn't a perfect science
You may come across things that don't quite make sense. I've seen requestAnimationFrame and setTimeout loops delay input handlers. I've also seen JavaScript dialogs really affect INP. As with all Core Web Vitals, it's a work in progress. I expect the Chrome team will address some of these edge cases eventually.
Progress may not be linear
The reported INP measurement represents the worst interaction on the page ,and pages can have many interactions. If the slowest interaction has an INP time of 500ms, and the second slowest has an INP time of 450ms, then fixing the worst interaction will only reduce INP by 50ms!
To borrow the words of Pokémon, you gotta catch 'em all!
If you need some inspiration...
I've been using the techniques from this post to help companies improve their INP time. For one company, we reduced INP by more than 50% in the space of just a couple of weeks.
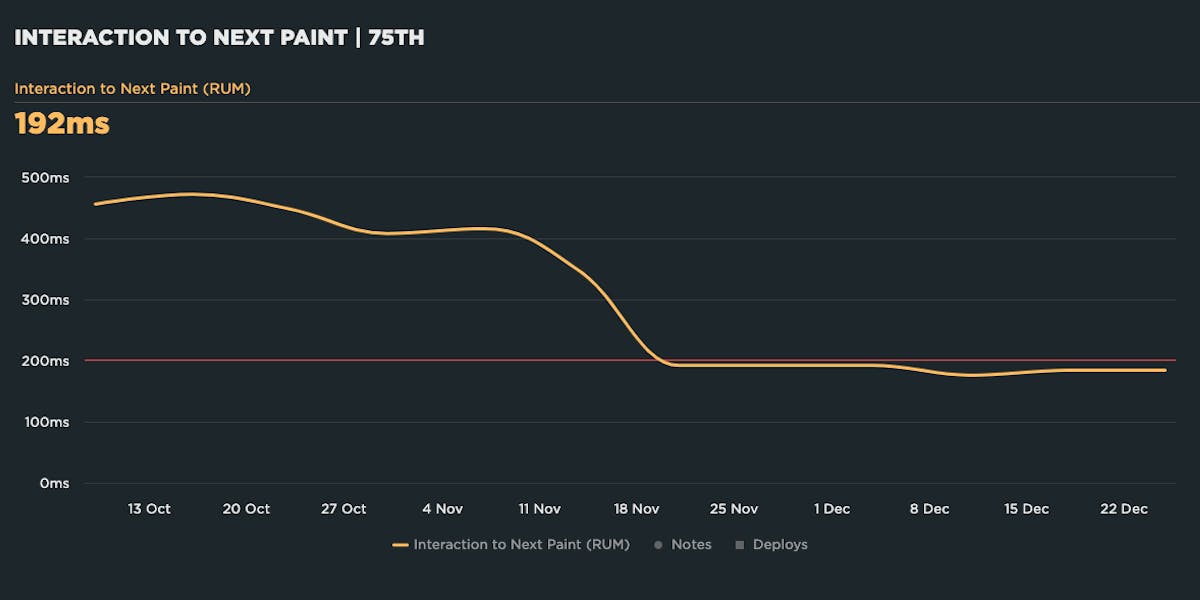
Reduction in INP due to Long Tasks improvements
Need help measuring and fixing INP?
If you'd like to start measuring INP effectively, we offer a free 30-day trial that includes both real user and synthetic monitoring.
We also have some of the most experienced web performance consultants in the world. If you're not sure where to start with INP, or are stuck with what to do next, feel free to get in touch via support@speedcurve.com.