SpeedCurve is now part of the Embrace family! There are no changes to how you use our products. Our founder Mark shares what this means...
NEW! A trickle of updates to your waterfall charts

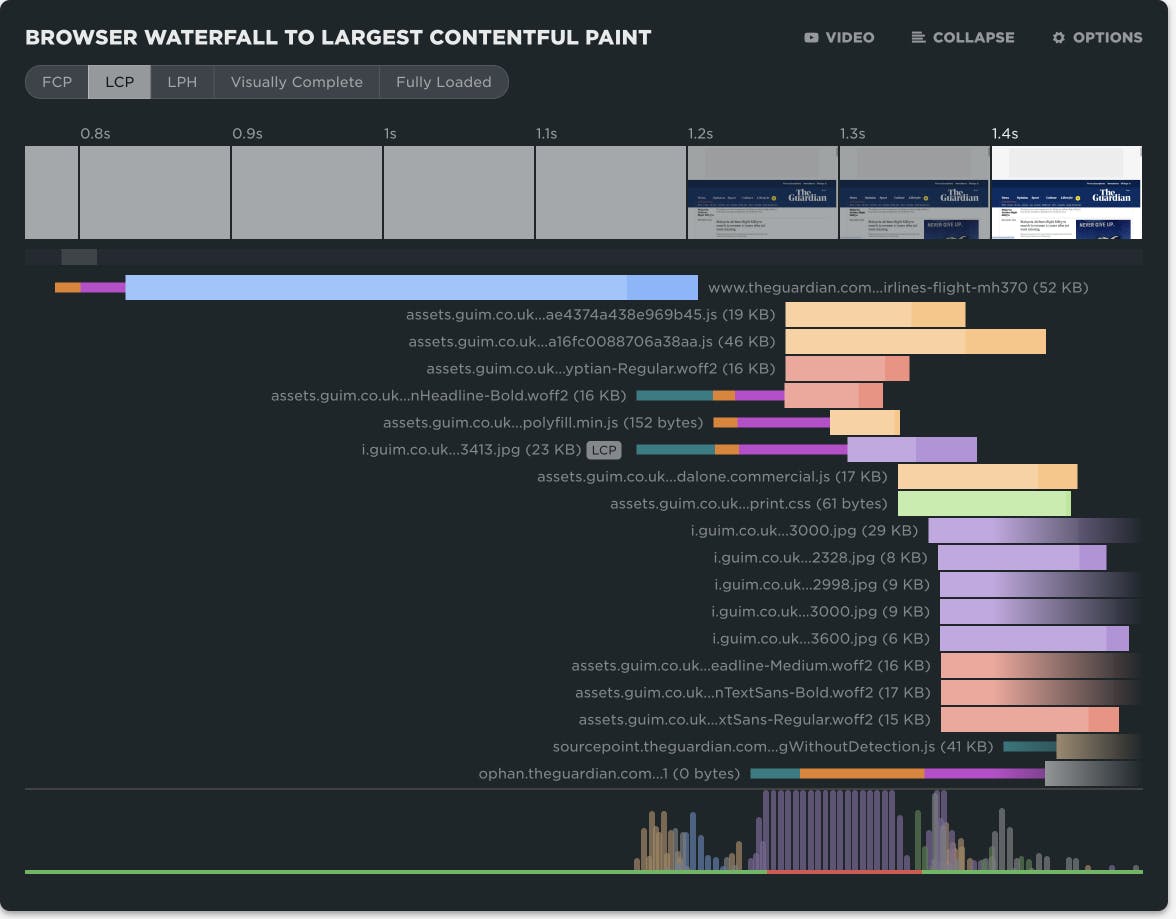
Waterfall charts are the workhorse of any web performance enthusiast. SpeedCurve's interactive waterfall is one of the first components I designed and built more than a decade ago. I've just given our much-loved waterfall chart some team-inspired updates that you may find helpful in understanding how page construction affects important user experience metrics.
At SpeedCurve, we love incremental updates based on both external and internal user feedback. We dogfood our own products, and while consulting with customers, our in-house performance expert Andy Davies is often confronted by the gulf between a customers questions and how he might answer those questions using the data we collect and the visulizations we wrap around it.
It's not always easy. Making data visible doesn't automatically mean it's useful in answering questions about the intersection of web performance and user behaviour.
Three years ago Andy asked me for a feature in the waterfall chart. I added it straight away, and to this day Andy has never discovered or used the feature!
"Wait, you can do that?" ~ Andy
If Andy uses SpeedCurve everyday, knows it inside out, and still can't stumble across a three-year-old feature, that's not Andy's problem. That's a problem with complexity in the user interface and feature discoverability. It's a common problem as software matures and features get layered on top of each other. What started out simple and easy to explore becomes complex and hidden behind a myriad of options.
Today I'm taking a crack at removing some options in the waterfall to reduce complexity and choice while exposing better defaults.
I'm hoping Andy sees the changes this time around and it helps answer more of his questions...
NEW! Synthetic test agent updates: Chrome, Firefox and Lighthouse


This month, we've made some updates to our synthetic testing agents. In addition to upgrading the underlying operating system, we've added support for:
- Lighthouse 12.3.0 (previously 10.4.0)
- Chrome 133 (previously 126)
- Firefox 135 (previously 128)
NEW! Chrome Beta and Canary support & LCP element highlighting

Phew! Between the fast-paced release cycle for Chrome and the rapid evolution of Core Web Vitals, the month of May has been a busy one here at SpeedCurve. With that, we are excited to bring you some new features and enhancements to help you stay focused and ahead of the game as we move into summer.
Read on to learn more about:
- Chrome Beta and Canary support
- Largest Contentful Paint (LCP) element highlighting
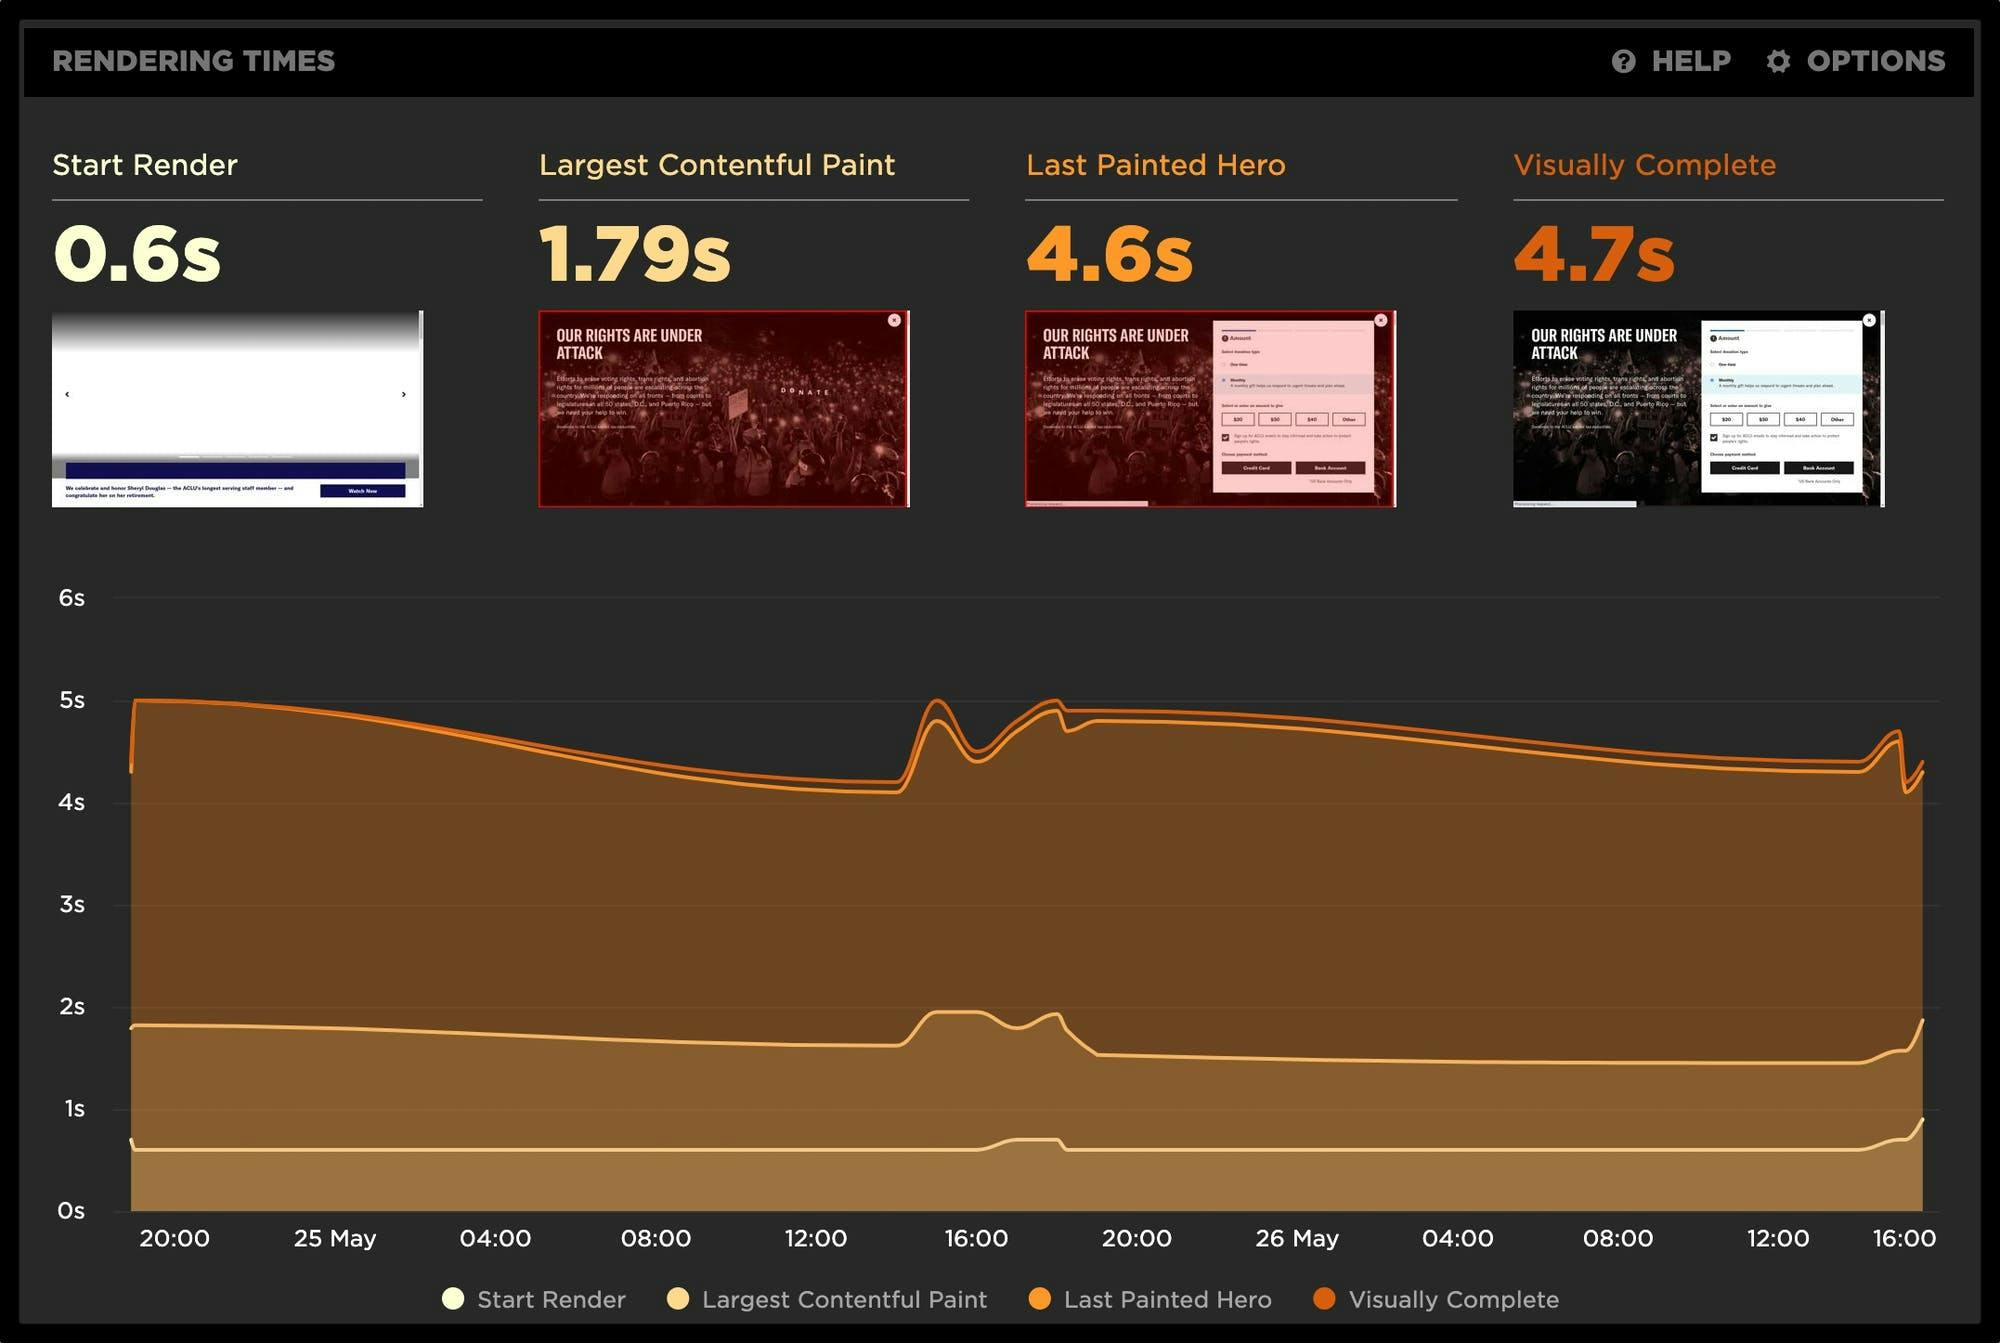
- Key rendering times
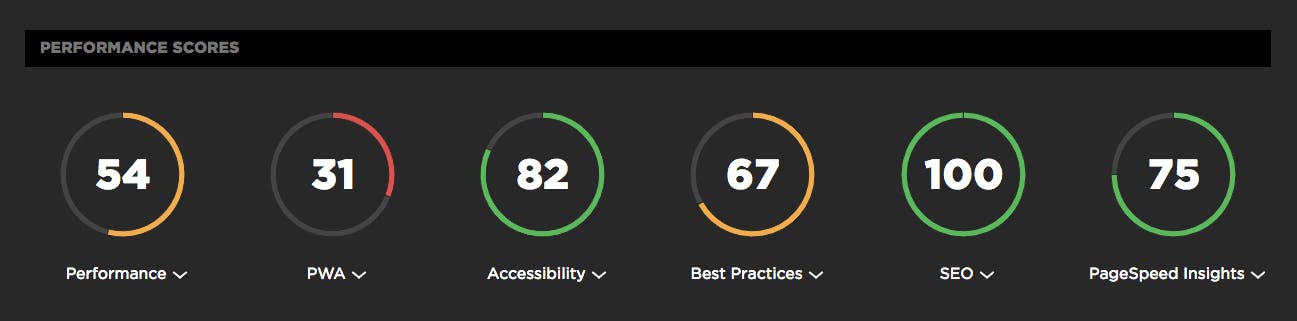
Lighthouse scores now available in your test results

In the year since Google rolled out Lighthouse, it's safe to say that "Will you be adding Lighthouse scoring?" is one the most common questions we've fielded here at SpeedCurve HQ. And since Google cranked up the pressure on sites to deliver better mobile performance (or suffer the SEO consequences) earlier this month, we've been getting that question even more often.
We take a rigorous approach to adding new metrics. We think the best solution is always to give you the right data, not just more data. So we're very happy to announce that after much analysis and consideration, we've added Lighthouse scores to SpeedCurve. Here's why – as well as how you can see your scores if you're already a SpeedCurve user.