SpeedCurve is now part of the Embrace family! There are no changes to how you use our products. Our founder Mark shares what this means...
ICYMI: Some of our most exciting product updates of 2024!

Every year feels like a big year here at SpeedCurve, and 2024 was no exception. Here's a recap of product highlights designed to make your performance monitoring even better and easier!

Our biggest achievements this year have centred on making it easier for you to:
- Gather more meaningful real user monitoring (RUM) data
- Get actionable insights from Core Web Vitals
- Simplify your synthetic testing
- Get expert performance coaching when and how you need it
Keep reading to learn more...
Performance Hero: Pat Meenan
This month, we celebrate everything that OG performance hero Pat Meenan has done – and continues to do – for the web performance community.

When we started the Performance Hero series earlier this year, we had an idea of the types of folks in our community we wanted to acknowledge:
- People who are making a difference in web performance
- People who are humble
- People who give without expectation
- People who don't necessarily crave the spotlight
When looking at these attributes – for a lot of us who have been around this space for more years than we care to mention – it's hard not to think about everyone's favorite web performance OG: Pat Meenan. This month, we celebrate all that Pat has done and continues to do for web performance.
A Holiday Wish: Core Web Vitals in Safari
Did you know that key performance metrics – like Core Web Vitals – aren't supported in Safari? If that's news to you, you're not alone! Here's why that is... and what we and the rest of the web performance community are doing to fix it.

Somebody pinch me. Seeing this post and the resulting thread gives me great hope.
Nicole Sullivan (aka Stubbornella, WebKit Engineering Manager at Apple, and OG web performance evangelist) isn't making promises or dangling a carrot. Nonetheless, it's evidence of the willingness for some public discussion on a topic that's been exhaustively discussed in our community for years. Nicole's post has gotten some great responses from many leaders in our community, hopefully shaping a strong use case for future WebKit support for Core Web Vitals.
(If you're new to performance, Core Web Vitals is a set of three metrics – Largest Contentful Paint, Cumulative Layout Shift, and Interaction to Next Paint – that are intended to measure the rendering speed, interactivity, and visual stability of web pages.)
In this post, I'm going to highlight some of the discussion around the topic of Core Web Vitals and Safari, which was a major theme coming out of the recent web performance marathon in Amsterdam that included WebPerf Days, performance.sync(), and the main event, performance.now().
NEW: Vitals dashboard updates and filter improvements
Our development team recently emerged from an offsite with two wonderful improvements to SpeedCurve. The team tackled a project to unify our filtering, and then they over-delivered with a re-Vital-ized dashboard that I'm finding to be one of the most useful views in the product.
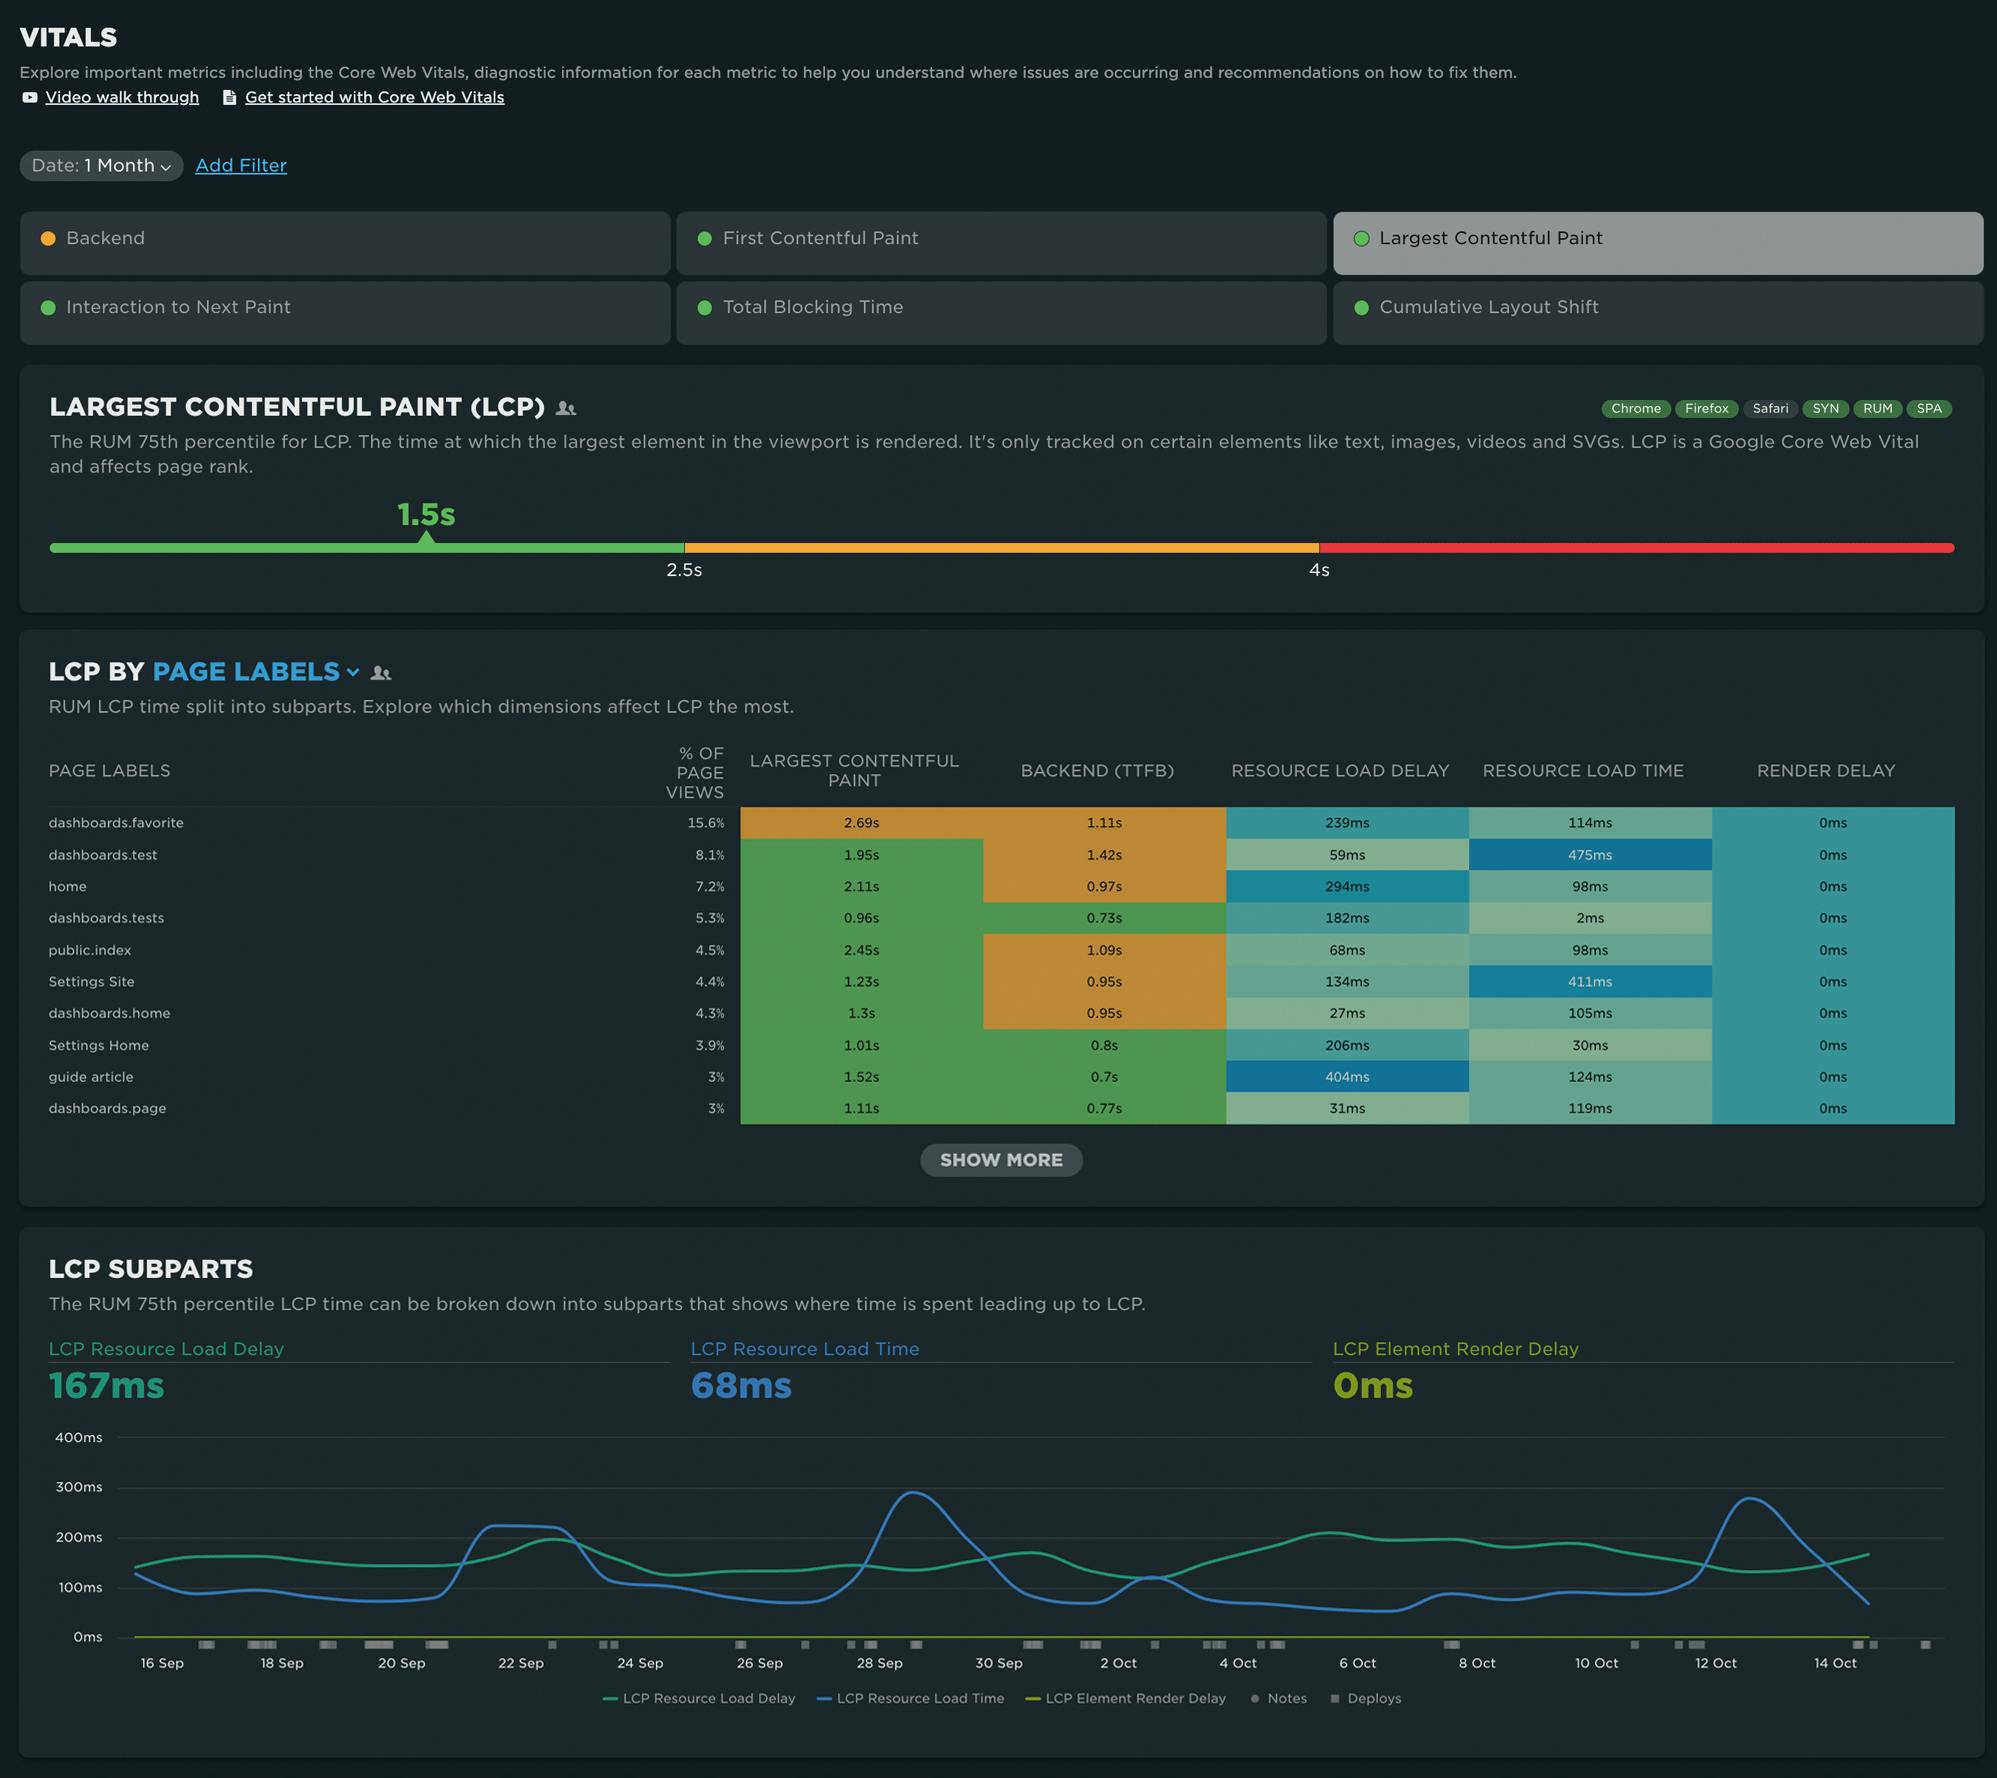
Take a look at the recent updates – and a big thank you to our amazing team for putting so much love into SpeedCurve!
Performance Hero: Sia Karamalegos
Sia Karamalegos is a web performance diva we've come to know through her many articles, workshops, conference talks, and her stint as an MC at performance.now() last year – not to mention her role in speeding up a pretty big slice of the internet!

Sia is kind, funny, smart as heck, and always down to talk web performance (especially if you have a Shopify site). For those reasons and many more, we are excited to share that Sia is this month's Performance Hero!
How to provide better attribution for your RUM metrics

Here's a detailed walkthrough showing how to make more meaningful and intuitive attributions for your RUM metrics – which makes it much easier for you to zero in on your performance issues.
Real user monitoring (RUM) has always been incredibly important for any organization focused on performance. RUM – also known as field testing – captures performance metrics as real users browse your website and helps you understand how actual users experience your site. But it’s only in the last few years that RUM data has started to become more actionable, allowing you to diagnose what is making your pages slower or less usable for your visitors.
Making newer RUM metrics – such as Core Web Vitals – more actionable has been a significant priority for standards bodies. A big part of this shift has been better attribution, so we can tell what's actually going on when RUM metrics change.
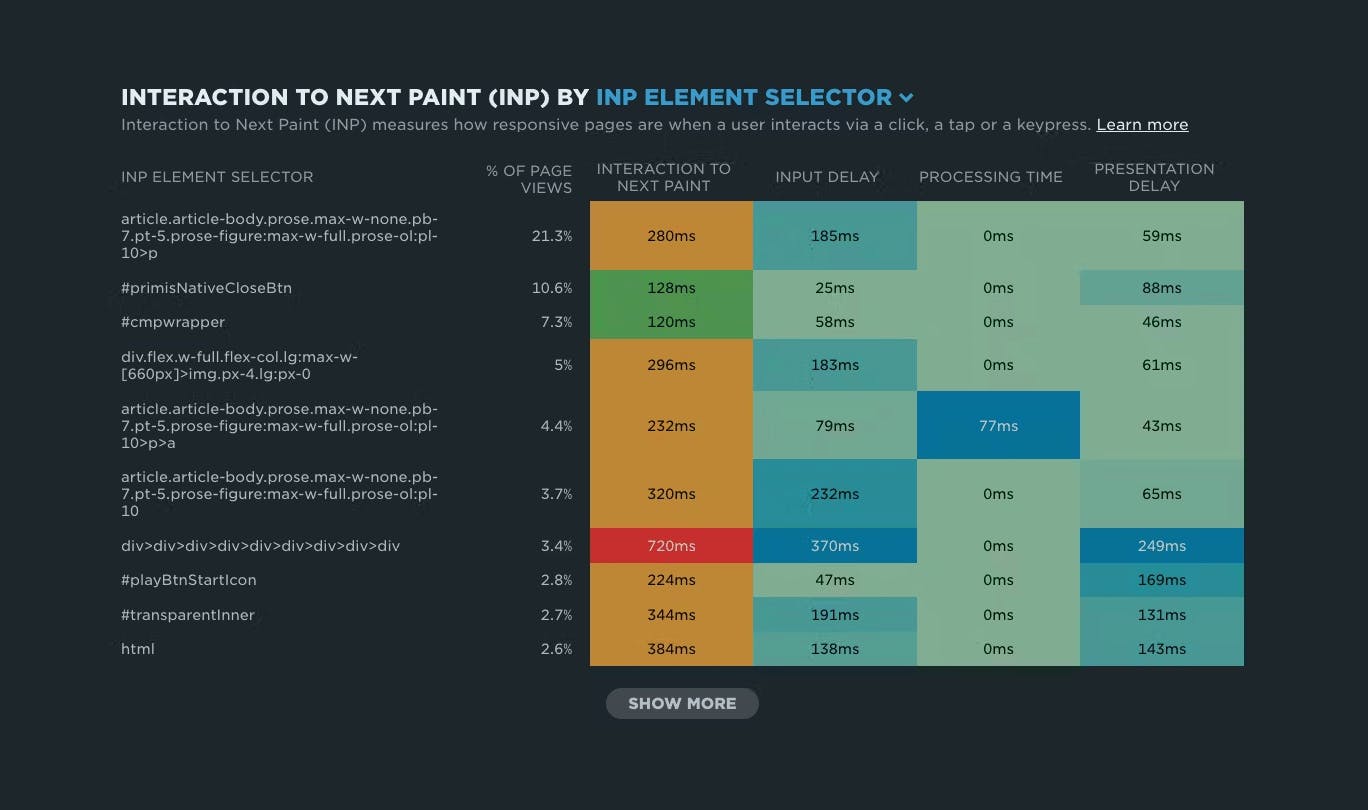
Core Web Vitals metrics – like Largest Contentful Paint (LCP), Interaction to Next Paint (INP), and Cumulative Layout Shift (CLS) – all have some level of attribution associated with them, which helps you identify what exactly is triggering the metric. The LoAF API is all about attribution, helping you zero in on which scripts are causing issues.
Having this attribution available, particularly when paired with meaningful subparts, can help us to quickly identify which specific components we should prioritize in our optimization work.
We can help make this attribution even more valuable by ensuring that key components in our page have meaningful, semantic attributes attached to them.
NEW: Paper cuts update!
Paper cut: (literal) A wound caused by a piece of paper or any thin, sharp material that can slice through skin. (figurative) A trivial-seeming problem that causes a surprising amount of pain.

We all love big showy features, and this year we've released our share of those. But sometimes it's the small stuff that can make a big difference. We recently took a look at our backlog of smaller requests from our customers – which we labelled "paper cuts" – and decided to dedicate time to tackle them.
Are they all glamorous changes? Maybe not, though some are pretty exciting.
Are they worthy of a press release? Ha! We don't even know how to issue a press release.
Will they make your day better and put a smile on your face? We sure hope so.
In total, our wonderful development team tackled more than 30 paper cuts! These include:
- Exciting new chart types for Core Web Vitals and User Happiness
- Filter RUM data by region
- Create a set of tests for one or multiple sites or custom URLs
- Test directly from your site settings when saving changes
- Usability improvements
- Better messaging for test failures
- And more!
Keep scrolling for an overview of some of the highlights.
NEW: Improving how we collect RUM data

We've made improvements to how we collect RUM data. Most SpeedCurve users won't see significant changes to Core Web Vitals or other metrics, but for a small number of users some metrics may increase.

This post covers:
- What the changes are
- How the changes can affect Core Web Vitals and other metrics
- Why we are making the changes now
15 page speed optimizations that sites ignore (at their own risk)

A recent analysis of twenty leading websites found a surprising number of page speed optimizations that sites are not taking advantage of – to the detriment of their performance metrics, and more importantly, to the detriment of their users and ultimately their business.

I spend a lot of time looking at waterfall charts and web performance audits. I recently investigated the test results for twenty top sites and discovered that many of them are not taking advantage of optimizations – including some fairly easy low-hanging fruit – that could make their pages faster, their users happier, and their businesses more successful.
More on this below, but first, a few important reminders about the impact of page speed on businesses...
Performance Hero: Michelle Vu
Michelle Vu is one of the most knowledgeable, helpful, kind people you could ever hope to meet. As a founding member of Pinterest's performance team, she has created an incredibly strong culture of performance throughout Pinterest. She's also pioneered important custom metrics and practices, like Pinner Wait Time and performance budgets. We are super excited to share that Michelle is this month's Performance Hero!

Michelle is a web performance industry veteran who has spent the last seven years making Pinterest fast and reliable. She was a founding member of Pinterest's performance team, establishing foundations of their program by setting up its synthetic and real user metrics, proactive alerts, and performance analysis tools, while fostering a culture of performance across teams.
