Performance audit: Lego.com


I love LEGO. My kids love LEGO, too, which means that every year I find myself spending a fair bit of time on the LEGO website during the holidays. So I thought it would be fun to spend some time poking around behind the scenes and give the site a holiday performance audit. Keep reading to find out what I learned, and some lessons you may want to apply to your own pages.
Background
For this performance audit, I looked at this synthetic test for the LEGO.com home page.
(We track LEGO.com, along with a handful of other leading ecommerce sites, in our public-facing Retail Benchmarks dashboard, which I encourage you to check out. You can drill down into the test details for each site and learn how the fastest sites stay fast.)
You can see in this recent snapshot of the leaderboard (which changes daily) that the LEGO home page is at the bottom of the ranking for Largest Contentful Paint (LCP). LCP measures when the largest visual element in the viewport – typically a hero image or video – finishes rendering.
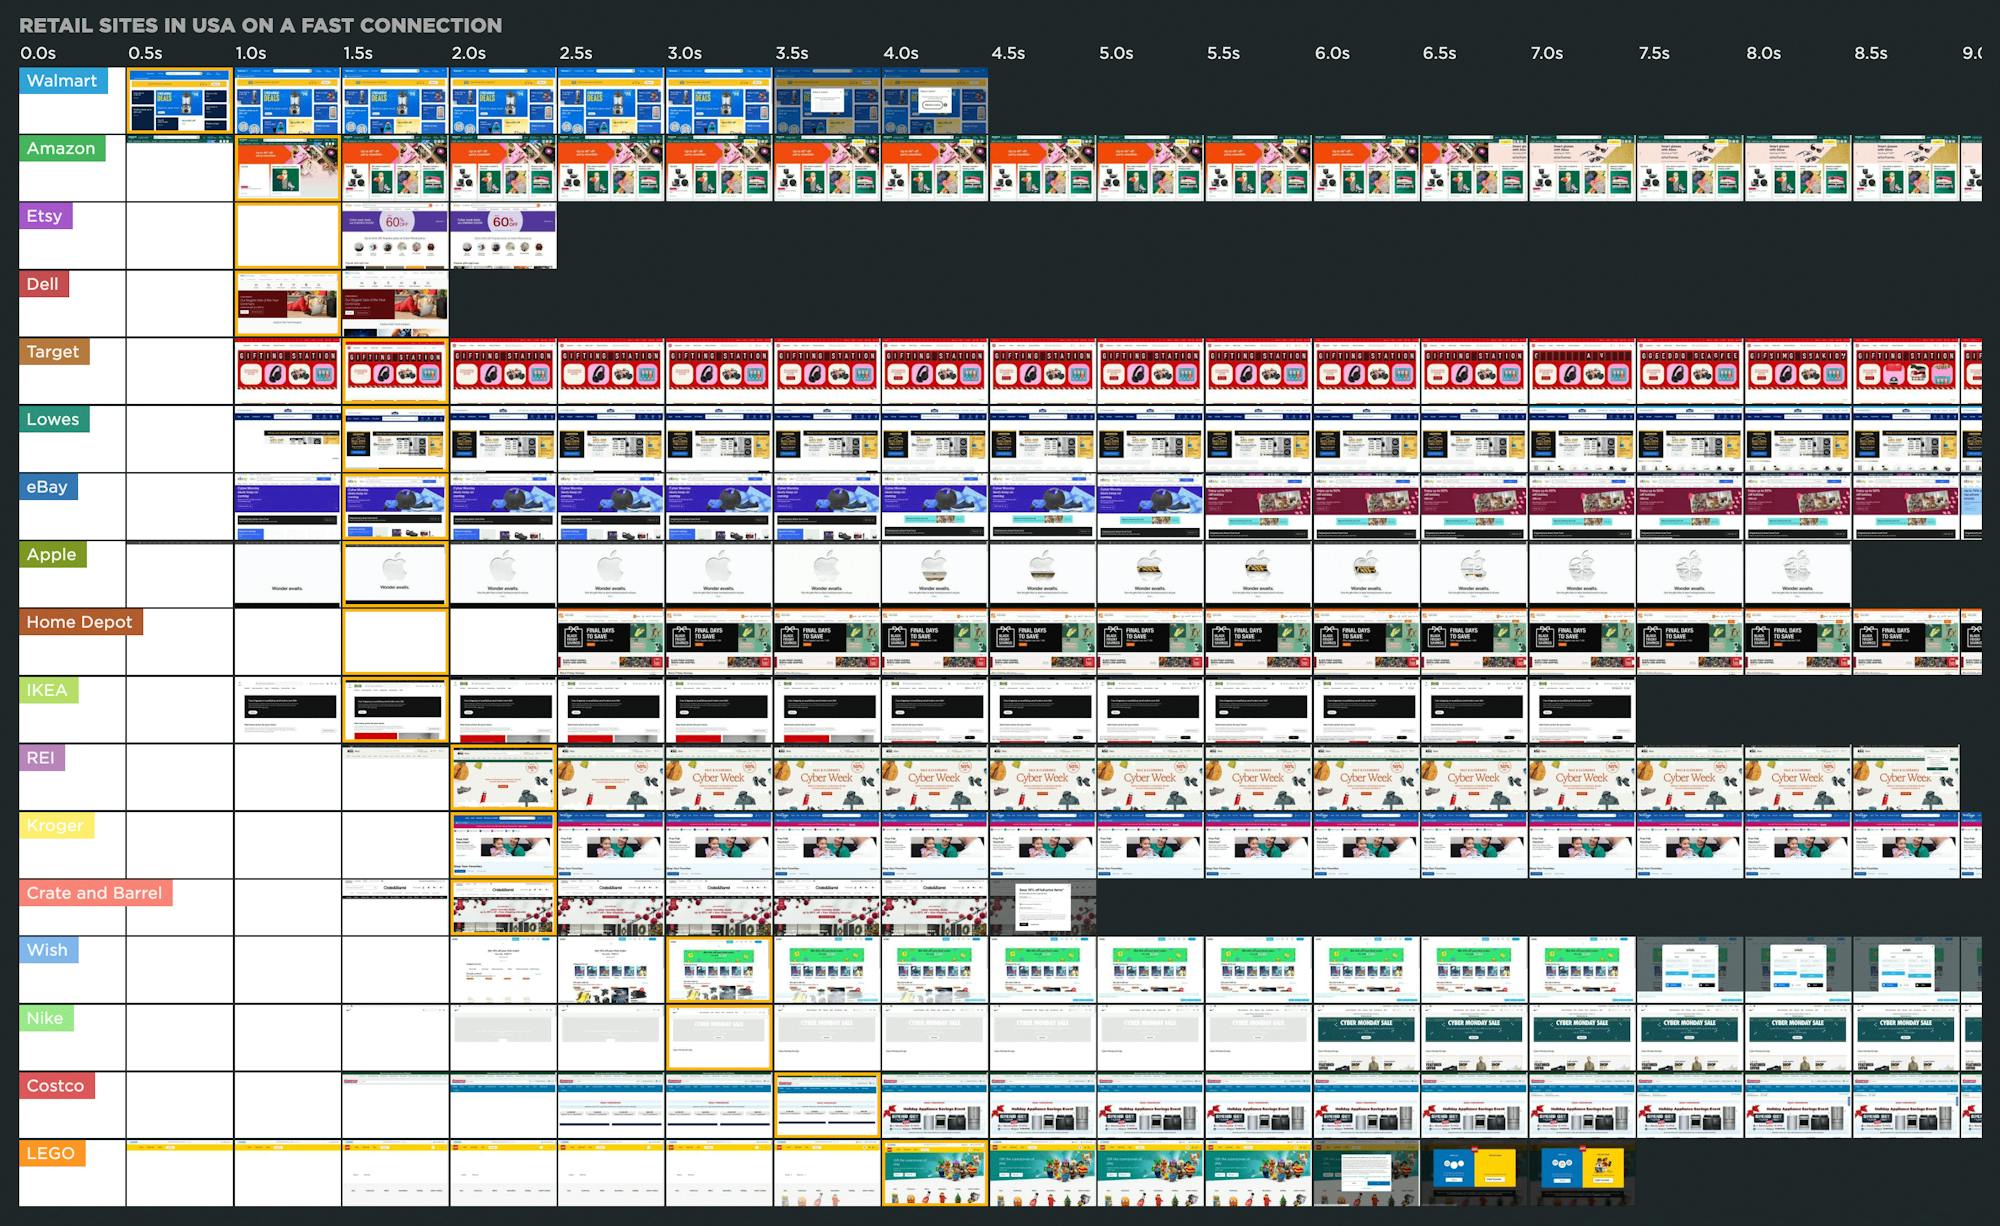
A couple of things worth noting:
- All of the sites in the leaderboard sites are pretty speedy, so this is NOT a name-and-shame exercise.
- The LEGO page actually starts to load visual content FASTER than most of the other pages.
So the question that demands an answer is this: If the LEGO home page appears to start rendering early, why is it at the bottom of the LCP leaderboard?
Let's dig deeper.
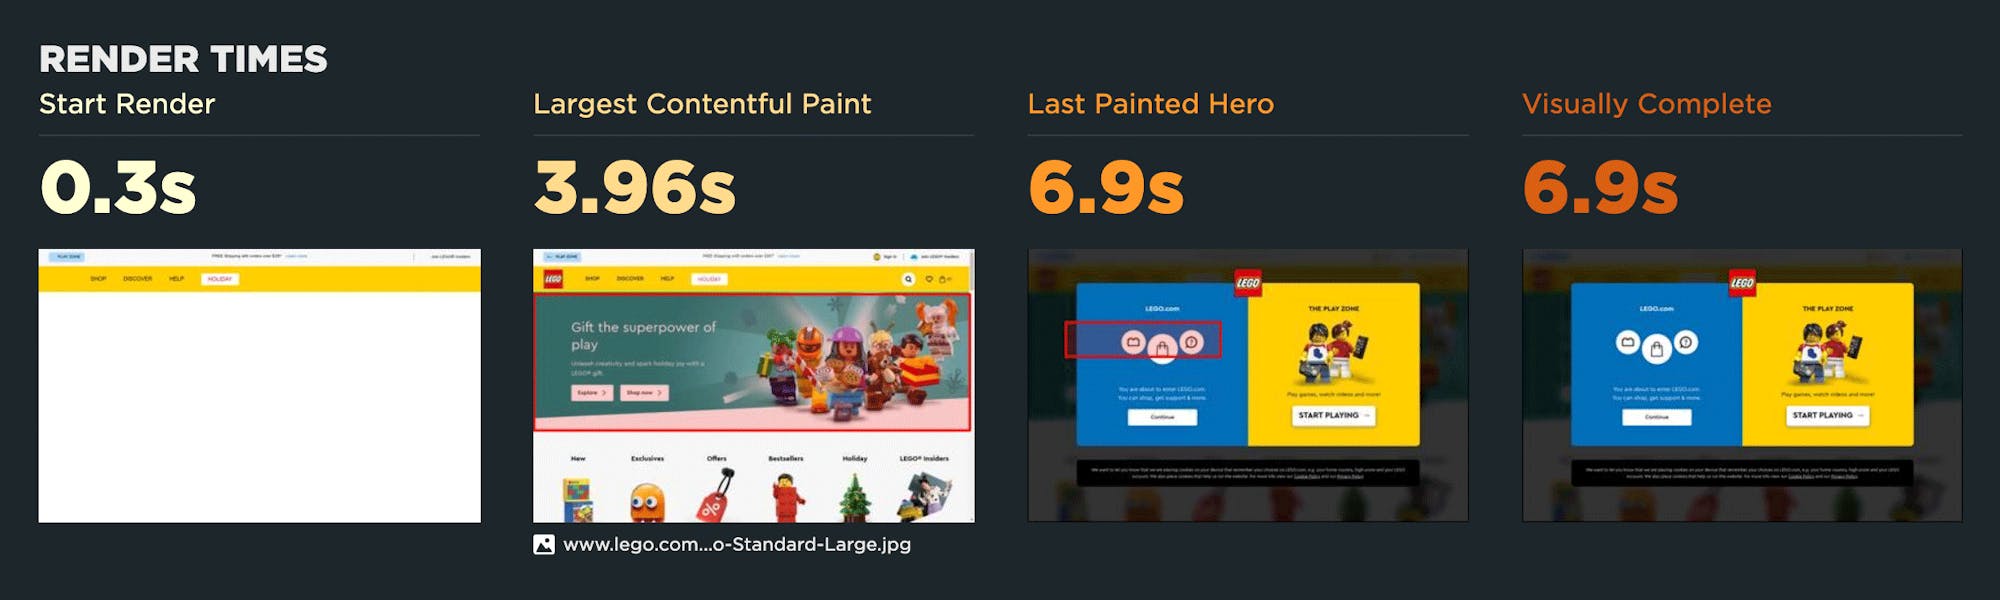
LCP is 3.96 seconds
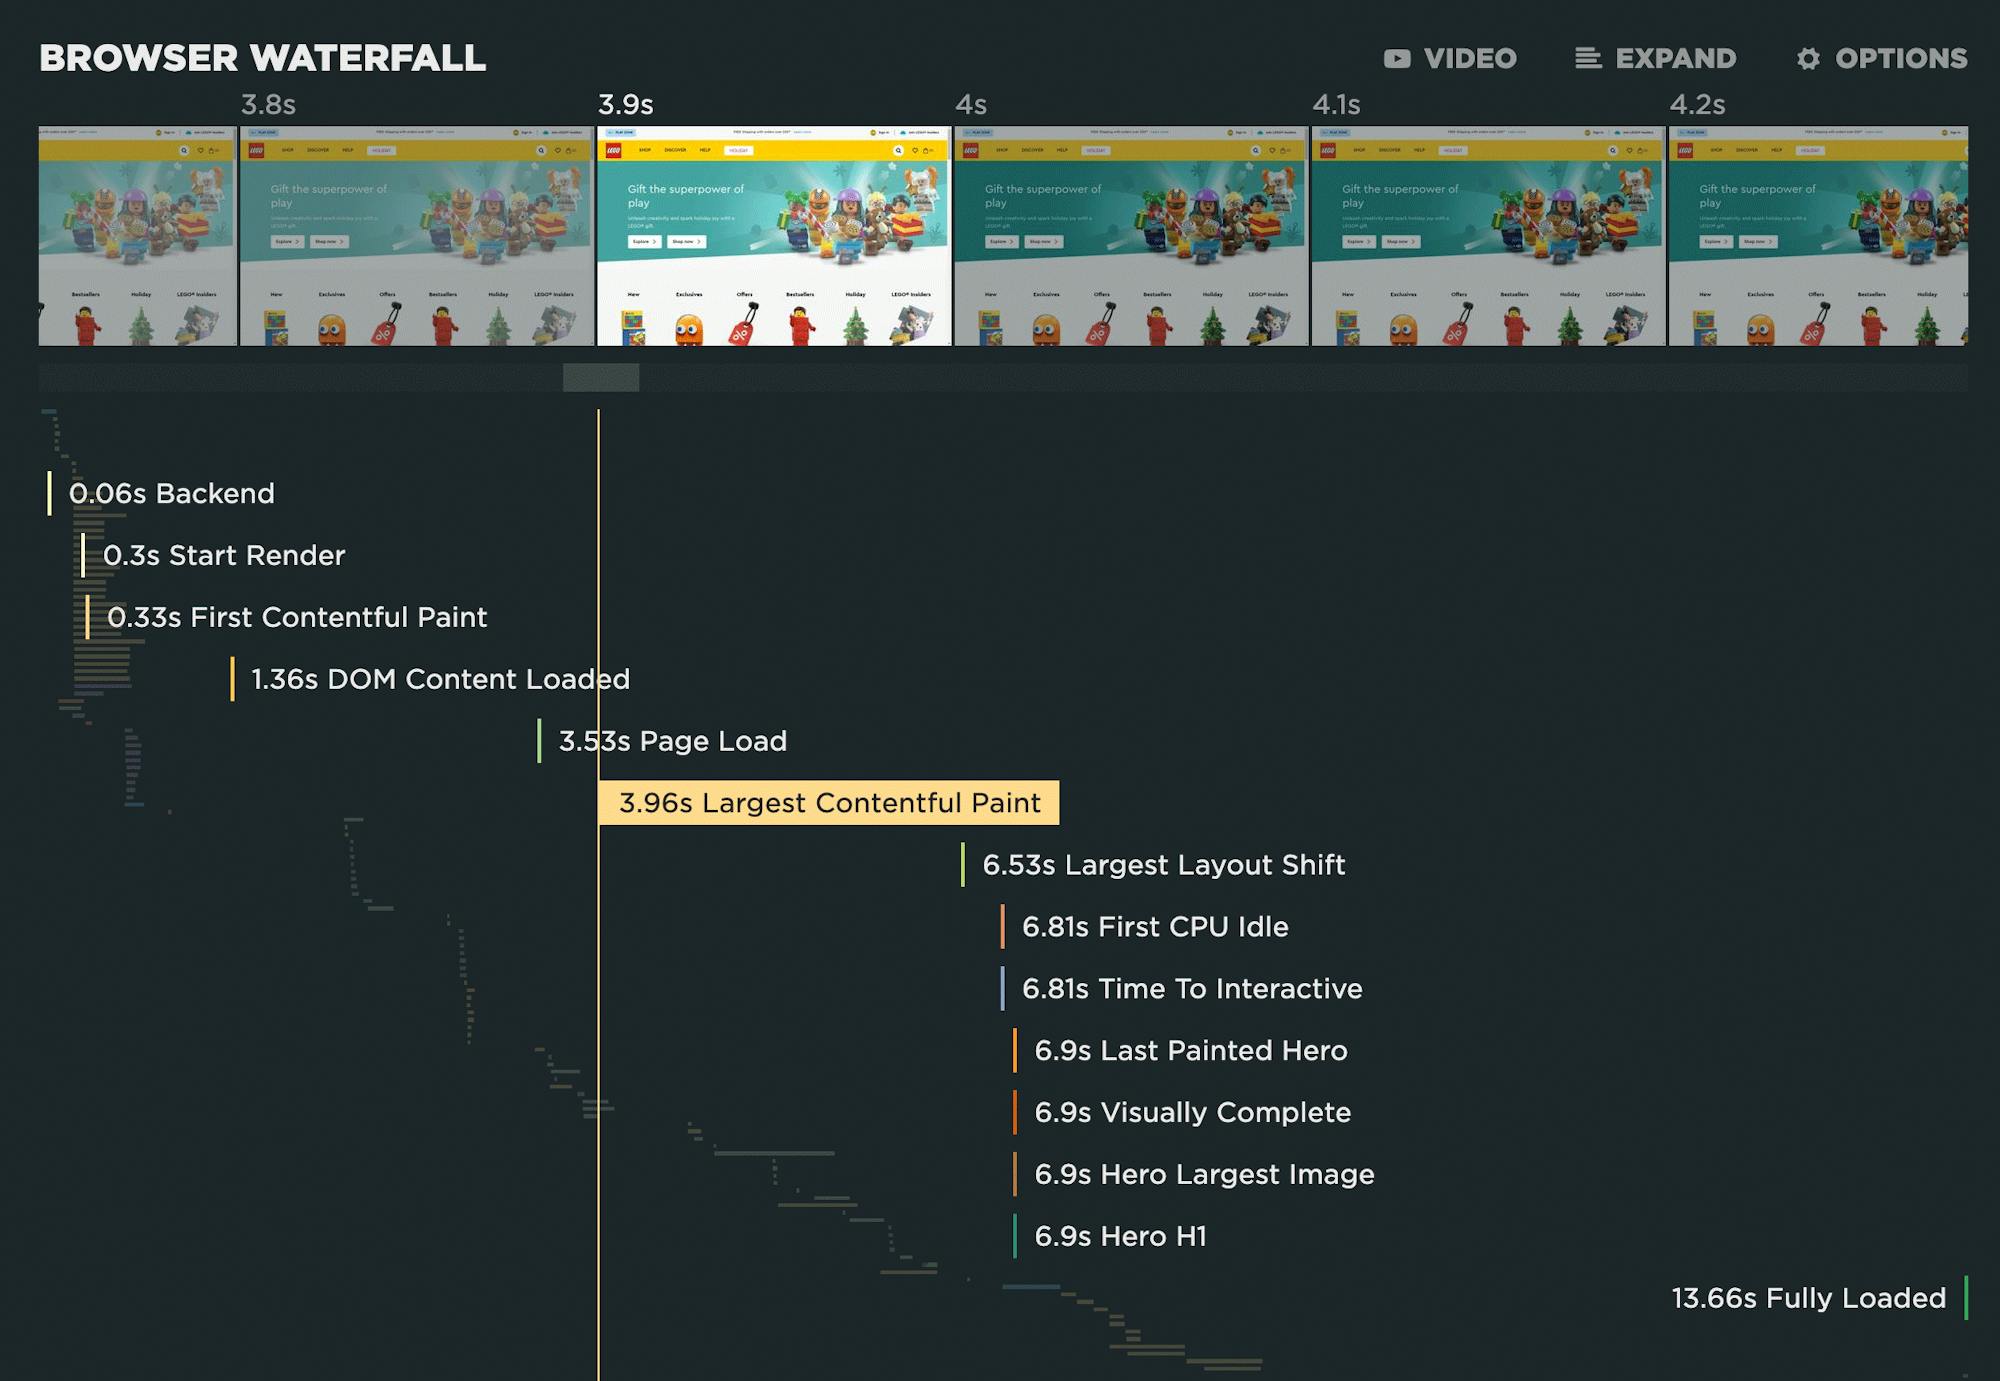
As mentioned, this leaderboard ranks pages based on their LCP time. Looking at the synthetic test results, we see that while Start Render time is an impressive 0.3 seconds, LCP lags at 3.96 seconds.
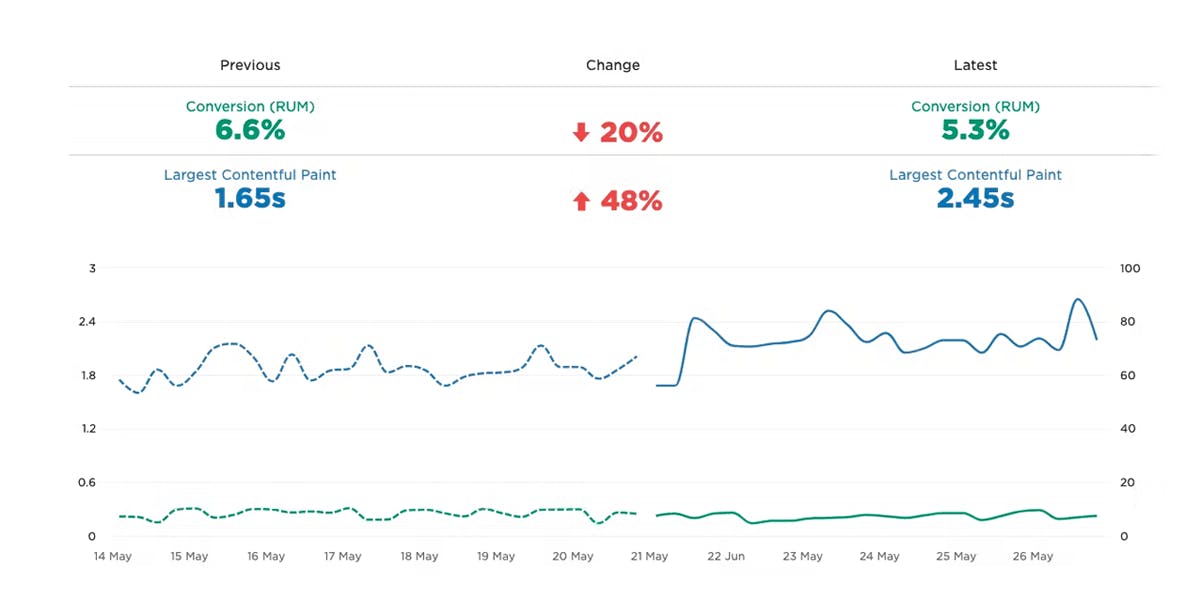
According to Google's thresholds, an LCP time of 3.96 seconds is very close to being categorized as "poor".

Content breakdown
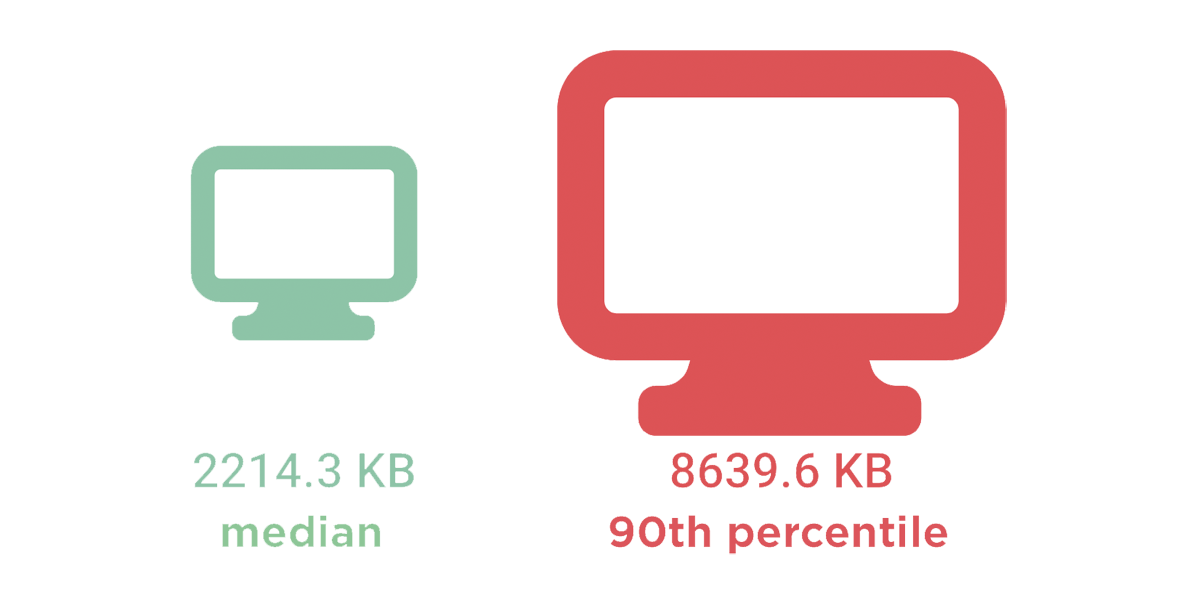
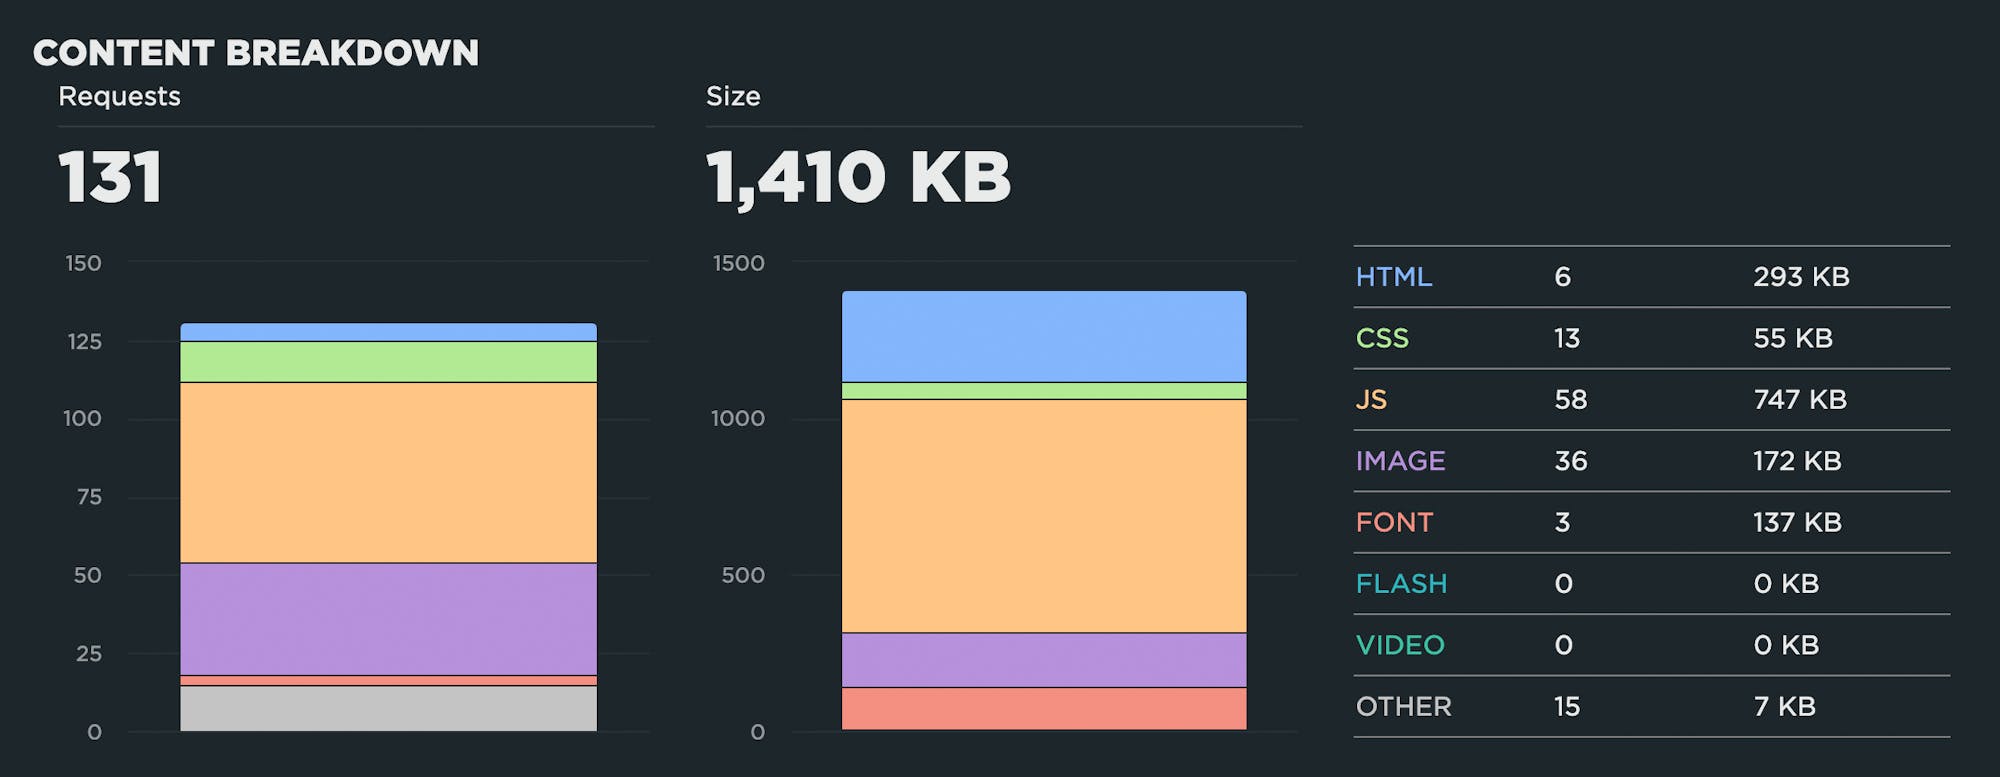
Looking at the page composition, it's actually relatively lean, with 131 resource requests (e.g., HTML, CSS, JavaScript, images, and fonts) weighing in at 1,410 kilobytes. The performance team is clearly doing a good job of fighting page bloat.
If the issue isn't sheer page bloat, then the next step is to investigate the critical rendering path.
Critical rendering path
The critical rendering path is the set of steps a browser takes to convert all a pages resources – from images and HTML to CSS and JavaScript – into a complete, functional web page.
Optimizing the critical rendering path means:
- Taking a good look at the order in which the resources on your pages render. Does essential content and scripting load first? Are non-essential or lesser resources deferred?
- Making sure that each resource in the rendering path is as performant as possible. Are images optimized? Are you using a content delivery network (CDN) to bring elements like images closer to your users, so that delivery times are faster? Are you compressing and caching the right things?
The best way to investigate the critical rendering path is to look at a waterfall chart for the page page. A waterfall chart shows you all the resources on the page, the order in which each resource is requested by the browser, and the size and duration of each request, among other things.
This is a high-level waterfall for the LEGO.com home page. It shows how key metrics align with the rendering timeline (the filmstrip view at the top of the chart).
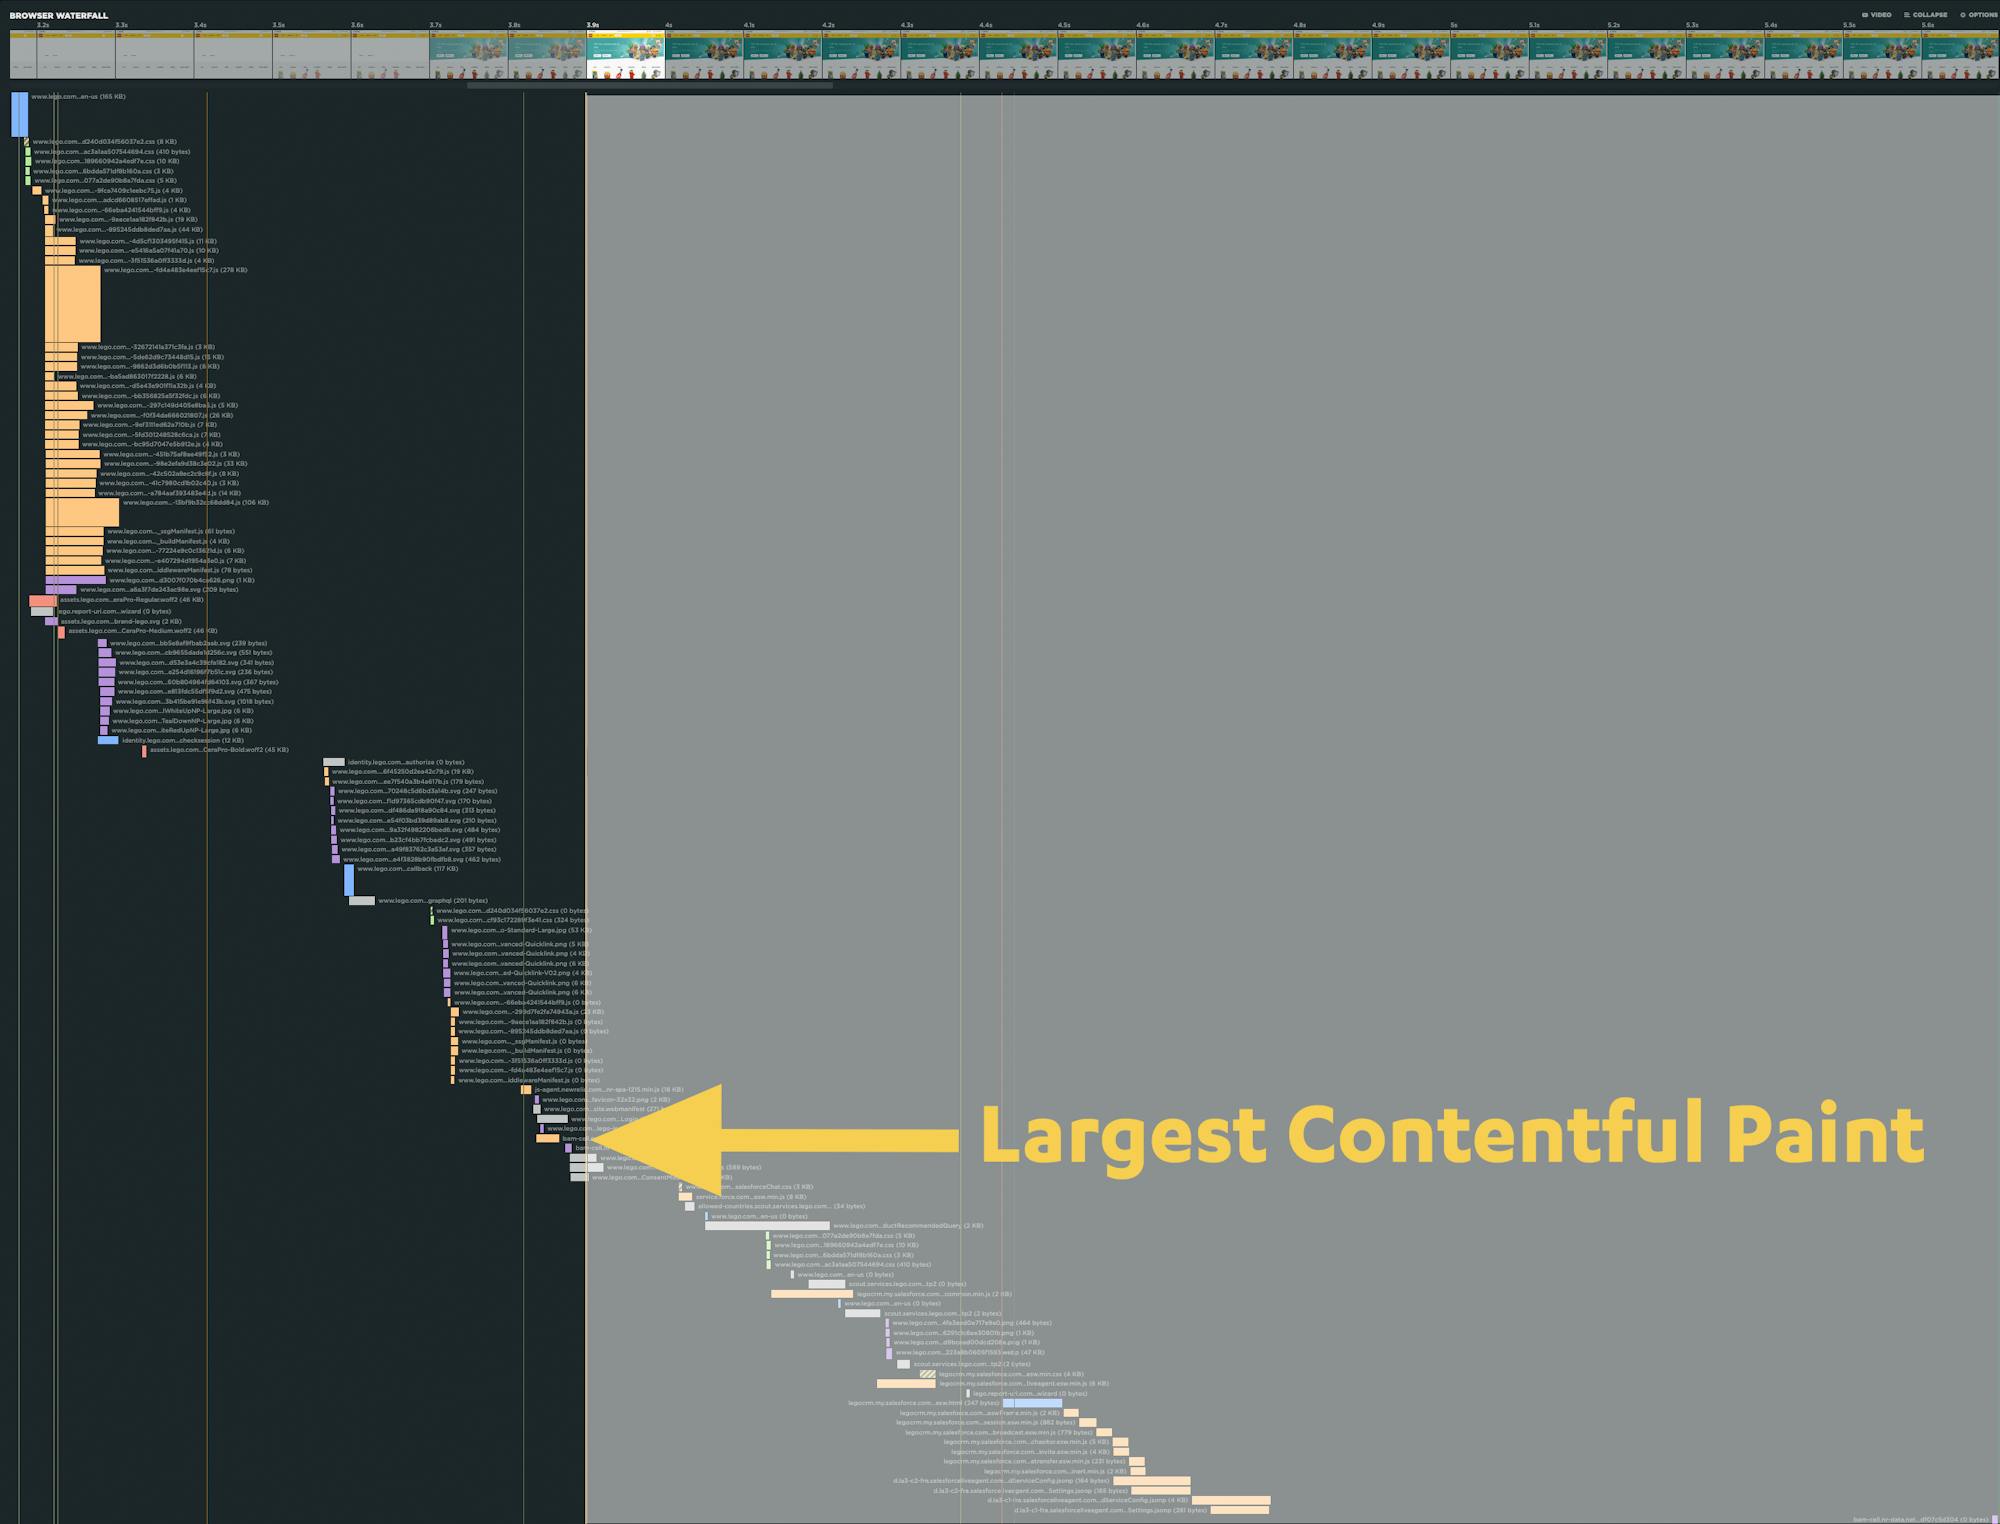
When you expand the waterfall (as I've done below), you see all the resources – again, aligned with the rendering timeline at the top of the chart. (This is an interactive element, so screenshots don't do it justice. I encourage you to go to the test details page, click on the waterfall to expand it, and then explore the chart by hovering over and clicking on the various elements.)

Each of the 131 resources on this page is represented by its own bar on the waterfall. From a performance perspective, some of these bars are more important than others. This is where the critical rendering path comes in. In this case, the critical rendering path is everything from the top of the waterfall to the moment when the Largest Contentful Paint element finishes rendering and fires the LCP event in the browser.
It only took a minute to locate the hero image in the waterfall. This image is the LCP element – arguably the most important visual element on the page. Unfortunately, it's the 71st resource requested by the browser.

Looking at the same waterfall, I've greyed out everything that comes after the LCP image. For our purposes – which is to understand why the LCP time is below par and to figure out how to improve it – everything in the greyed-out section of the waterfall isn't relevant.
This lets us focus on just this section of the waterfall chart:

Now that we know what section of the waterfall to focus on, we can take advantage of a nifty feature in SpeedCurve (available under 'Options' in the top right corner of the waterfall), which lets you learn which requests have high CPU usage, as well as excessive main thread activity.

So now the waterfall chart looks like this, with the Long Tasks (main thread JS activity over 50ms) clearly visible in red:
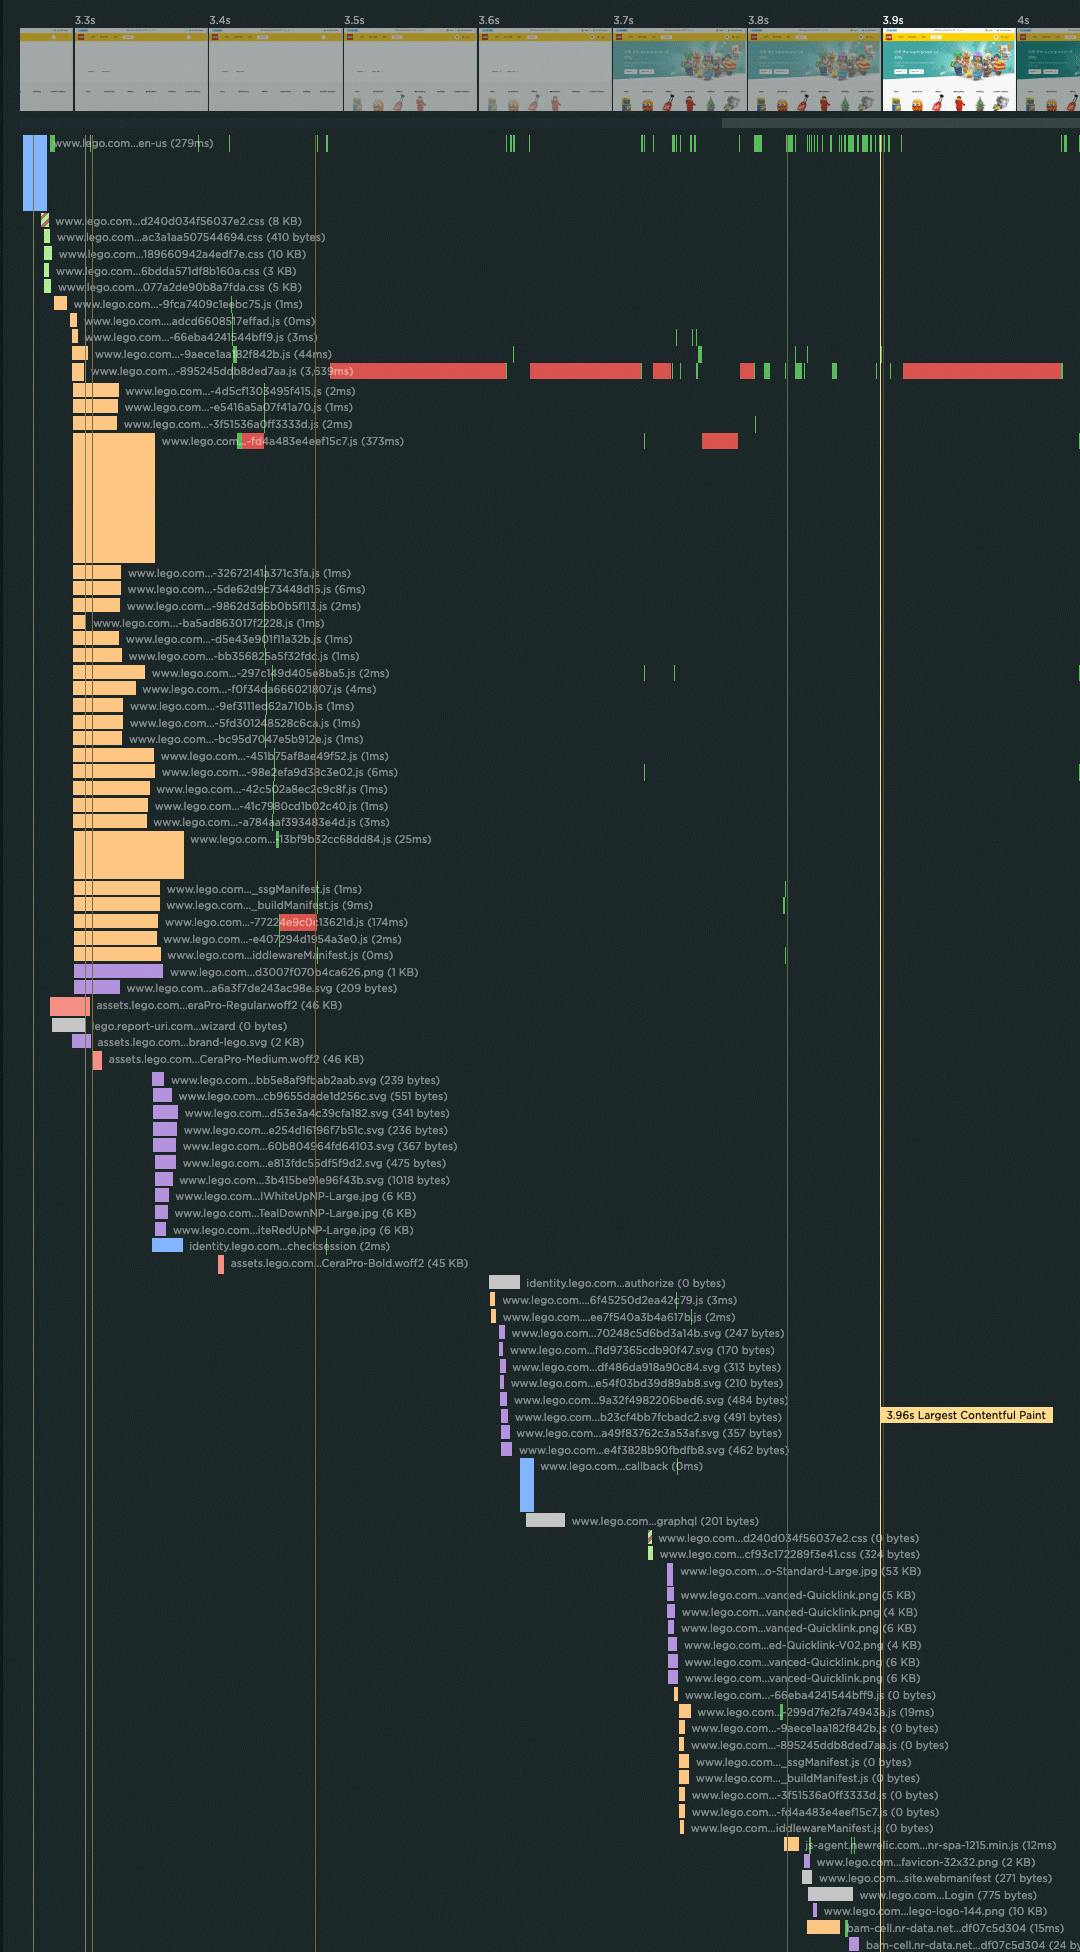
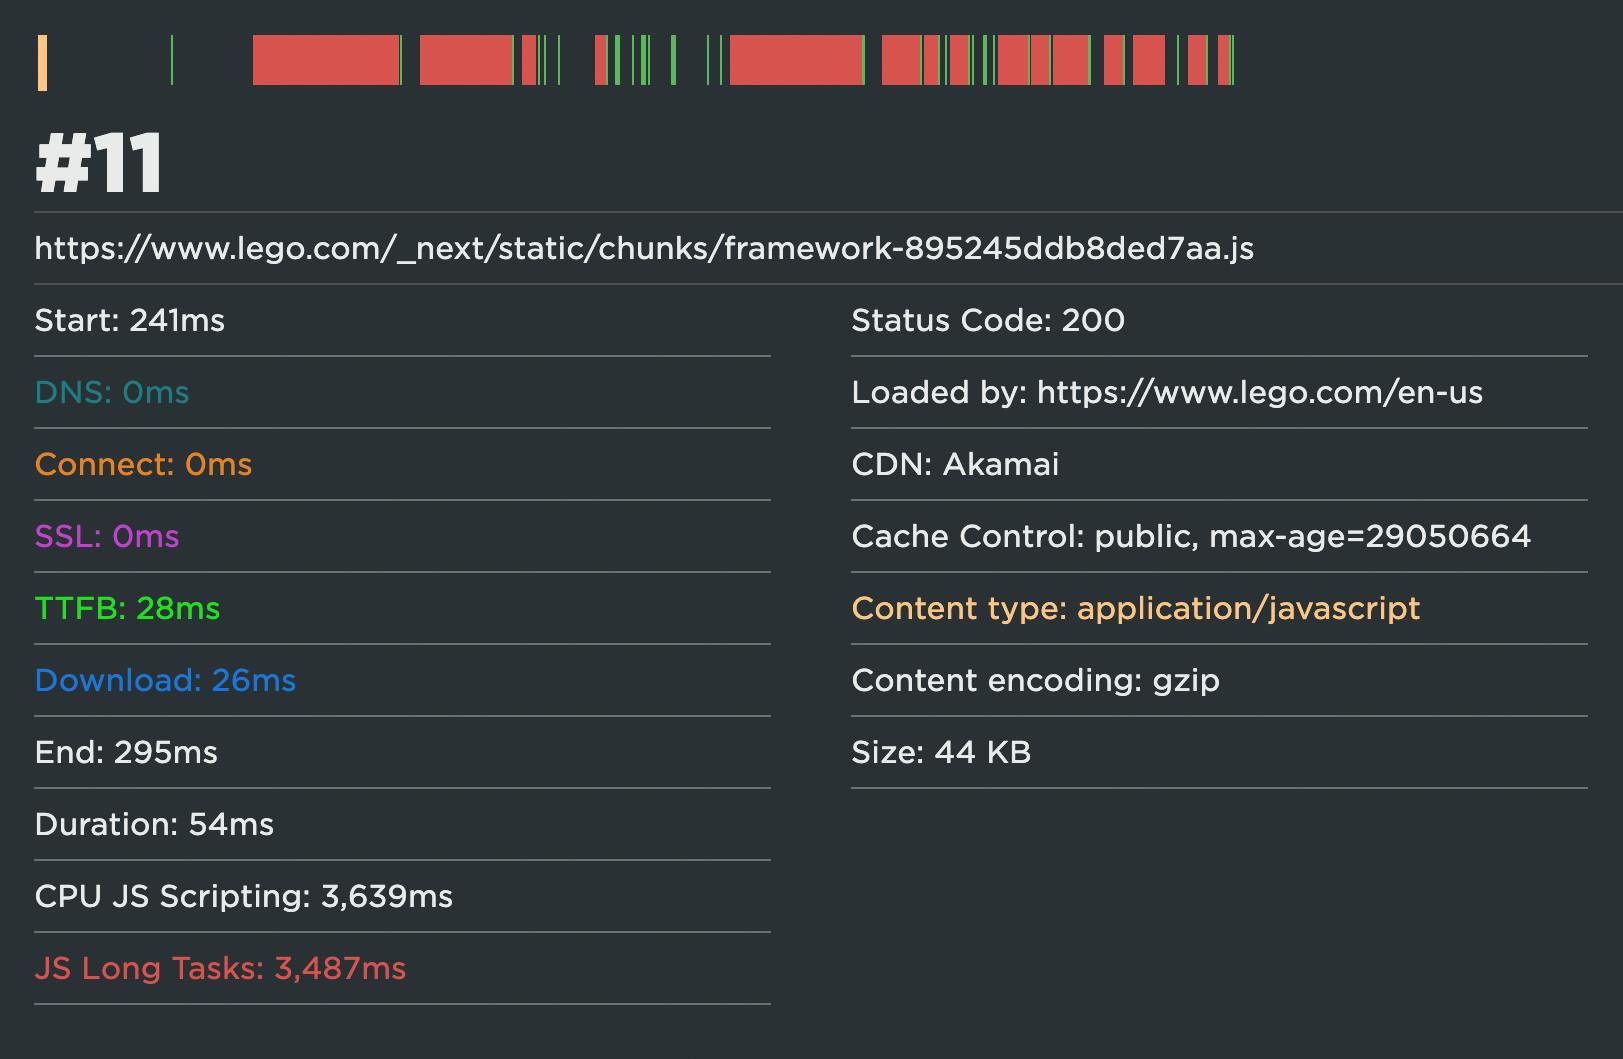
Clicking on the JavaScript request with all the red bars lets you learn more about that request – including the fact that this request has a total Long Tasks time of almost 3.5 seconds (which is a lot!):
Observations
The LCP image is added to the page using JavaScript
Because of this, the browser doesn't know about the image until the JS is downloaded and fully executed. As we've just seen, some of the JS on this page generates excessive Long Tasks. Even though the hero image – which in and of itself is a fairly well optimized image – has downloaded at around the 2.9 second mark, the LCP event is prevented from firing for another second. One second may not sound like much, but it's the critical difference between a middling LCP score and a poor score.
Non-essential images are prioritized above the LCP image
There are 20 lesser image requests (purple bars) before the hero image. This includes smaller images that aren't even in the initial viewport. The reason why these images are loading before the LCP image is because they're in the HTML.
Too many JavaScript chunks before the LCP event
There are 33 JavaScript requests (orange bars) before the hero image is called. This page utilizes code splitting – a technique that involves breaking JS into smaller, manageable chunks that are ideally loaded only when needed. Reducing the amount of code that needs to be downloaded and parsed is intended to result in faster initial rendering times. However, too many chunks can have the opposite effect, because the browser is limited in how many resources it can request at once.
Unused JavaScript before the LCP event
Looking at the Lighthouse audits for this page, there's some unused JS that could be removed. All of the JS files below are requested before the LCP event. While this unused JS isn't the culprit behind the slow LCP time, it's still considered a best practice to remove unused scripts.

Takeaways
The LEGO home page is lean and quick to start rendering. Those are already big wins. Optimizing the critical rendering path could make this page a star on the Retail Benchmarks leaderboard.
Some lessons to take away:
- Prioritize your most important visual element. Have the markup for the image in the served HTML, and include the
fetchpriority=“high”attribute on it. - Defer non-essential JavaScript.
- Use code splitting judiciously.
- Remove unused resources.
Next?
Is there a page you'd like us to audit? Let us know at support@speedcurve.com!
If you'd like to analyze your own pages (including Core Web Vitals analysis and Lighthouse audits) – or compare your site to your competitors – you can do that in SpeedCurve. If you're not using us yet, start your free trial.