NEW! SpeedCurve RUM for your Magento projects

Now you can integrate robust real user monitoring into your Magento project in minutes!
As a product manager, I have to say there are few things more flattering than having our users build apps that empower other folks to use our product.
Hot on the heels of our SpeedCurve RUM for Shopify app is a new open‑source Magento module – from Jesper Ingels and the awesome team at Bluebird Day – that lets you integrate SpeedCurve real user monitoring into your Magento project in minutes – no coding required!
Keep reading to learn the benefits of gathering real user data and how to get started.
How to enable SpeedCurve in your Shopify store

SpeedCurve now has a Shopify app to make installing and using SpeedCurve in your Shopify store much easier. With this app, you can quickly set up real user monitoring – no coding required.
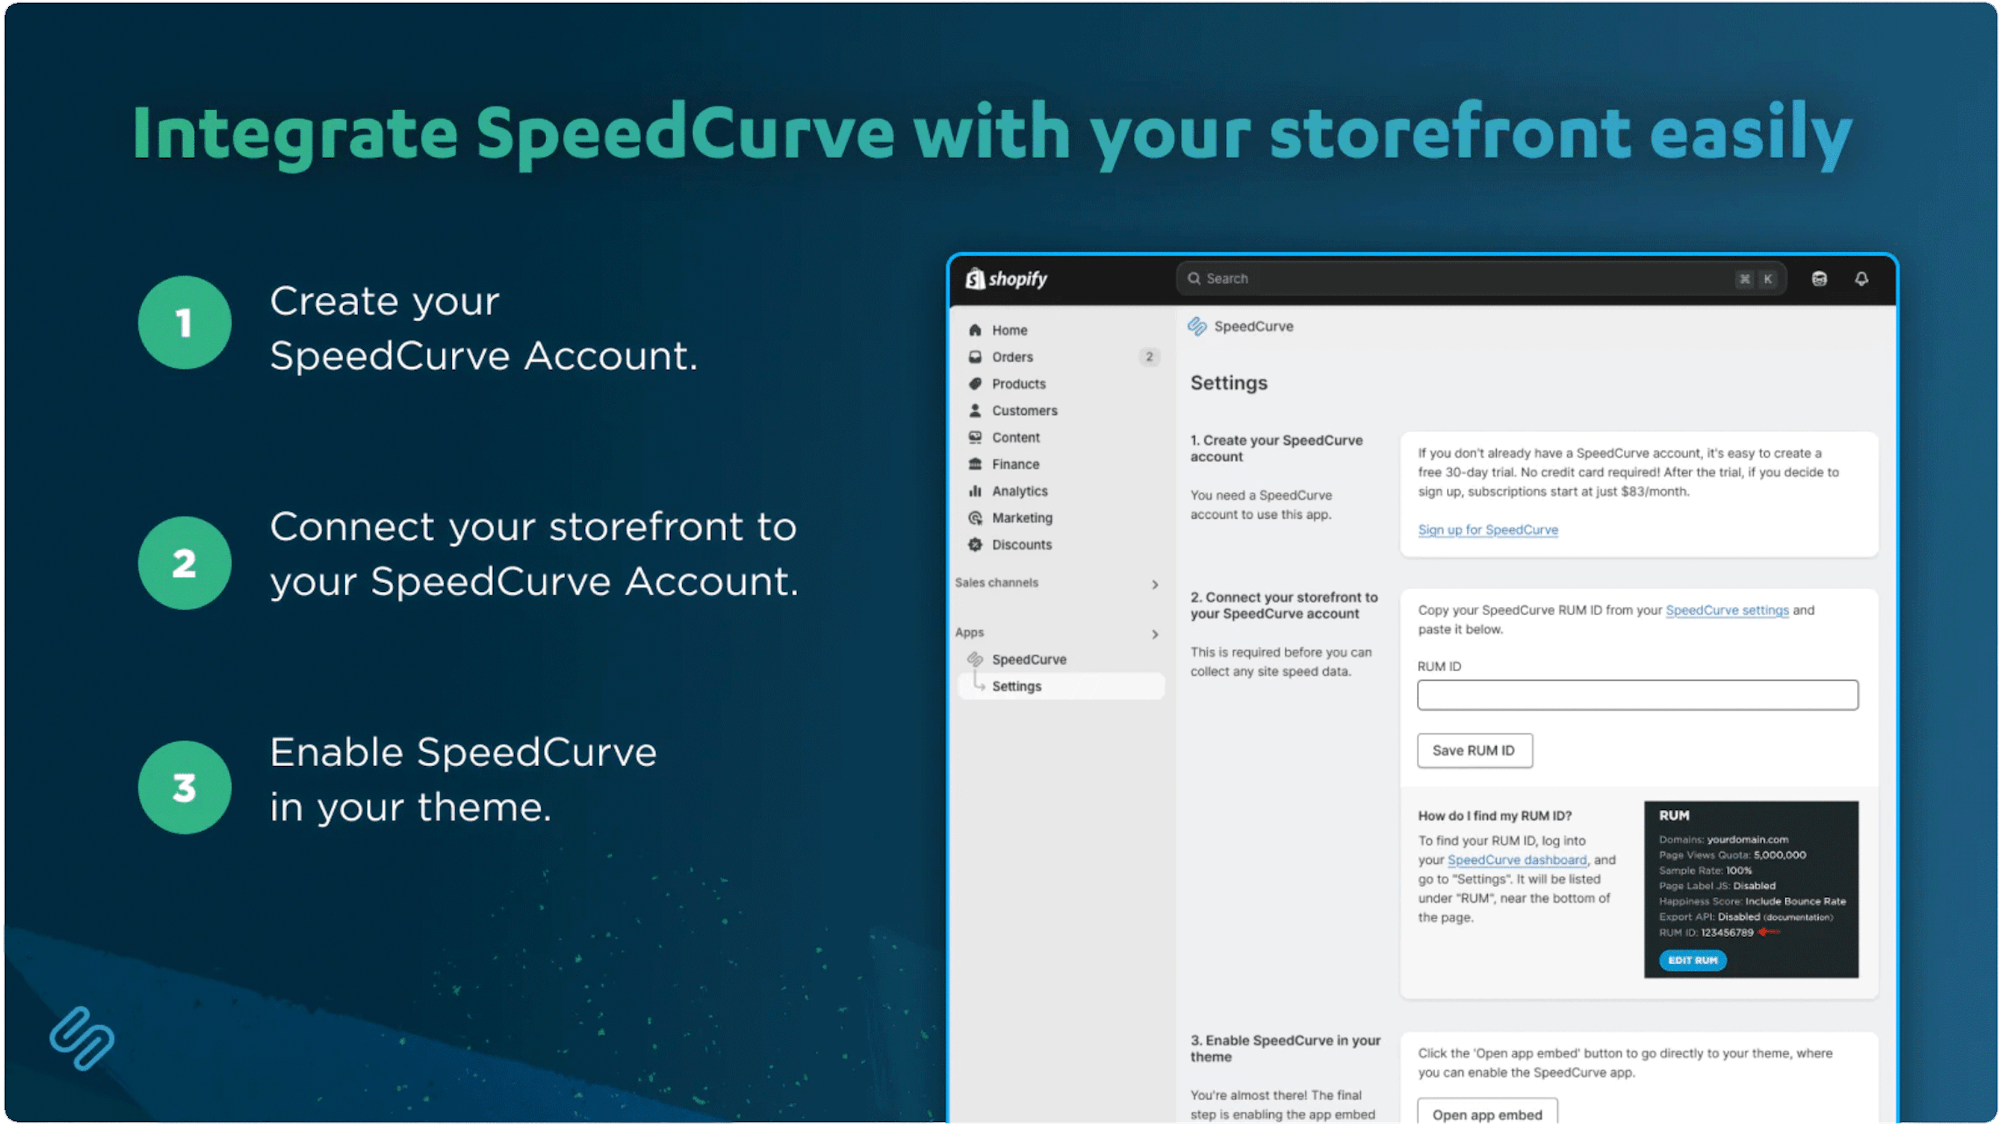
Here's how to install the SpeedCurve RUM app in your Shopify store, along with troubleshooting and next steps.
NEW! SpeedCurve RUM for your Shopify store
If you run a Shopify store, you already know how critical it is to provide a seamless shopping experience. That's why I was so excited when the folks at SpeedCurve asked me to draw on my Shopify experience to build their new RUM app for Shopify storefronts. Now I'm here to let you know how it works and why it's an important part of your UX toolset.
In ecommerce, speed isn’t just nice to have – it’s a competitive advantage. Slow websites lead to frustrated users, lost sales, and damaged brand trust.
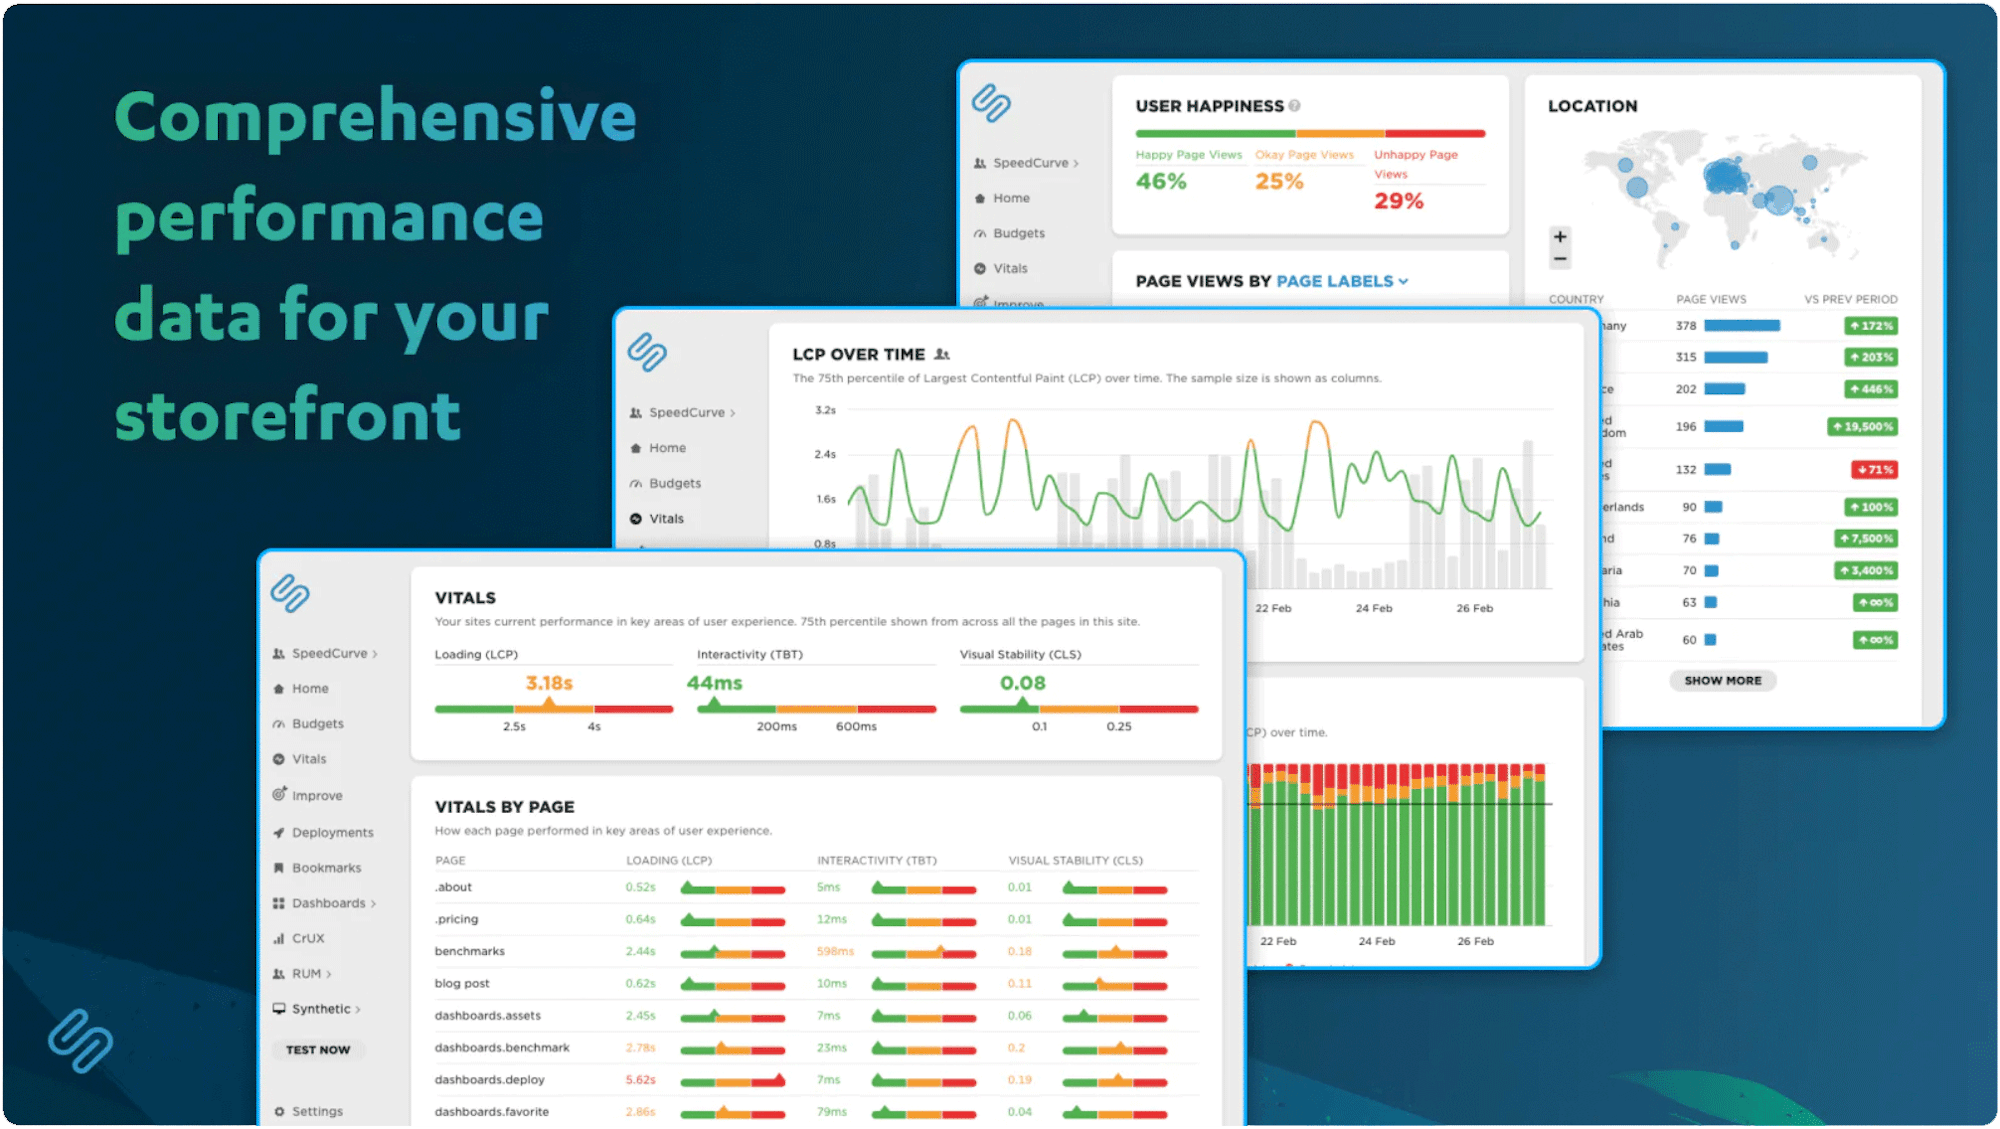
With the SpeedCurve RUM app, you can track metrics like Core Web Vitals, identify performance issues, measure the impact of site speed on conversion rates, and stay ahead of page slowdowns – no coding required.
The Definitive Guide to Long Animation Frames (LoAF)

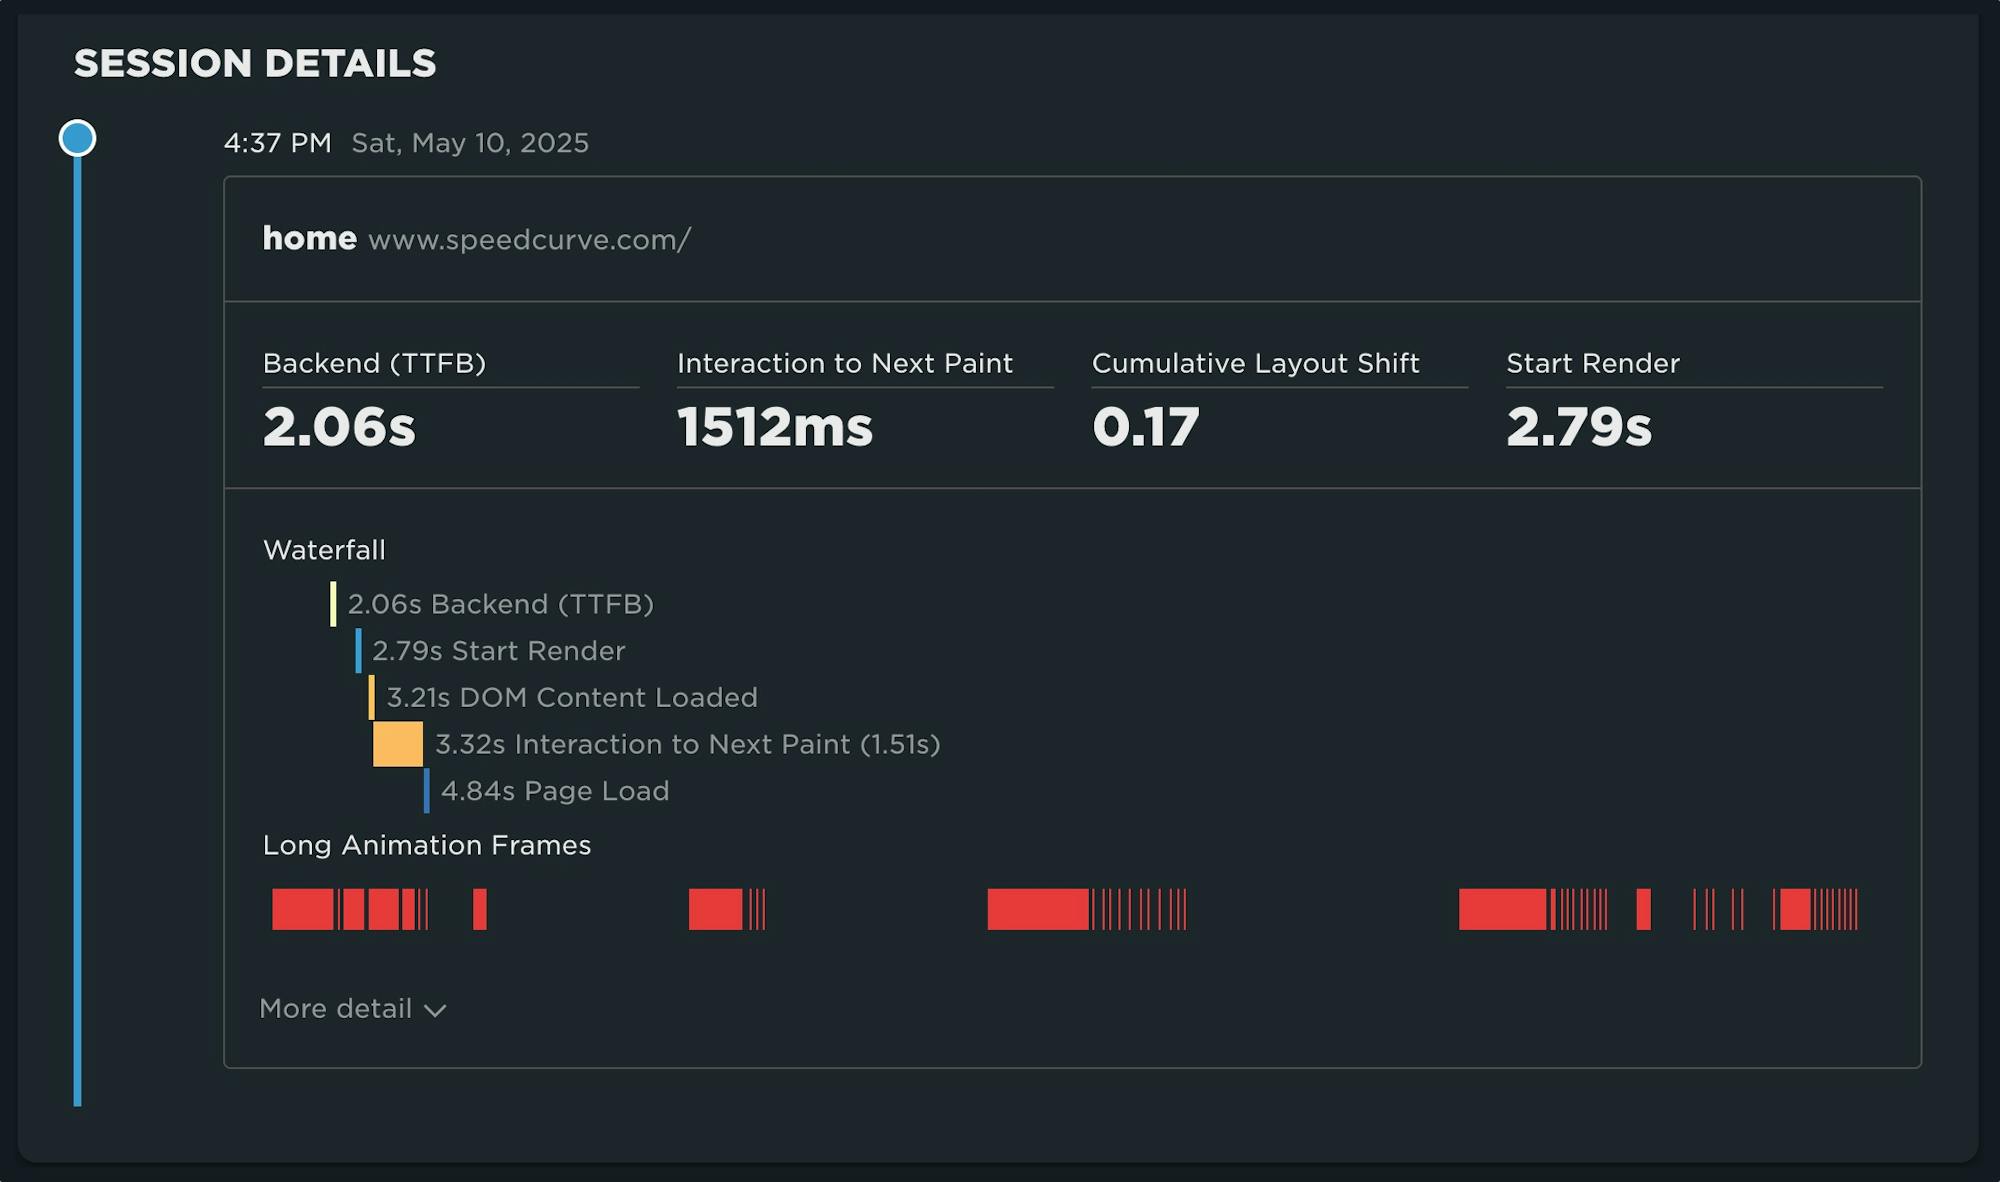
With Long Animation Frames (commonly referred to as LoAF, pronounced 'LO-aff') we finally have a way to understand the impact of our code on our visitors' experiences.
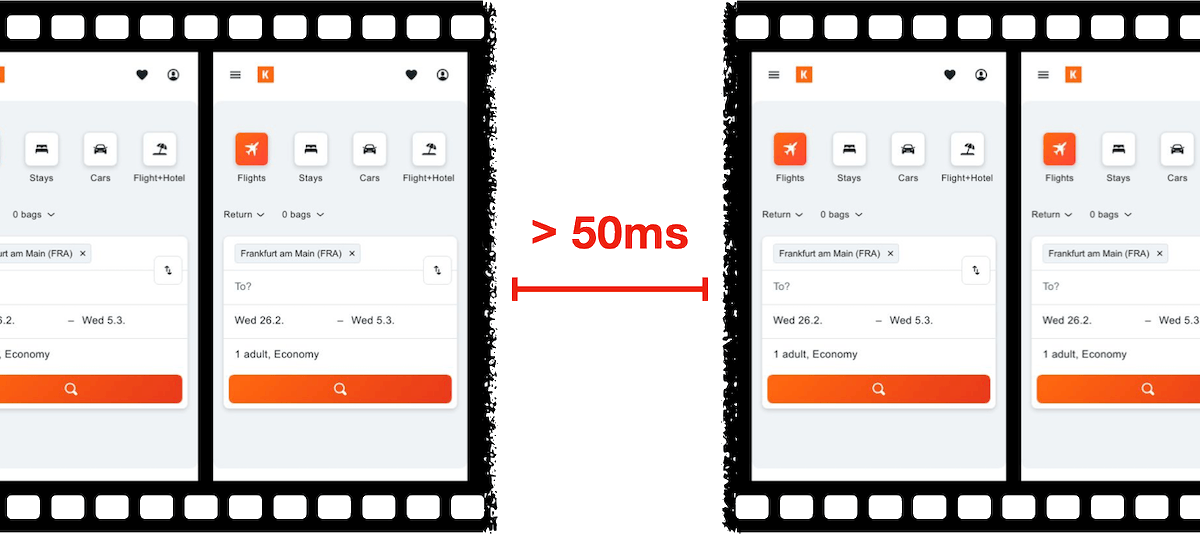
Long Animation Frame – a frame that took longer then 50ms from its start to when it started painting
LoAF allows us to understand how scripts and other tasks affect both hard and soft navigations, as well as how scripts affect interactions. Using the data LoAF provides, we can identify problem scripts and target changes that improve our visitors' experience. We can also finally start to quantify the impact of third-party scripts as they execute in our visitors' browsers.
Keep reading to learn:
- Why animation frame rate matters
- Anatomy of a Long Animation Frame
- Key LoAF milestones and what we can do with milestone data
- Script attribution (and why script details might sometimes be unavailable)
- How to match script data to Interaction to Next Paint, including sub-parts
- How to capture LoAF entries
- Getting started with LoAF
- LoAF support in SpeedCurve
NEW! Monitor Long Animation Frames and get to the bottom of your JavaScript issues
CPU consumption by the browser is one of the main causes – if not the number one cause – of a poor user experience. The primary culprit? JavaScript execution. Now you can use SpeedCurve to monitor Long Animation Frames (LoAFs) and fix the third parties and other scripts that are hurting your page speed.
Until recently, we've had little evidence from the field that definitively attributes the root cause of rendering delays. While JavaScript Long Tasks gave us a good indication that there were blocking tasks affecting metrics such as Interaction to Next Paint and Largest Contentful Paint, there was no way to attribute the work or understand how it was ultimately affecting rendering.
Fortunately, we've gotten a lot of help from Chrome in improving the attribution – and ultimately the actionability – of the data we collect in the field with RUM. The introduction of the Long Animation Frames API (LoAF) not only gives us better methods for understanding what's happening on the browser's main thread, in some cases it also gives us attribution to both first- and third-party scripts that occur during a LoAF.
This has been a highly anticipated addition to SpeedCurve, which is available for all our RUM users today. This post covers what's new in the product and points you to a few new resources to help you get up to speed on all things related to LoAF.
Why you need to know your site's performance plateau (and how to find it)

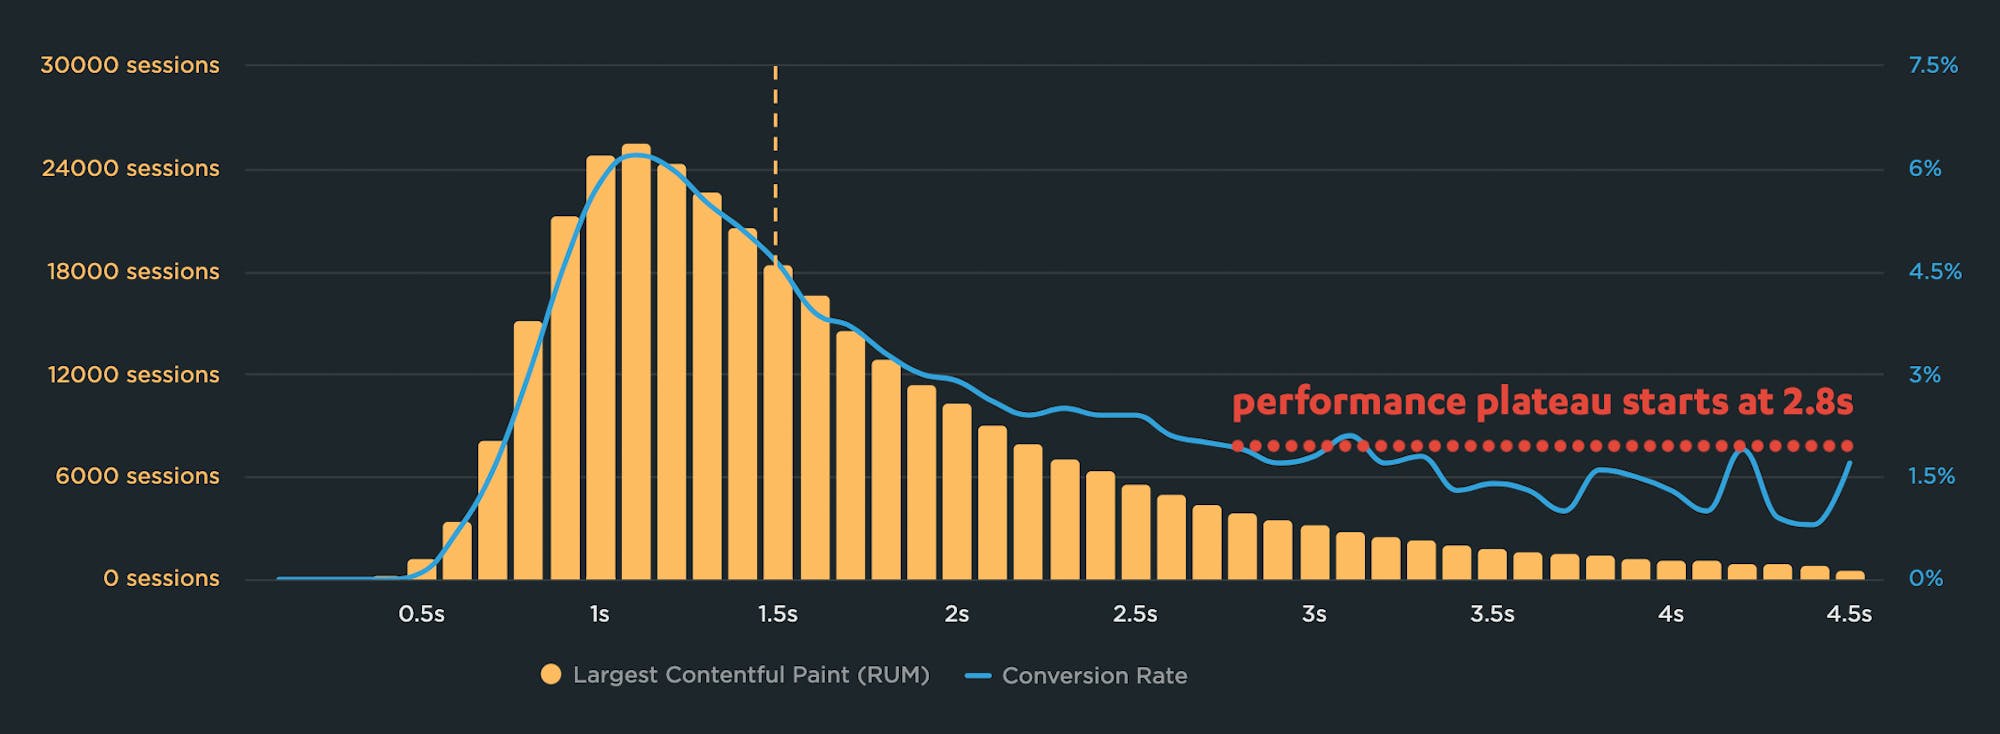
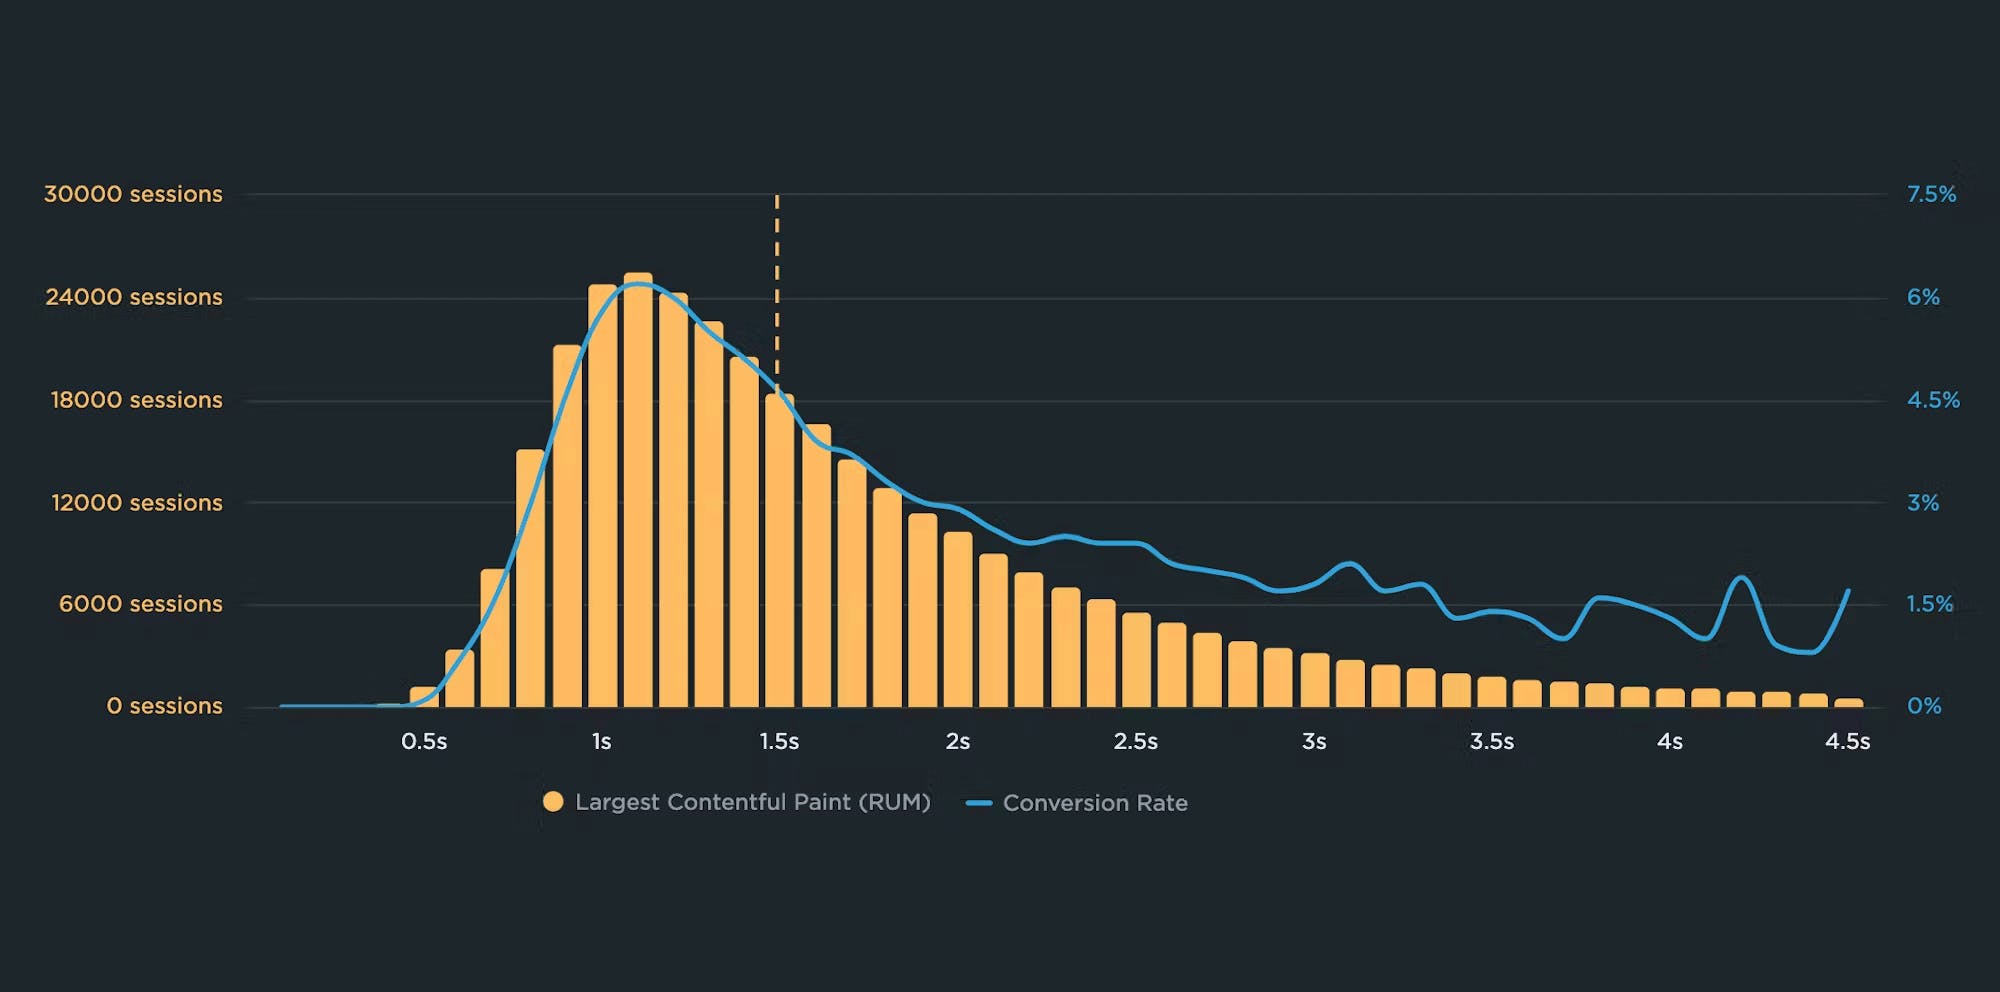
Have you ever wondered why your site got faster, but your business and user engagement metrics didn't improve? The answer might lie on the performance plateau.
Have you ever asked yourself these questions?
"I made my pages faster, but my business and user engagement metrics didn't change. WHY???"
"How do I know how fast my site should be?"
"How can I demonstrate the business value of page speed to people in my organization?"
The answers might lie with identifying and understanding the performance plateau for your site.
Correlation charts: Connect the dots between site speed and business success
If you could measure the impact of site speed on your business, how valuable would that be for you? Say hello to correlation charts – your new best friend.
Here's the truth: The business folks in your organization probably don't care about page speed metrics. But that doesn't mean they don't care about page speed. It just means you need to talk with them using metrics they already care about – such as conversion rate, revenue, and bounce rate.
That's why correlation charts are your new best friend.
Downtime vs slowtime: Which costs you more?
Comparing site outages to page slowdowns is like comparing a tire blowout to a slow leak. One is big and dramatic. The other is quiet and insidious. Either way, you end up stranded on the side of the road.

Downtime is horrifying for any company that uses the web as a vital part of its business (which is to say, most companies). Some of you may remember the Amazon outage of 2013, when the retail behemoth went down for 40 minutes. The incident made headlines, largely because those 40 minutes were estimated to have cost the company $5 million in lost sales.
Downtime makes headlines:
- 2015 – 12-hour Apple outage cost the company $25 million
- 2016 – 5-hour outage caused an estimated loss of $150 million for Delta Airlines
- 2019 – 14-hour outage cost Facebook an estimated $90 million
It's easy to see why these stories capture our attention. These are big numbers! No company wants to think about losing millions in revenue due to an outage.
Page slowdowns can cause as much damage as downtime
While Amazon and other big players take pains to avoid outages, these companies also go to great effort to manage the day-to-day performance – in terms of page speed and user experience – of their sites. That’s because these companies know that page slowdowns can cause at least as much damage as downtime.
Page bloat update: How does ever-increasing page size affect your business and your users?
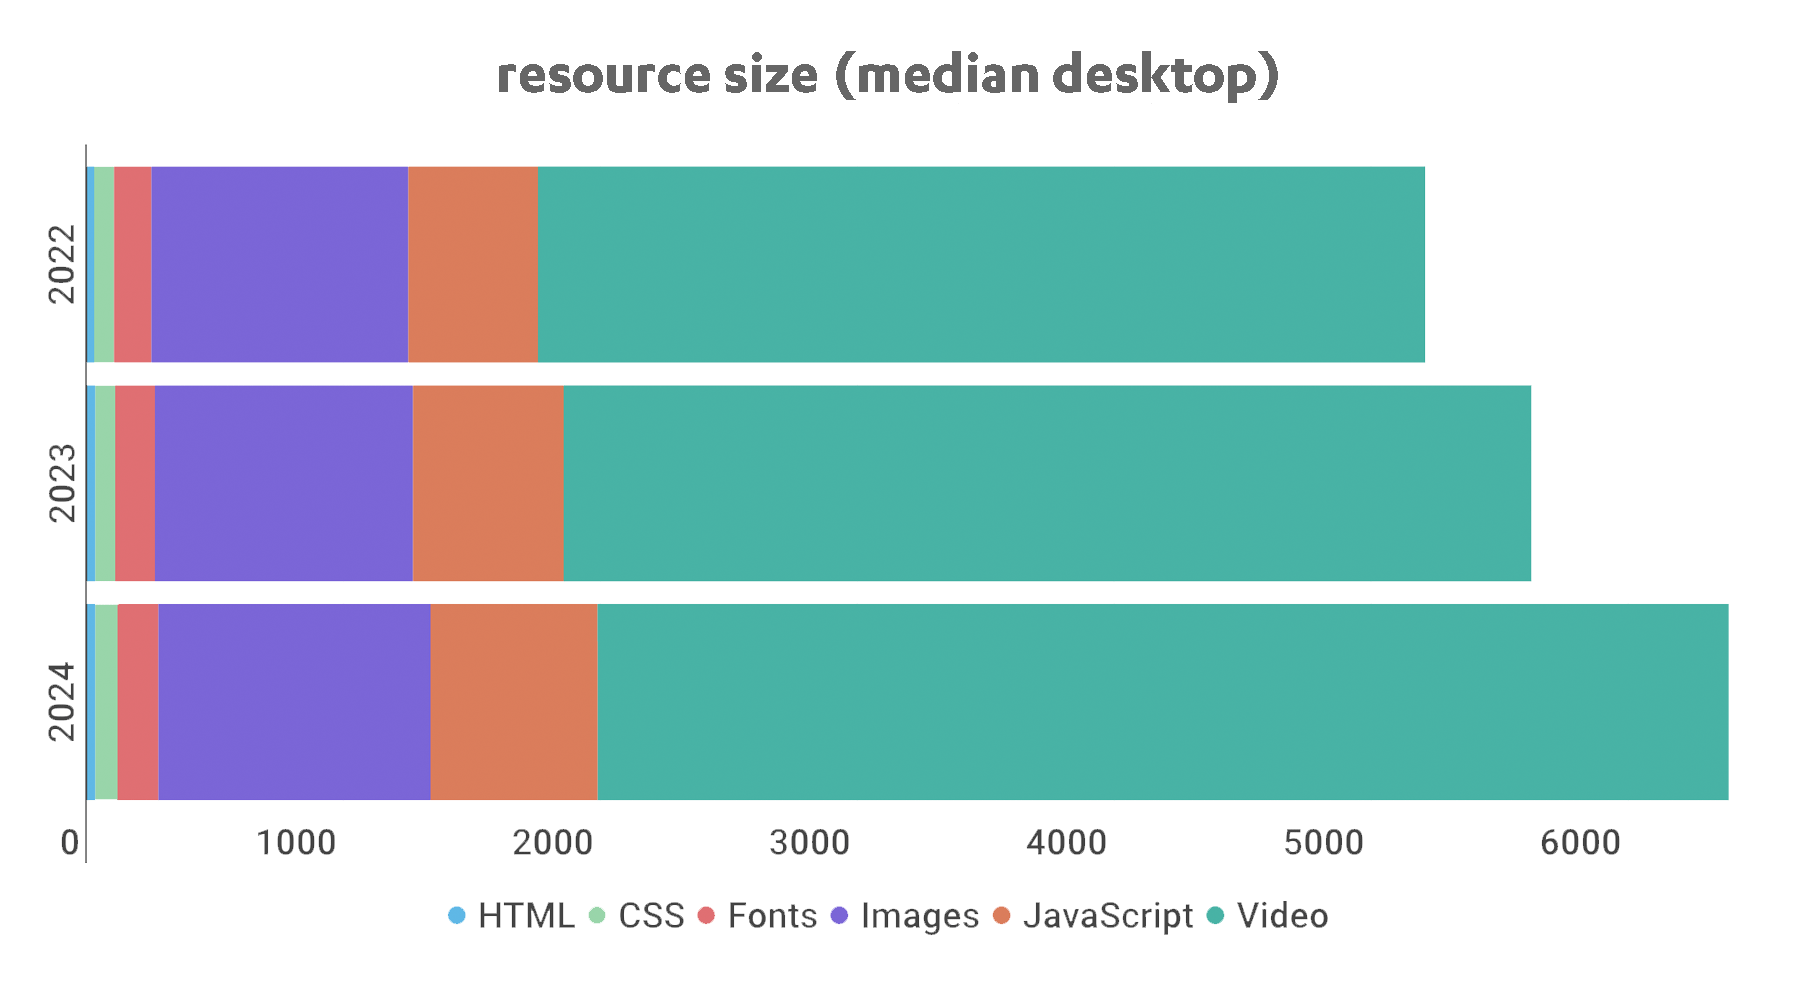
The median web page is 8% bigger than it was just one year ago. How does this affect your page speed, your Core Web Vitals, your search rank, your business, and most important – your users? Keep scrolling for the latest trends and analysis.
For almost fifteen years, I've been writing about page bloat, its impact on site speed, and ultimately how it affects your users and your business. You might think this topic would be exhausted by now, but every year I learn new things – beyond the overarching fact that pages keep getting bigger and more complex, as you can see in this chart, using data from the HTTP Archive:
In this post, we'll cover:
- How much pages have grown over the past year
- How page bloat hurts your business and – at the heart of everything – your users
- How page bloat affects Google's Core Web Vitals (and therefore SEO)
- If it's possible to have large pages that still deliver a good user experience
- Page size targets
- How to track page size and complexity
- How to fight regressions
Our 10 most popular web performance articles of 2024
We love writing articles and blog posts that help folks solve real web performance and UX problems. Here are the ones you loved most in 2024. (The number one item may surprise you!)

Some of these articles come from our recently published Web Performance Guide – a collection of evergreen how-to resources (written by actual humans!) that will help you master website monitoring, analytics, and diagnostics. The rest come from this blog, where we tend to publish industry news and analysis.
Regardless of the source, we hope you find these pieces useful!
ICYMI: Some of our most exciting product updates of 2024!
Every year feels like a big year here at SpeedCurve, and 2024 was no exception. Here's a recap of product highlights designed to make your performance monitoring even better and easier!

Our biggest achievements this year have centred on making it easier for you to:
- Gather more meaningful real user monitoring (RUM) data
- Get actionable insights from Core Web Vitals
- Simplify your synthetic testing
- Get expert performance coaching when and how you need it
Keep reading to learn more...
A Holiday Wish: Core Web Vitals in Safari
Did you know that key performance metrics – like Core Web Vitals – aren't supported in Safari? If that's news to you, you're not alone! Here's why that is... and what we and the rest of the web performance community are doing to fix it.

Somebody pinch me. Seeing this post and the resulting thread gives me great hope.
Nicole Sullivan (aka Stubbornella, WebKit Engineering Manager at Apple, and OG web performance evangelist) isn't making promises or dangling a carrot. Nonetheless, it's evidence of the willingness for some public discussion on a topic that's been exhaustively discussed in our community for years. Nicole's post has gotten some great responses from many leaders in our community, hopefully shaping a strong use case for future WebKit support for Core Web Vitals.
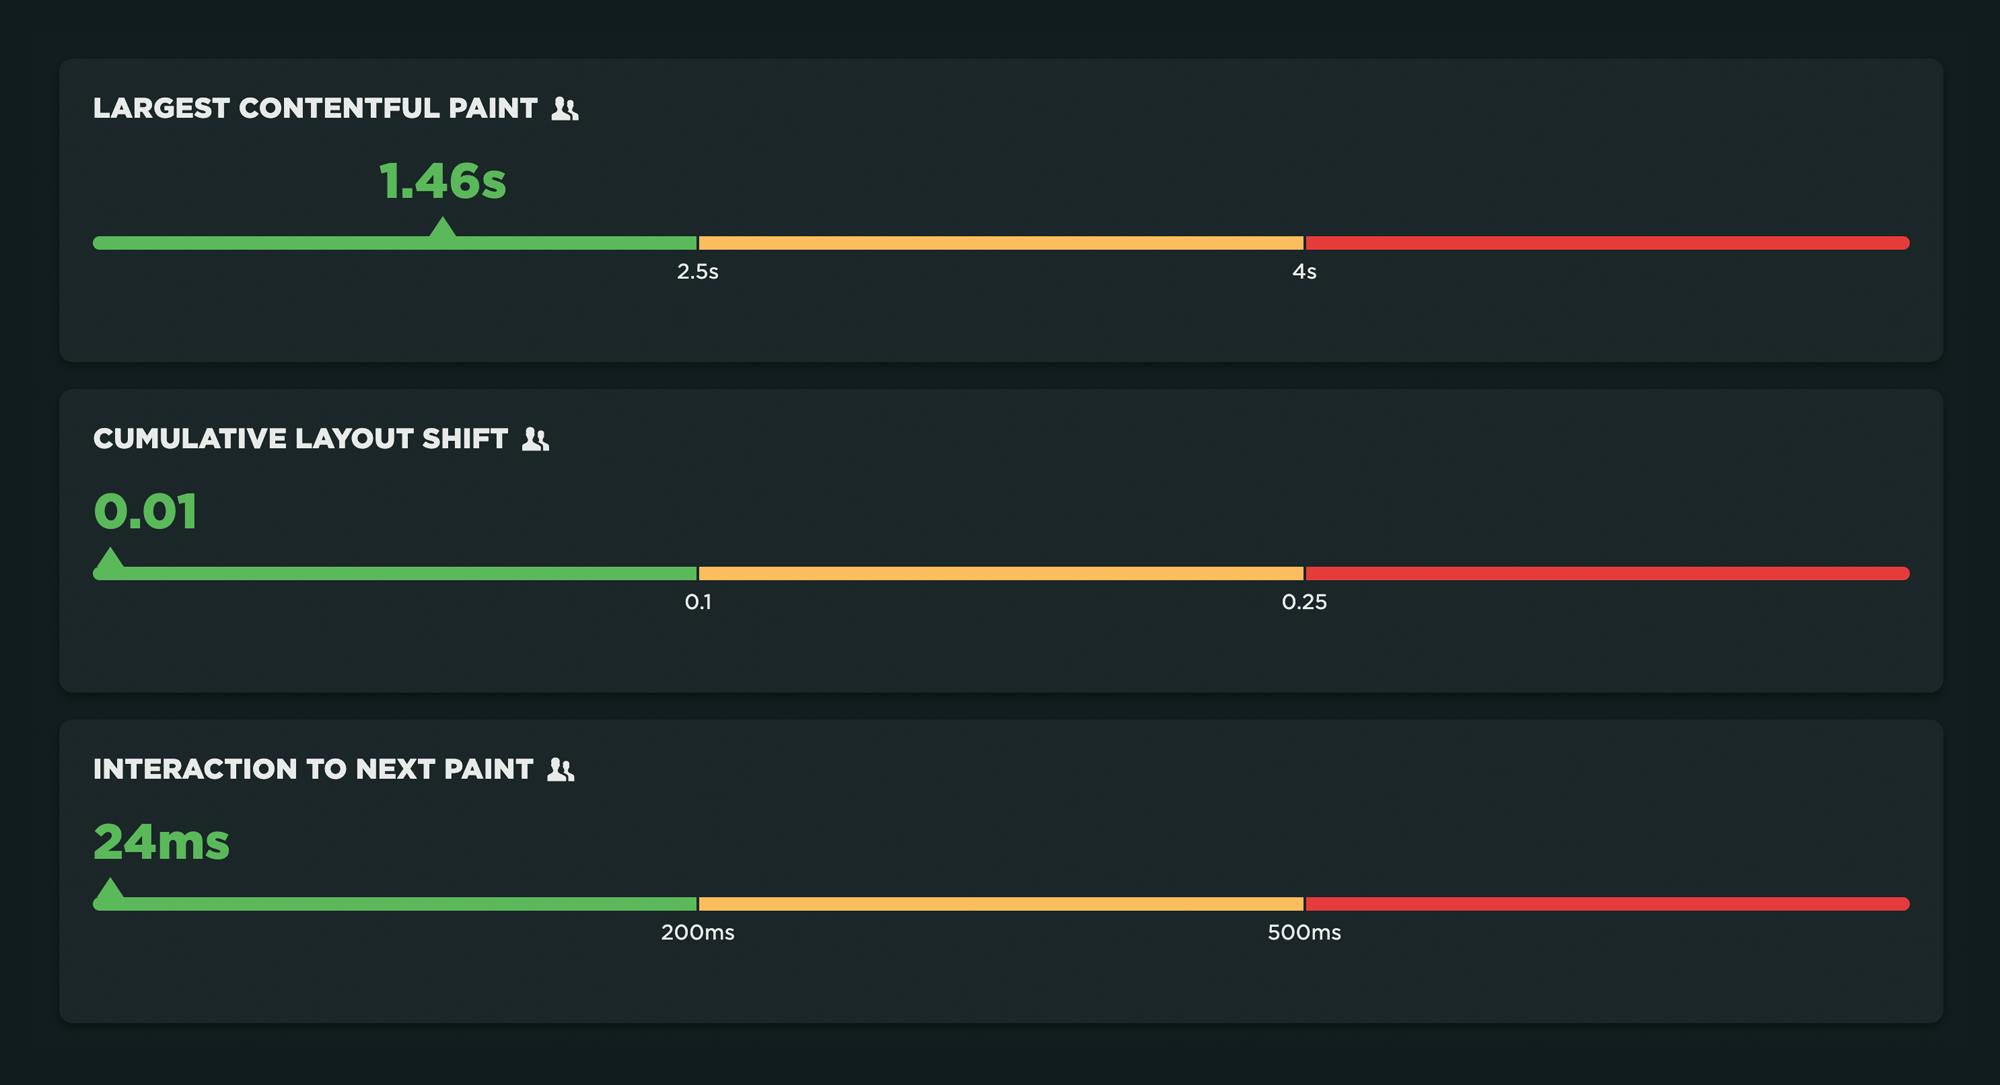
(If you're new to performance, Core Web Vitals is a set of three metrics – Largest Contentful Paint, Cumulative Layout Shift, and Interaction to Next Paint – that are intended to measure the rendering speed, interactivity, and visual stability of web pages.)
In this post, I'm going to highlight some of the discussion around the topic of Core Web Vitals and Safari, which was a major theme coming out of the recent web performance marathon in Amsterdam that included WebPerf Days, performance.sync(), and the main event, performance.now().
NEW: Vitals dashboard updates and filter improvements
Our development team recently emerged from an offsite with two wonderful improvements to SpeedCurve. The team tackled a project to unify our filtering, and then they over-delivered with a re-Vital-ized dashboard that I'm finding to be one of the most useful views in the product.
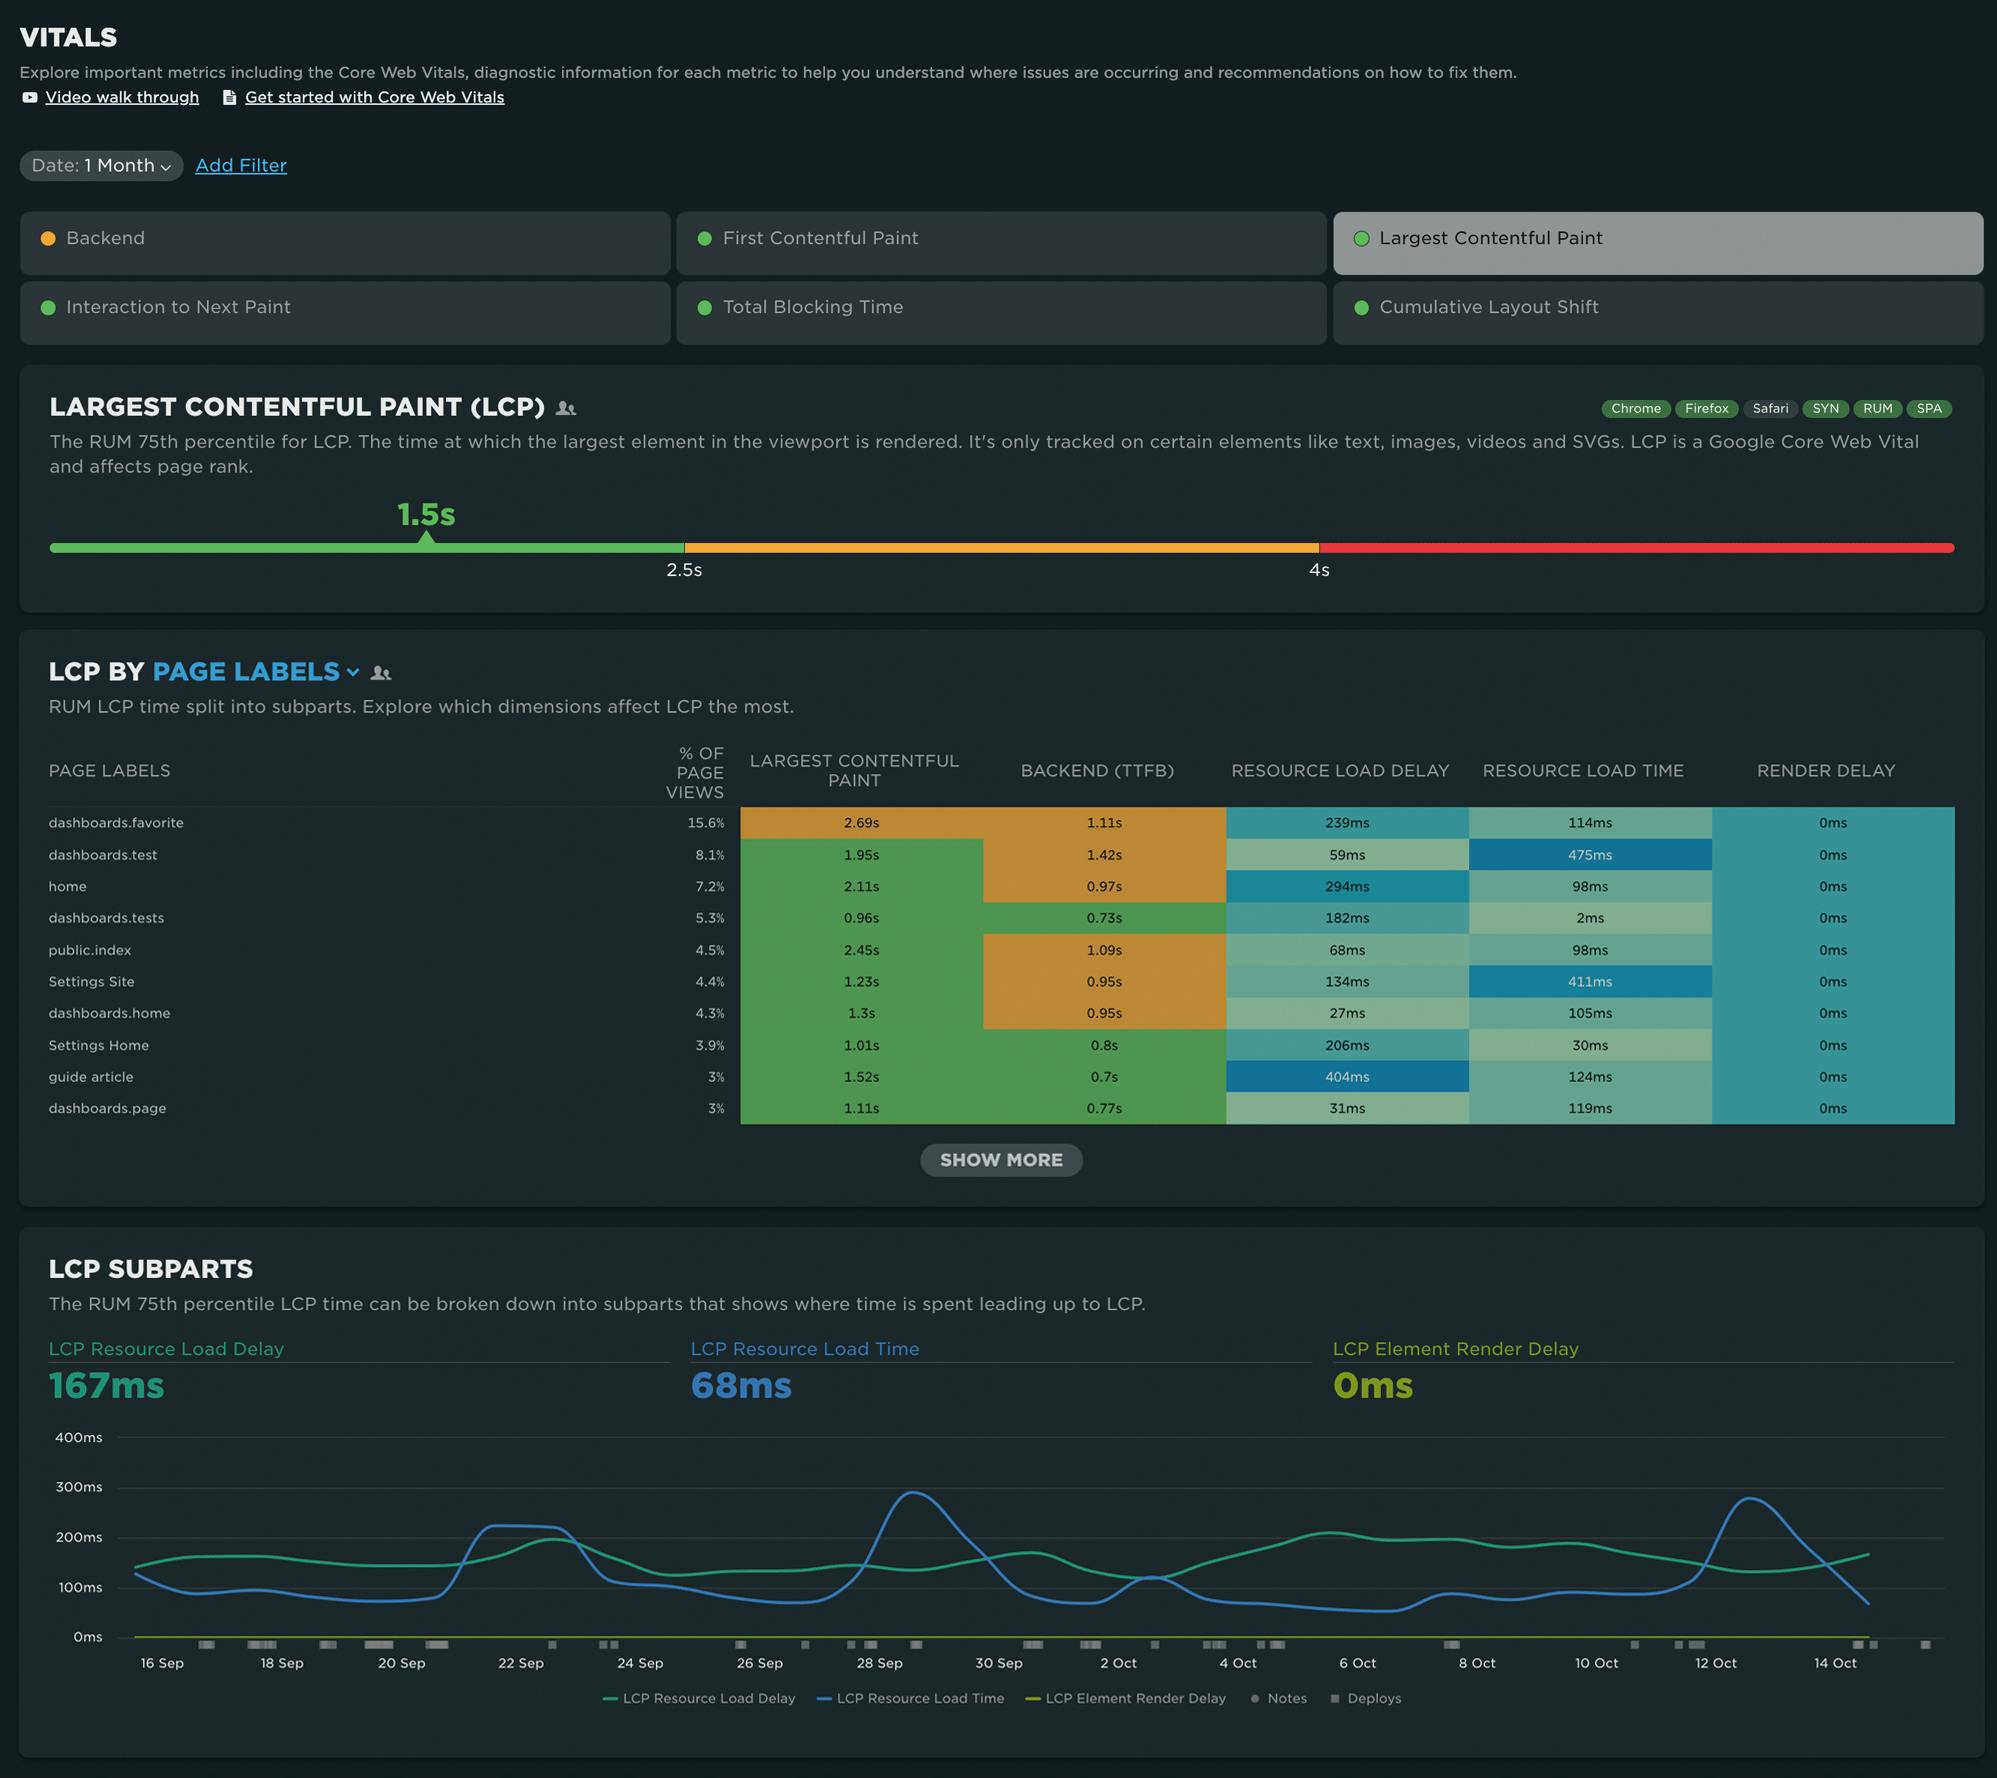
Take a look at the recent updates – and a big thank you to our amazing team for putting so much love into SpeedCurve!
How to provide better attribution for your RUM metrics

Here's a detailed walkthrough showing how to make more meaningful and intuitive attributions for your RUM metrics – which makes it much easier for you to zero in on your performance issues.
Real user monitoring (RUM) has always been incredibly important for any organization focused on performance. RUM – also known as field testing – captures performance metrics as real users browse your website and helps you understand how actual users experience your site. But it’s only in the last few years that RUM data has started to become more actionable, allowing you to diagnose what is making your pages slower or less usable for your visitors.
Making newer RUM metrics – such as Core Web Vitals – more actionable has been a significant priority for standards bodies. A big part of this shift has been better attribution, so we can tell what's actually going on when RUM metrics change.
Core Web Vitals metrics – like Largest Contentful Paint (LCP), Interaction to Next Paint (INP), and Cumulative Layout Shift (CLS) – all have some level of attribution associated with them, which helps you identify what exactly is triggering the metric. The LoAF API is all about attribution, helping you zero in on which scripts are causing issues.
Having this attribution available, particularly when paired with meaningful subparts, can help us to quickly identify which specific components we should prioritize in our optimization work.
We can help make this attribution even more valuable by ensuring that key components in our page have meaningful, semantic attributes attached to them.
NEW: Paper cuts update!
Paper cut: (literal) A wound caused by a piece of paper or any thin, sharp material that can slice through skin. (figurative) A trivial-seeming problem that causes a surprising amount of pain.

We all love big showy features, and this year we've released our share of those. But sometimes it's the small stuff that can make a big difference. We recently took a look at our backlog of smaller requests from our customers – which we labelled "paper cuts" – and decided to dedicate time to tackle them.
Are they all glamorous changes? Maybe not, though some are pretty exciting.
Are they worthy of a press release? Ha! We don't even know how to issue a press release.
Will they make your day better and put a smile on your face? We sure hope so.
In total, our wonderful development team tackled more than 30 paper cuts! These include:
- Exciting new chart types for Core Web Vitals and User Happiness
- Filter RUM data by region
- Create a set of tests for one or multiple sites or custom URLs
- Test directly from your site settings when saving changes
- Usability improvements
- Better messaging for test failures
- And more!
Keep scrolling for an overview of some of the highlights.
NEW: Improving how we collect RUM data
We've made improvements to how we collect RUM data. Most SpeedCurve users won't see significant changes to Core Web Vitals or other metrics, but for a small number of users some metrics may increase.
This post covers:
- What the changes are
- How the changes can affect Core Web Vitals and other metrics
- Why we are making the changes now
NEW: RUM attribution and subparts for Interaction to Next Paint!
Now it's even easier to find and fix Interaction to Next Paint issues and improve your Core Web Vitals.
Our newest release continues our theme of making your RUM data even more actionable. In addition to advanced settings, navigation types, and page attributes, we've just released more diagnostic detail for the latest flavor in Core Web Vitals: Interaction to Next Paint (INP).
This post covers:
- Element attribution for INP
- A breakdown of where time is spent within INP, leveraging subparts
- How to use this information to find and fix INP issues
- A look ahead at RUM diagnostics at SpeedCurve
A Complete Guide to Web Performance Budgets
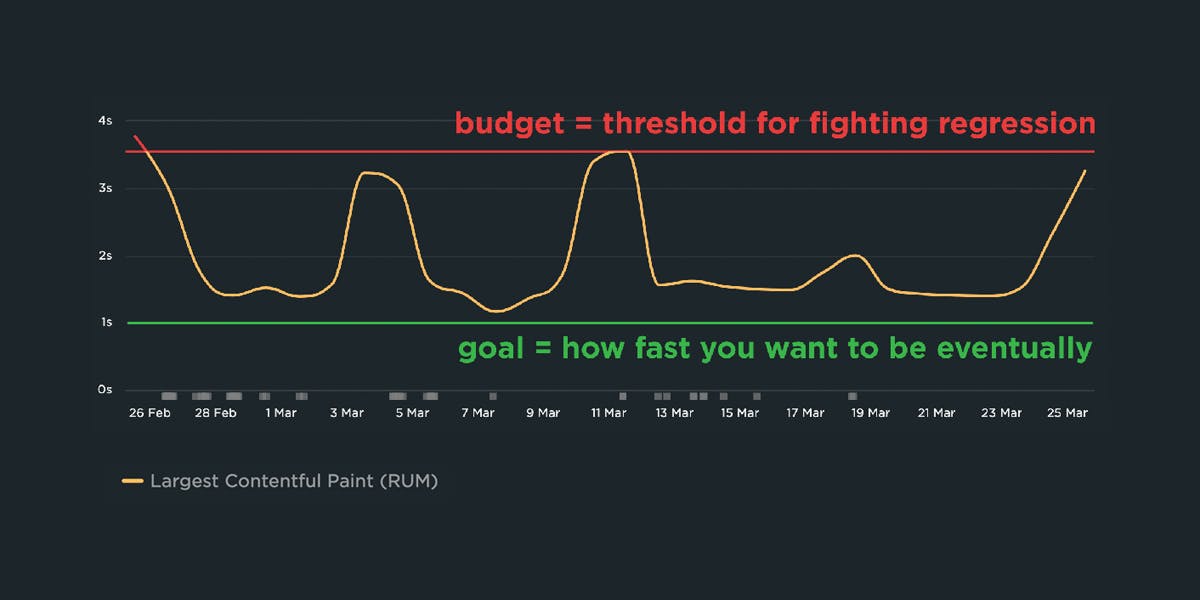
It's easier to make a fast website than it is to keep a website fast. If you've invested countless hours in speeding up your site, but you're not using performance budgets to prevent regressions, you could be at risk of wasting all your efforts.
In this post we'll cover how to:
- Use performance budgets to fight regressions
- Understand the difference between performance budgets and performance goals
- Identify which metrics to track
- Validate your metrics to make sure they're measuring what you think they are – and to see how they correlate with your user experience and business metrics
- Determine what your budget thresholds should be
- Focus on the pages that matter most
- Get buy-in from different stakeholders in your organization
- Integrate with your CI/CD process
- Synthesize your synthetic and real user monitoring data
- Maintain your budgets
This bottom of this post also contains a collection of case studies from companies that are using performance budgets to stay fast.
Let's get started!
Hello INP! Here's everything you need to know about the newest Core Web Vital

After years of development and testing, Google has added Interaction to Next Paint (INP) to its trifecta of Core Web Vitals – the performance metrics that are a key ingredient in its search ranking algorithm. INP replaces First Input Delay (FID) as the Vitals responsiveness metric.
Not sure what INP means or why it matters? No worries – that's what this post is for. :)
- What is INP?
- Why has it replaced First Input Delay?
- How does INP correlate with user behaviour metrics, such as conversion rate?
- What you need to know about INP on mobile devices
- How to debug and optimize INP
And at the bottom of this post, we'll wrap thing up with some inspiring case studies from companies that have found that improving INP has improved sales, pageviews, and bounce rate.
Let's dive in!
Debugging Interaction to Next Paint (INP)
Not surprisingly, most of the conversations I've had with SpeedCurve users over the last few months have focused on improving INP.
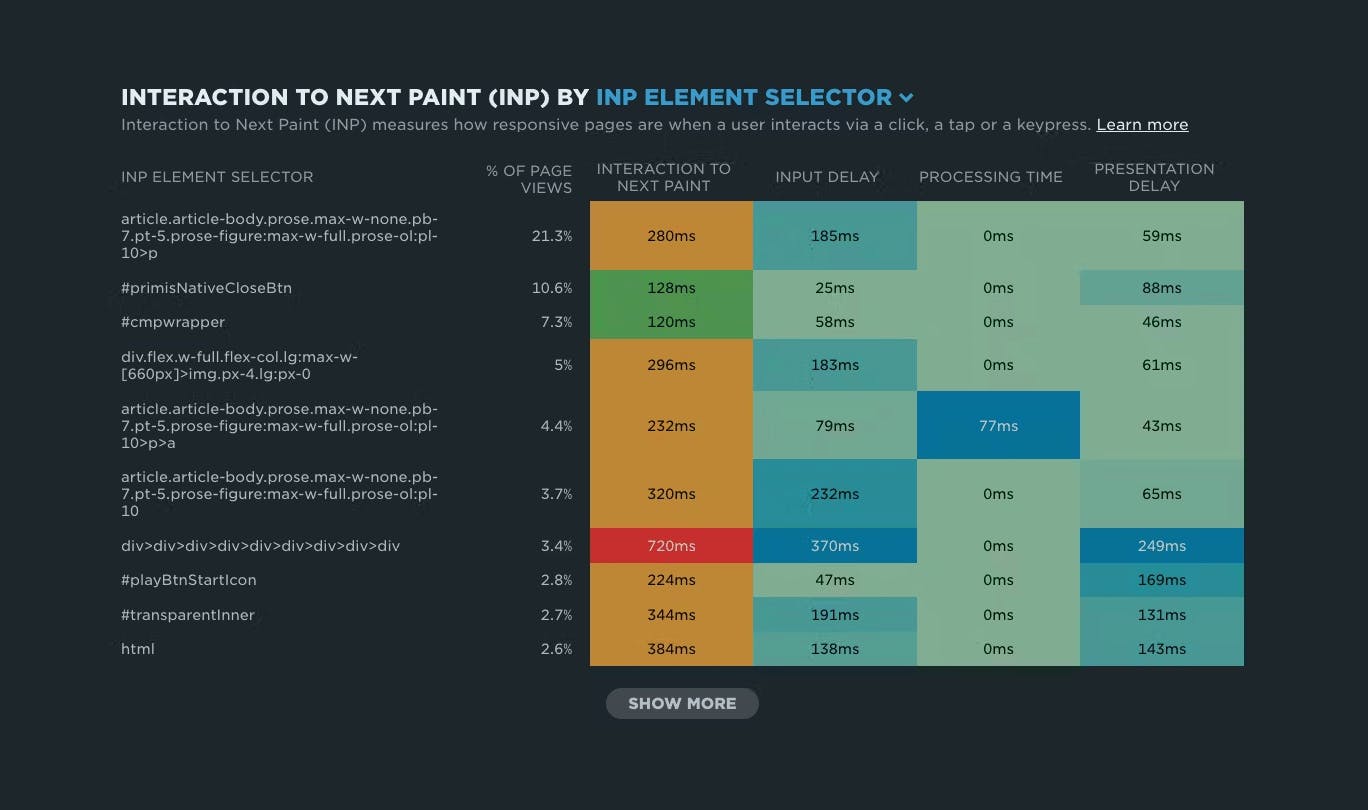
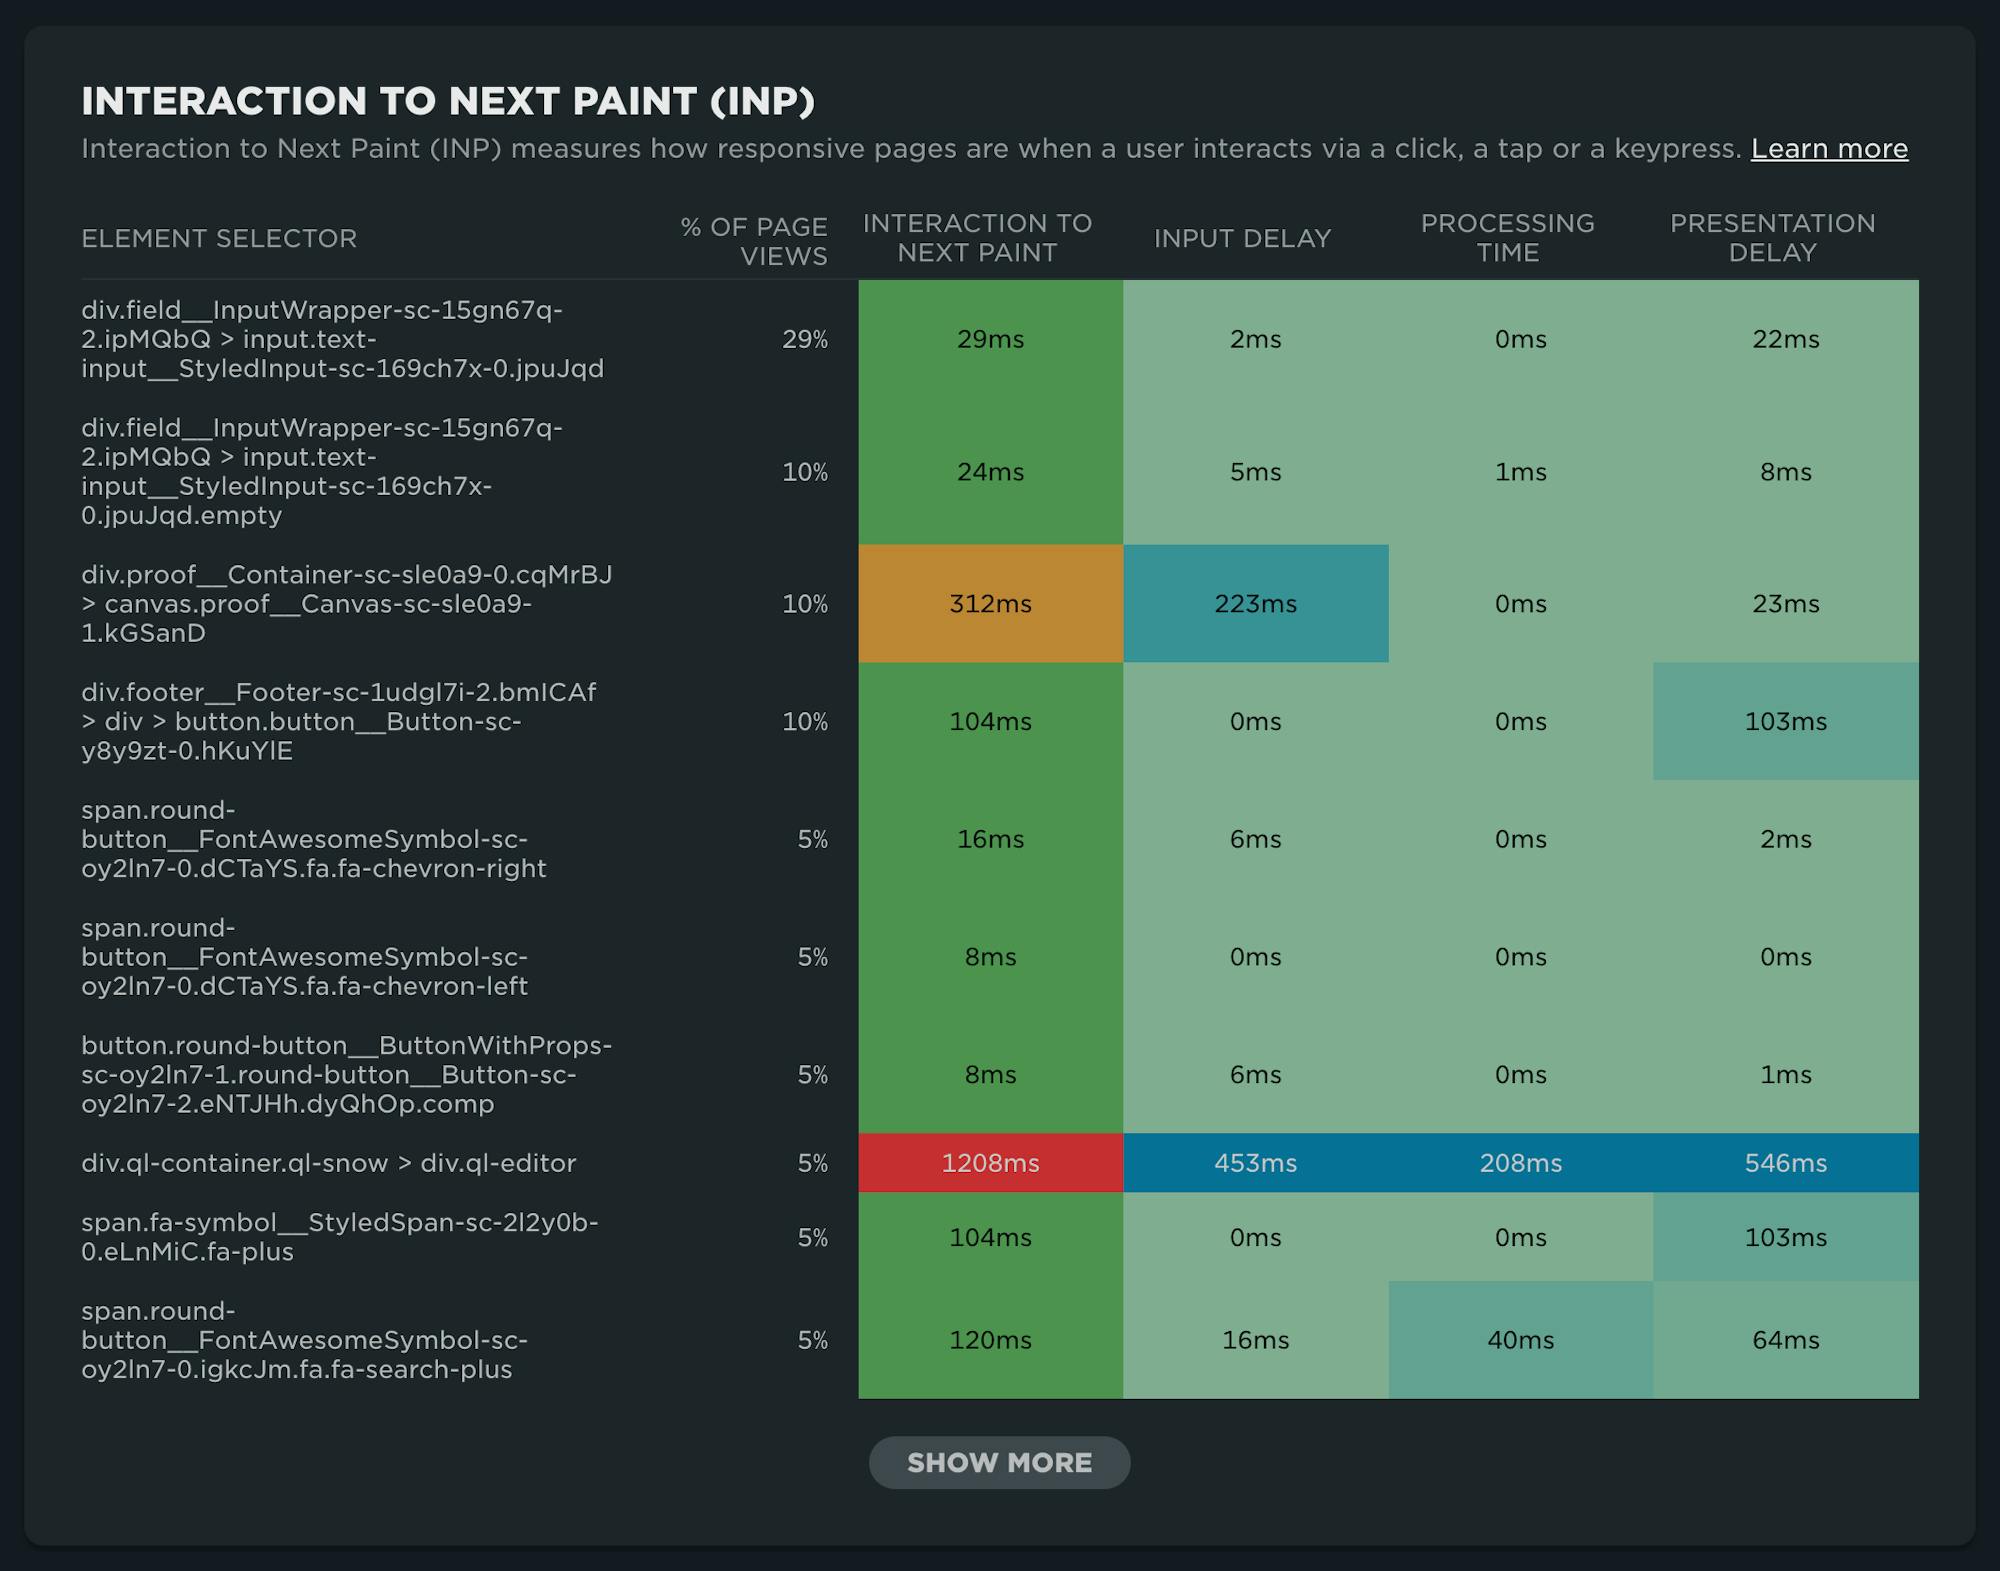
INP measures how responsive a page is to visitor interactions. It measures the elapsed time between a tap, a click, or a keypress and the browser next painting to the screen.
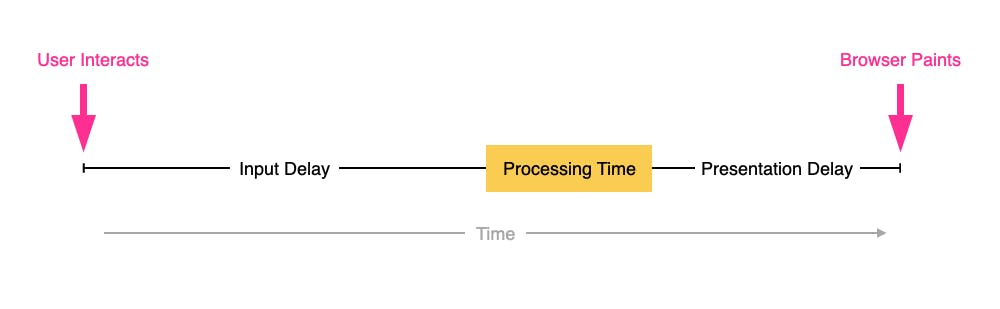
INP breaks down into three sub-parts
- Input Delay – How long the interaction handler has to wait before executing
- Processing Time – How long the interaction handler takes to execute
- Presentation Delay – How long it takes the browser to execute any work it needs to paint updates triggered by the interaction handler
Pages can have multiple interactions, so the INP time you'll see reported by RUM products and other tools, such as Google Search Console and Chrome's UX Report (CrUX), will generally be the worst/highest INP time at the 75th percentile.
Like all Core Web Vitals, INP has a set of thresholds:

INP thresholds for Good, Needs Improvement, and Poor
Many sites tend to be in the Needs Improvement or Poor categories. My experience over the last few months is that getting to Good is achievable, but it's not always easy.
In this post I'm going to walk through:
- How I help people identify the causes of poor INP times
- Examples of some of the most common issues
- Approaches I've used to help sites improve their INP