SpeedCurve is now part of the Embrace family! There are no changes to how you use our products. Our founder Mark shares what this means...
Mark+Steve, Performance+Design

I'm excited to announce that I've joined SpeedCurve!
When SpeedCurve was just a twinkle in Mark's eye, he contacted me about the concept and I encouraged him that a commercial version of WebPageTest was needed. When I saw the early versions of SpeedCurve, I was blown away. Mark presents traditional performance data in a way that is more compelling, revealing his strong design background.
Mark has pioneered this new territory where performance and design overlap. It's exciting to say "overlap". Many times there's little interaction between designers and performance engineers. When there is interaction, it can feel adversarial with no one wanting to give any ground. And yet, designers and performance engineers are after the same thing: creating a great user experience!
Design and performance are connected, like the yin and yang. They aren't opposing forces, but instead complement each other. Users want an experience that is rich and fast. The trick is figuring out how to do that. That's where SpeedCurve comes in.
Velocity: Better performance through better design

Improve web performance by improving your design process… it needs to be iterative, mindful, principled and visual.
At my third Velocity conference for the year (this time in beautiful Barcelona) my keynote presentation explored the ways in which a thoughtfully developed design process can lead to higher functioning teams and better web performance.
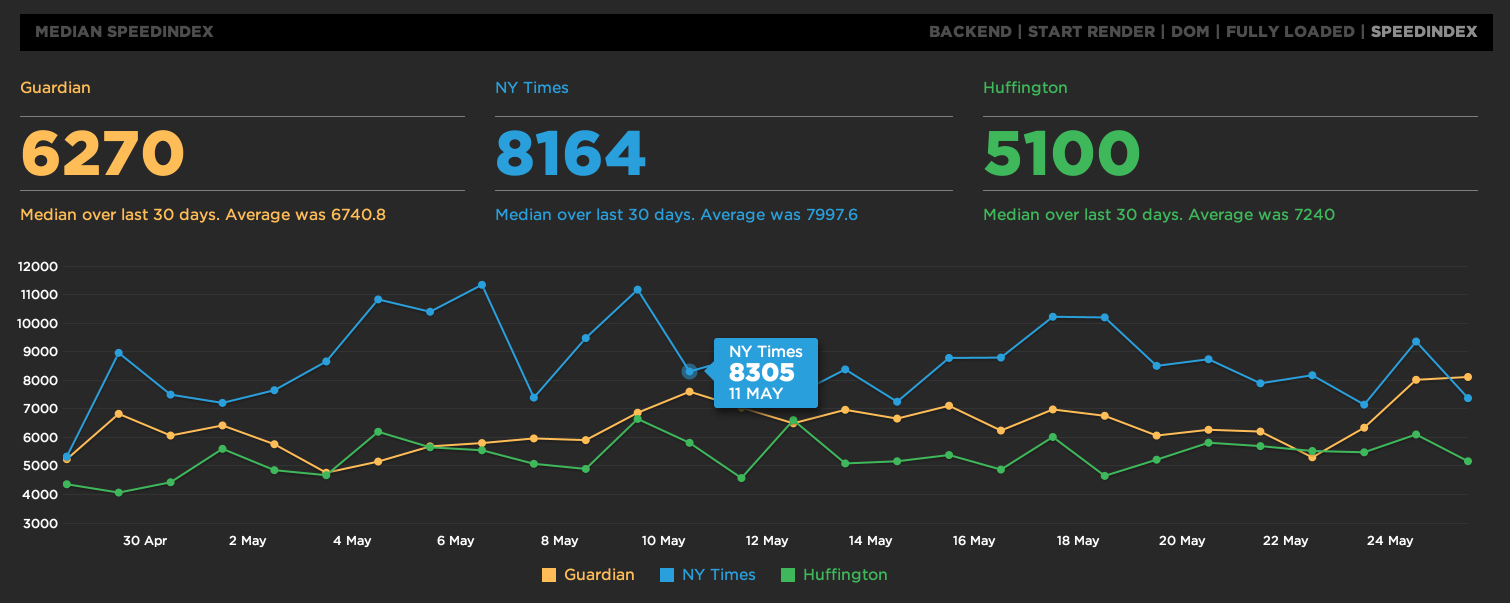
Velocity: A better waterfall chart
The way we visualize performance data can have an impact on how we interpret and communicate performance issues within our teams.
In this talk from Velocity New York I explored the importance of data visualization and presented some of my own explorations into re-imagining the classic waterfall chart which is the mainstay of front-end performance analysis.
Skip to 15:30 if you just want to see the data visualization experiments.
One of these experiments was also turned into a performance heatmap bookmarklet.
Velocity: Responsive in the wild
I was lucky enough to give a Lighting Demo at Velocity Conference in Santa Clara. The focus was on research I conducted into 250 responsive websites and how well optimized for performance they were.
Faster EC2 testing agents
As of the 1st of June SpeedCurve has switched to using faster testing agents at Amazon EC2 data centers. As web pages become more Javascript and resource heavy I've noticed more and more pages max out the CPU while performance testing.
Speed Index now available
Speed Index is now available on SpeedCurve. Choose "SpeedIndex" from the top right of the main graphs.
IE11 and average speed update
To keep inline with browser trends and average connection speeds SpeedCurve will begin updating the test setting every quarter.
For Q2 2014 we're switching to IE11 which is now the most popular version of IE according to Akamai and StatsCounter and the average connection speed has been updated to 9.8Mbps download, 2.5Mbps upload with a 10ms latency. The 9.8Mbps download speed is based on the latest State of the Internet report from Akamai.
SpeedCurve wins Webstock BNZ Start-Up Alley
![]()
I'm stoked that SpeedCurve has been chosen as one of two winners in the 2014 Webstock Start-Up Alley. I'll be using the 10k prize money and two flights to the US to attend Velocity Conf in San Fran in June and New York in September.
Performance tips for building responsive sites
The following article was originally published in the 2013 Performance Calendar. There's 31 great articles to explore in the calendar including Steve Souders's browser wishlist and Tim Kadlec's take on what it takes to create a performance culture.
----
Responsive Web Design (RWD) is now a well established technique yet it’s adoption is still surprisingly low. Guy Podjarny’s recent research shows that only one in eight websites is responsive. Often when responsive sites are designed the approach is primarily from a visual design perspective and teams struggle with the complexity of changing design and navigation patterns let alone any performance concerns, which become secondary. This can lead to serving the same sized assets to all browser widths resulting in a responsive site that is visually scaled but not performance optimised. On average responsive sites at 320 pixels wide are only 8% small than at 1600 pixels wide. Unsurprisingly these performance concerns and a lack of established techniques have made some hesitate when considering RWD adoption.
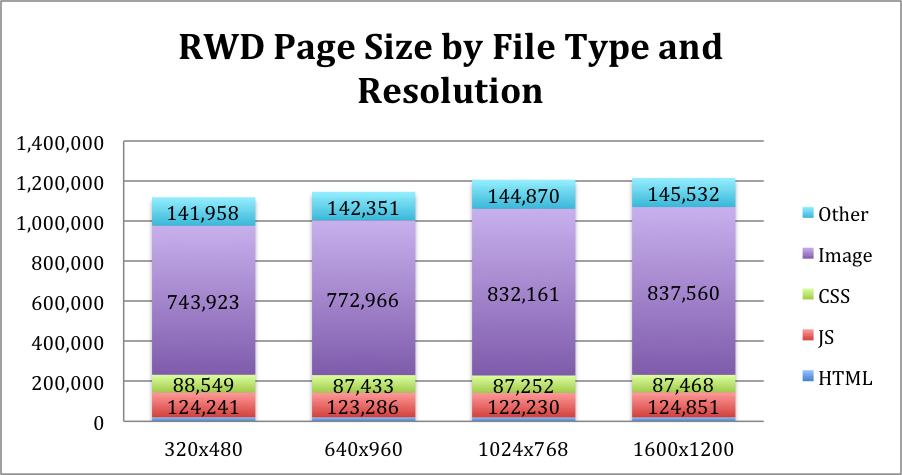
Responsive page sizes across different screen resolutions. Source: Guy Podjarny
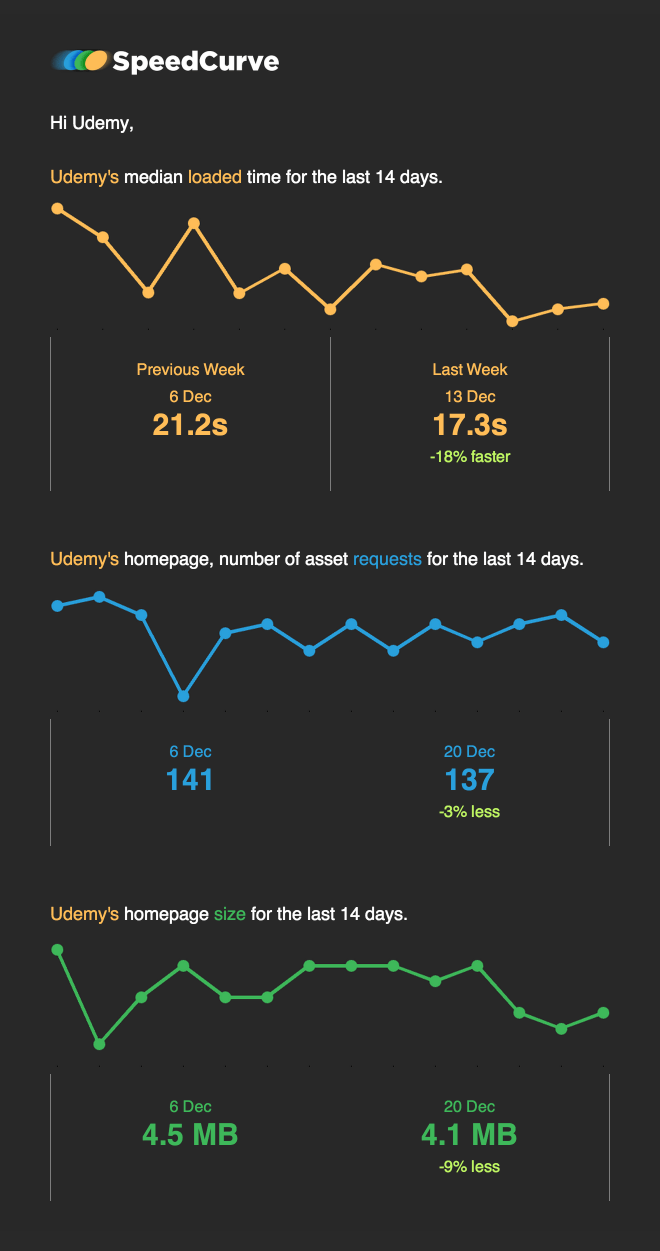
New weekly emails
I've redesigned the weekly email reports to provide more trending information so you can compare week on week performance improvements. They're nice simple visualizations for forwarding around your whole team.