When to use CrUX, RUM, and Synthetic web performance monitoring
"Should I use synthetic monitoring, real user monitoring, or CrUX?" We hear this question a lot. It's important to know the strengths and limitations of each monitoring tool and what they’re best used for, so we don’t miss out on valuable insights.

This post includes:
- How synthetic and real user monitoring (RUM) work
- What is CrUX?
- Is CrUX a substitute for RUM?
- When and why to use each tool
- An obscure cheese metaphor
- Plus a quick survey question at the end!
How do Long Animation Frames affect user behavior?
What's the point of a performance metric that doesn't align with user behavior – and ultimately business outcomes? Looking at four different retail sites, we compared each LoAF metric for desktop and mobile and correlated it to conversion rate. We saw some surprising trends alongside some expected patterns.
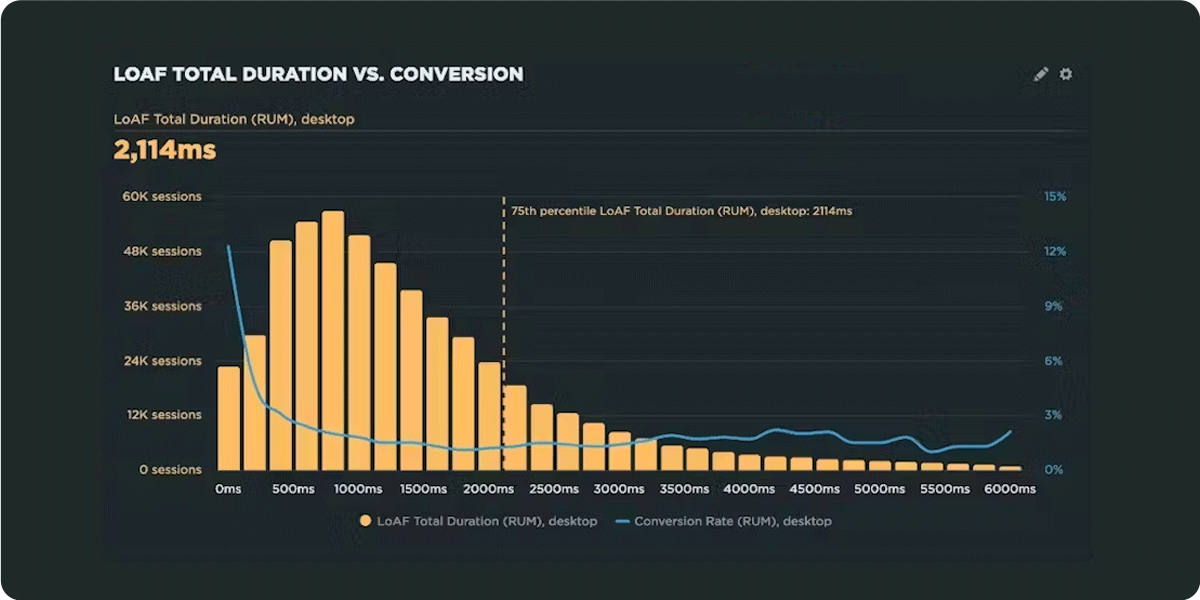
We recently shipped support for Long Animation Frames (LoAF). We're buzzing with excitement about having better diagnostic capabilities, including script attribution for INP and our new experimental metric, Total Blocking Duration (TBD).
While Andy has gone deep in the weeds on LoAF, in this post let's put the new set of metrics to the test and see how well they reflect the user experience. We'll look at real-world data from real websites and find an answer to the question: How do Long Animation Frames affect user behavior?
Performance Hero: Harry Roberts
This month's performance hero is someone who's helped some of the biggest brands in the world speed up their sites – and who generously shares his wealth of experience with the performance community through articles, videos, and conference talks. Thank you for everything you do, Harry Roberts!

What we love about Harry is that he's both an idealist who believes in delivering great user experiences, and a pragmatist who knows how to measure the impact of site speed on businesses.
Harry and I recently had what we jokingly called a fireside chat. As a SpeedCurve power user with his clients, Harry had a lot of great feedback and insights into how he uses our tools. But our conversation was actually much broader, so I thought a lot of folks might be interested to hear Harry's thoughts about performance in general. I also thought it would be great to give him long-overdue kudos as this month's Performance Hero!
Keep scrolling to watch the video of our chat and hear why Harry had the following things to say:
- Your e-commerce site should not be built with JavaScript. It should not be a SPA.
- Sites that have gone all in on JavaScript are slower and more difficult and more expensive to make fast.
- Nearly every website on the planet that is a SPA shouldn't be.
- No one really wants the fastest website. They want the most effective website.
- The number of product images on a page has a direct relationship to conversion rate. There's a sweet spot between too few and too many. You'll have to watch the video to learn what that sweet spot is. ;)
- A/B testing is an essential tool in your performance toolkit.
- Using RUM is probably the biggest predictor of the success of a site.
- Headless commerce and headless content are great for the developer experience and terrible for the user experience.
- Don't optimize Core Web Vitals for SEO. Optimize for user experience.
- Too many people don't realize that Core Web Vitals and CrUX are completely different things.
- Core Web Vitals are only one part of the much bigger performance picture.
NEW! A better way to manage performance budgets in SpeedCurve
We've made a major update to how you create, manage, and monitor performance budgets in SpeedCurve – and we think you're going to love it.
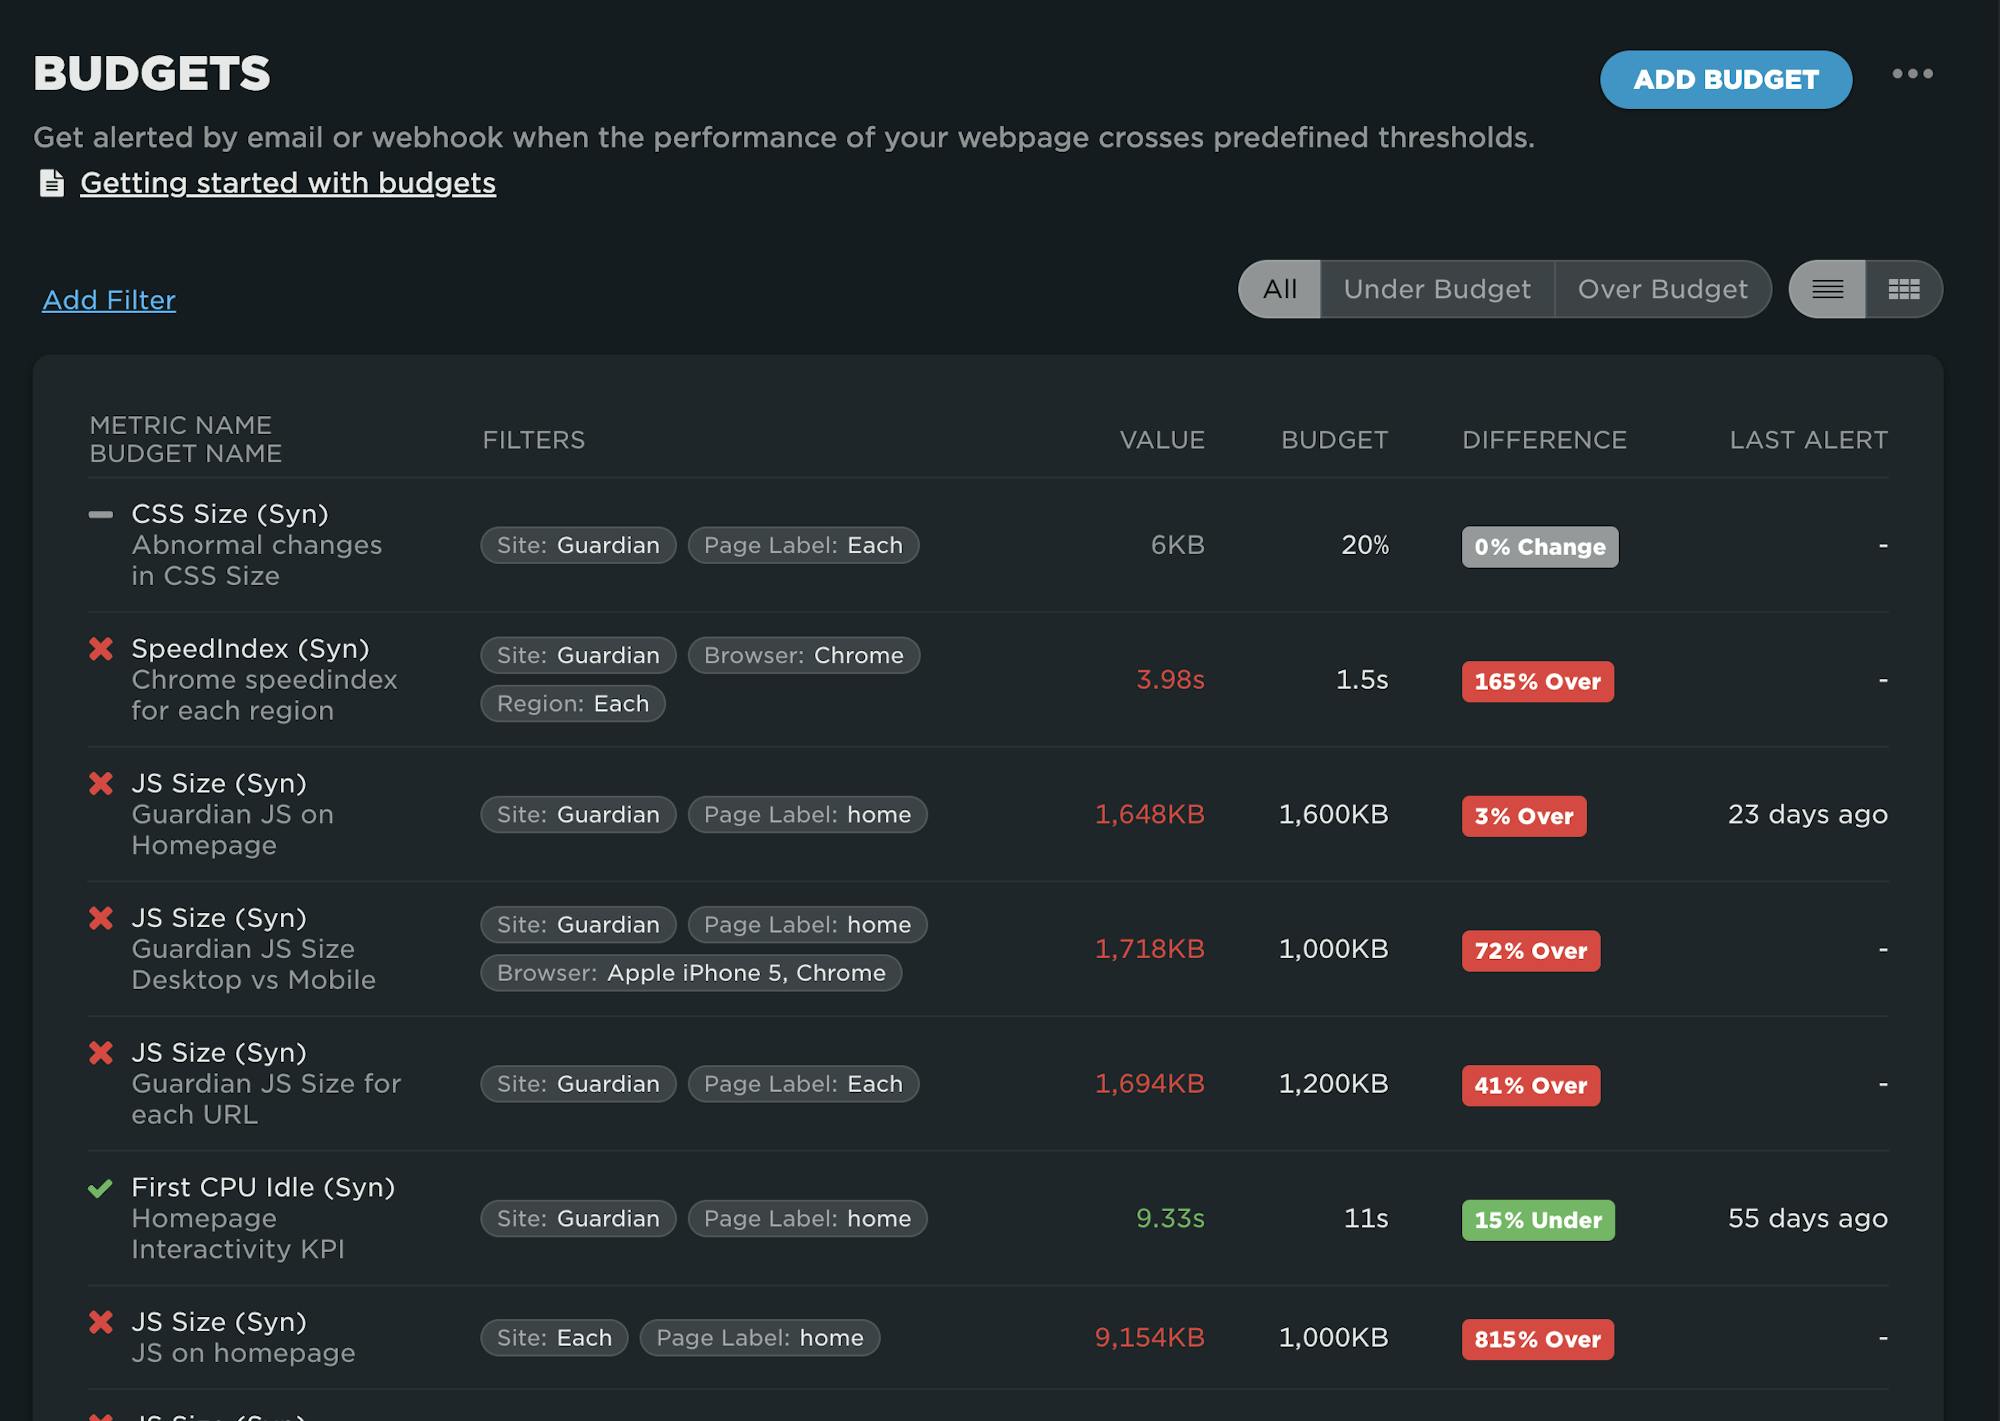
Until now, performance budgets lived inside your Favorites dashboards. That worked well for surfacing budget charts in context with the rest of your performance data, but it made managing budgets frustrating because they were spread all over your Favorites dashboards.
To fix this issue, we've moved performance budget management into its own dedicated Budgets dashboard. This change unlocks powerful new capabilities and makes tracking your performance thresholds and goals easier and more intuitive than ever.
NEW! SpeedCurve RUM for your Magento projects
Now you can integrate robust real user monitoring into your Magento project in minutes!

As a product manager, I have to say there are few things more flattering than having our users build apps that empower other folks to use our product.
Hot on the heels of our SpeedCurve RUM for Shopify app is a new open‑source Magento module – from Jesper Ingels and the awesome team at Bluebird Day – that lets you integrate SpeedCurve real user monitoring into your Magento project in minutes – no coding required!
Keep reading to learn the benefits of gathering real user data and how to get started.
How to enable SpeedCurve in your Shopify store
SpeedCurve now has a Shopify app to make installing and using SpeedCurve in your Shopify store much easier. With this app, you can quickly set up real user monitoring – no coding required.
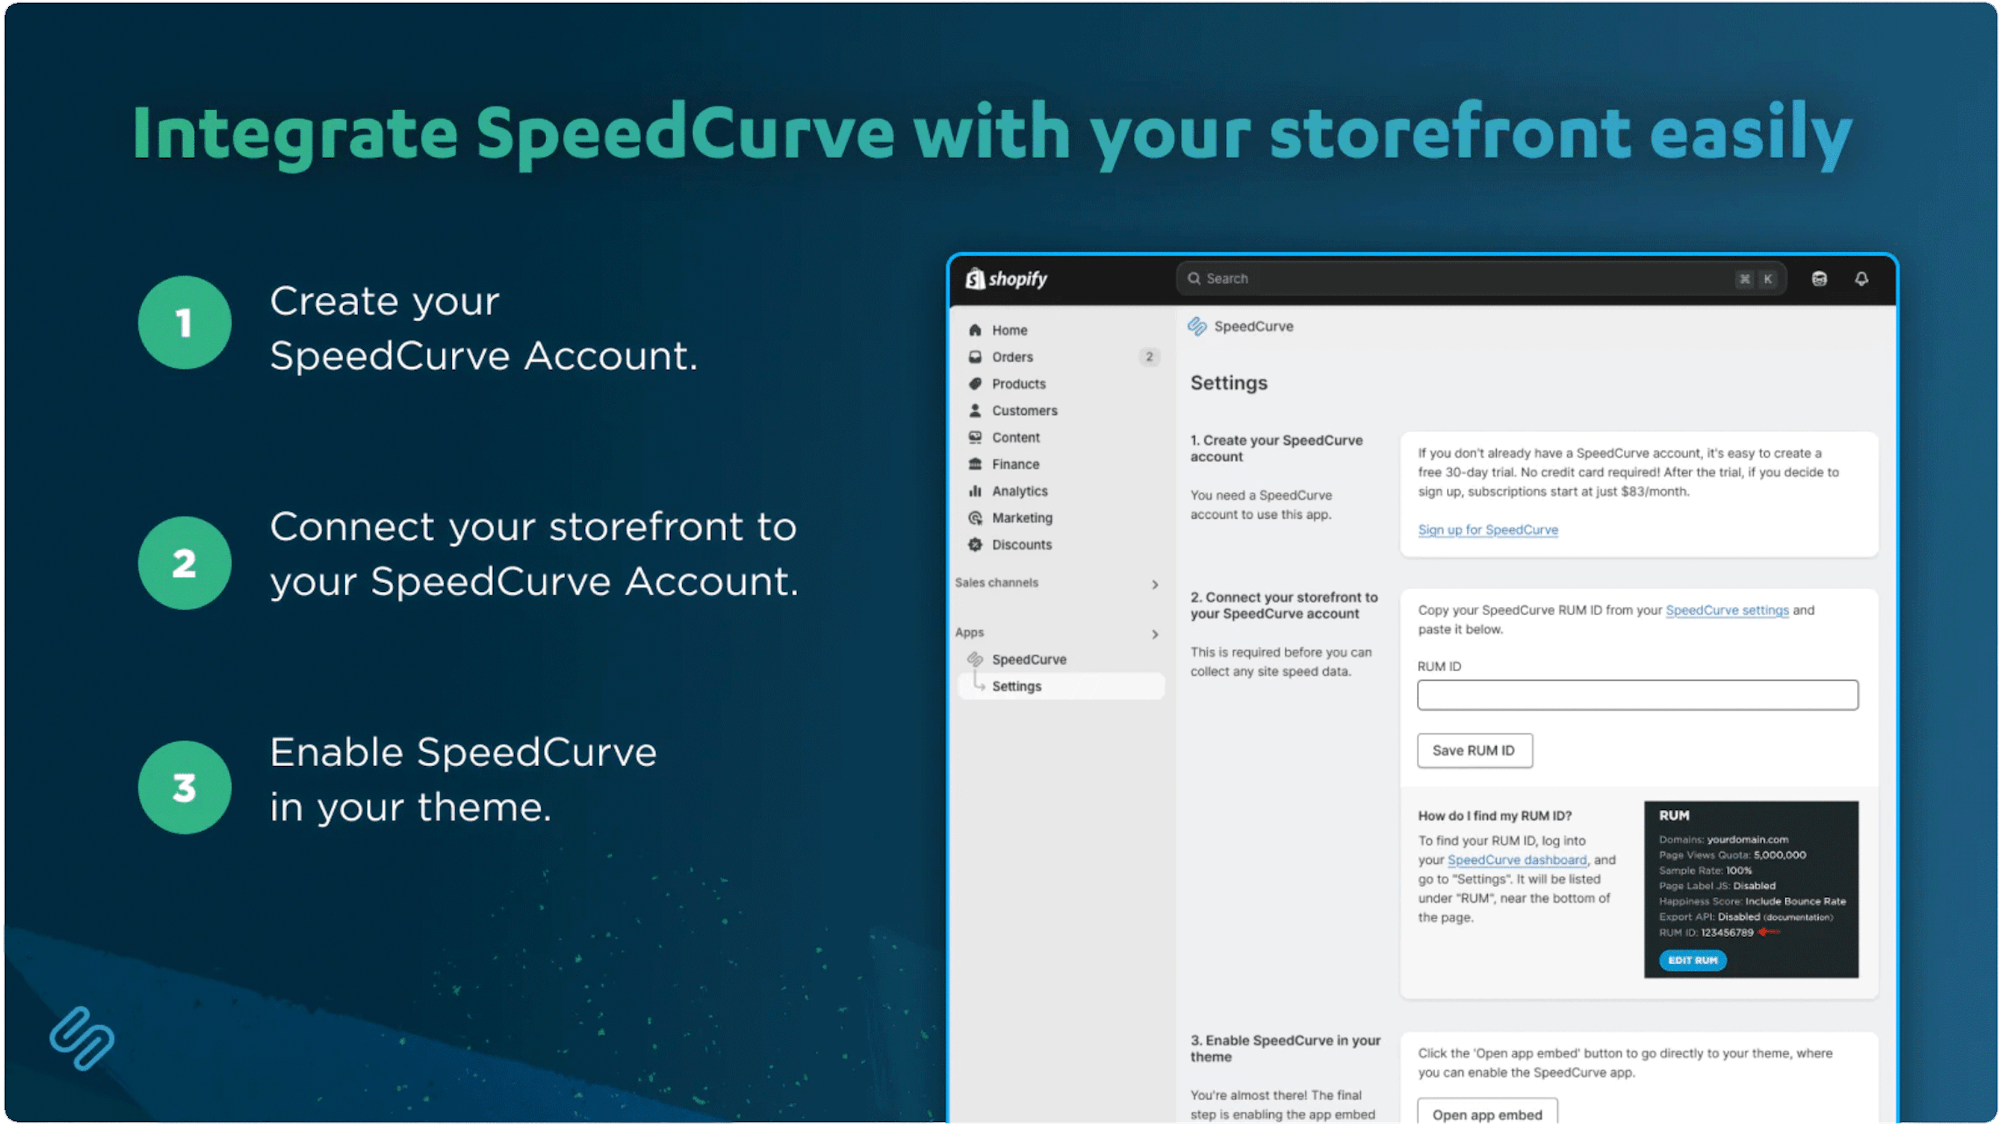
Here's how to install the SpeedCurve RUM app in your Shopify store, along with troubleshooting and next steps.
NEW! SpeedCurve RUM for your Shopify store
If you run a Shopify store, you already know how critical it is to provide a seamless shopping experience. That's why I was so excited when the folks at SpeedCurve asked me to draw on my Shopify experience to build their new RUM app for Shopify storefronts. Now I'm here to let you know how it works and why it's an important part of your UX toolset.
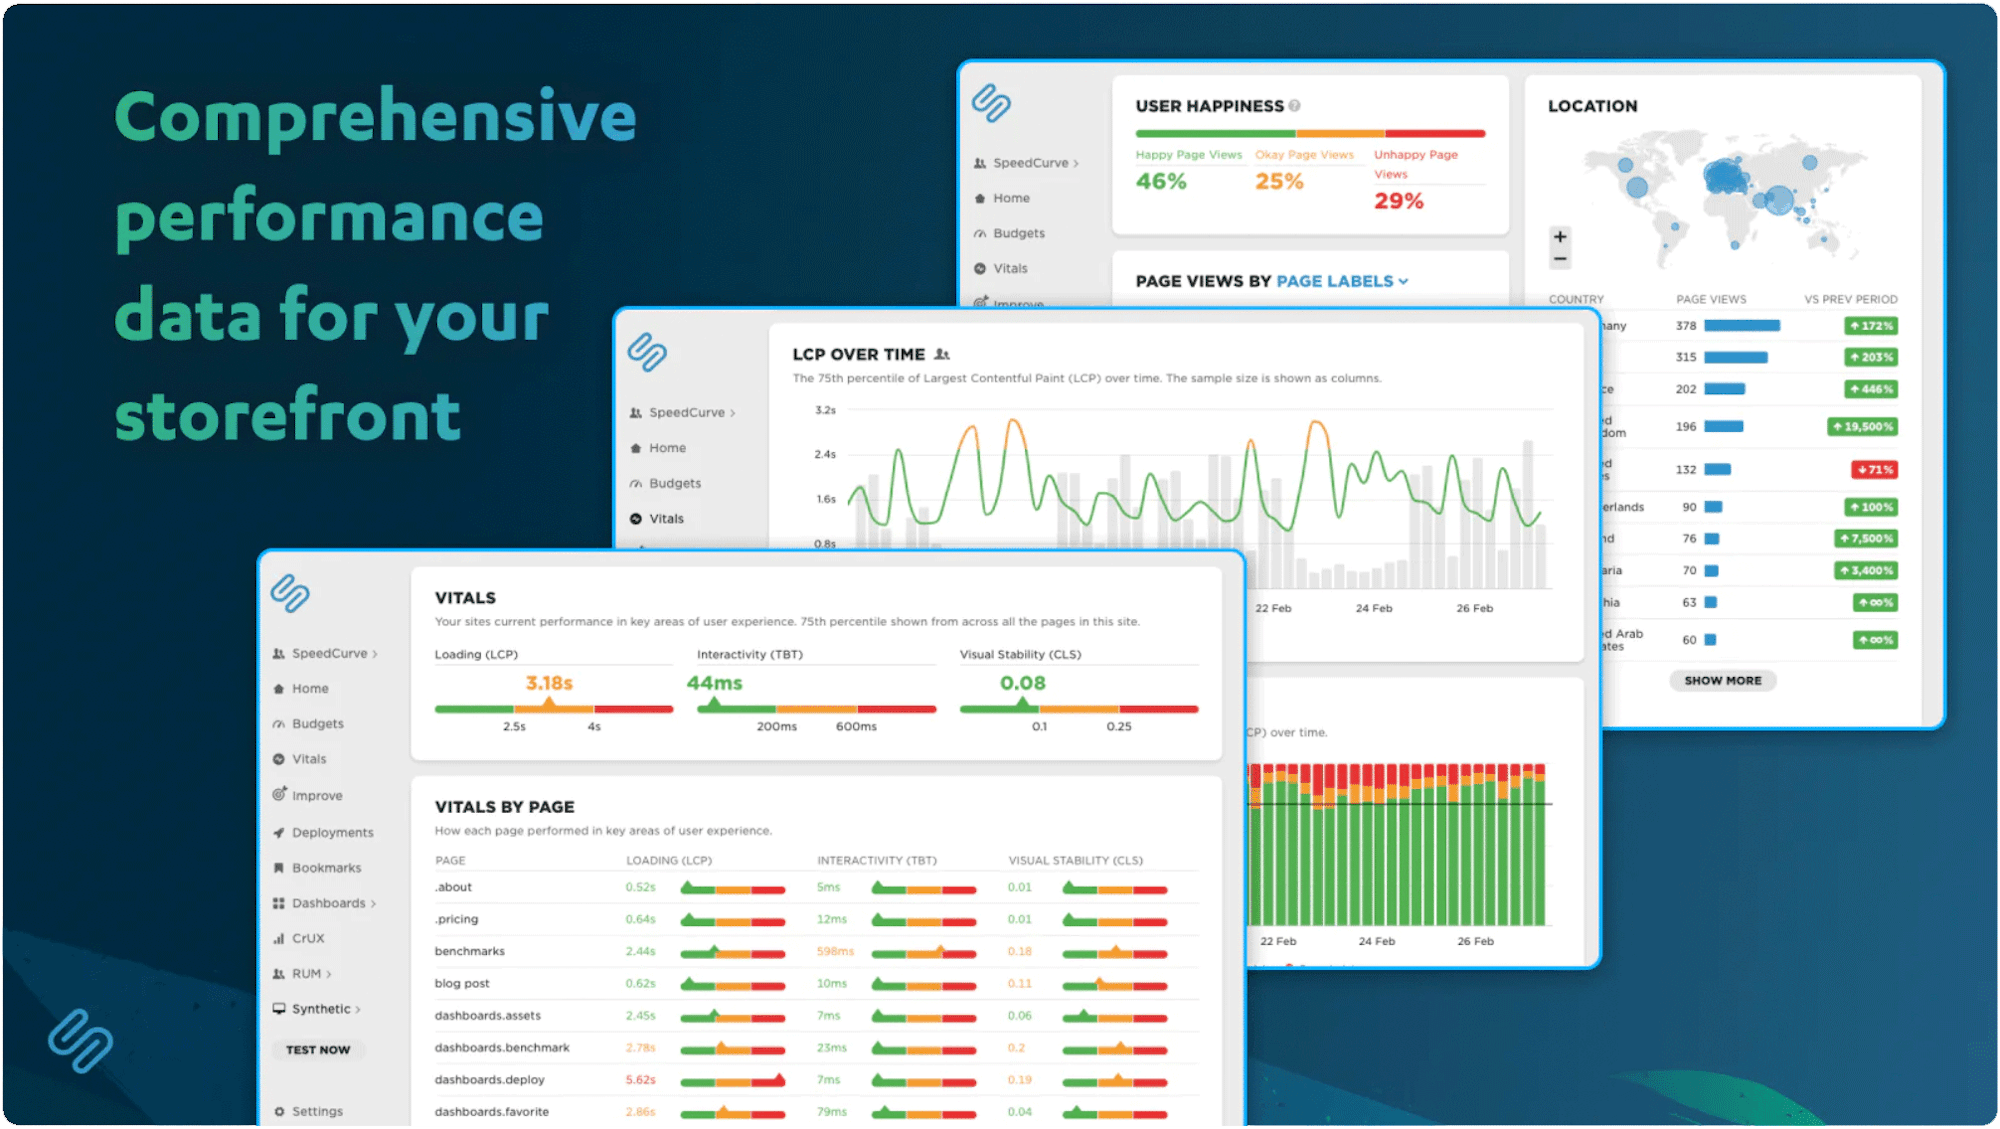
In ecommerce, speed isn’t just nice to have – it’s a competitive advantage. Slow websites lead to frustrated users, lost sales, and damaged brand trust.
With the SpeedCurve RUM app, you can track metrics like Core Web Vitals, identify performance issues, measure the impact of site speed on conversion rates, and stay ahead of page slowdowns – no coding required.
The Definitive Guide to Long Animation Frames (LoAF)
With Long Animation Frames (commonly referred to as LoAF, pronounced 'LO-aff') we finally have a way to understand the impact of our code on our visitors' experiences.
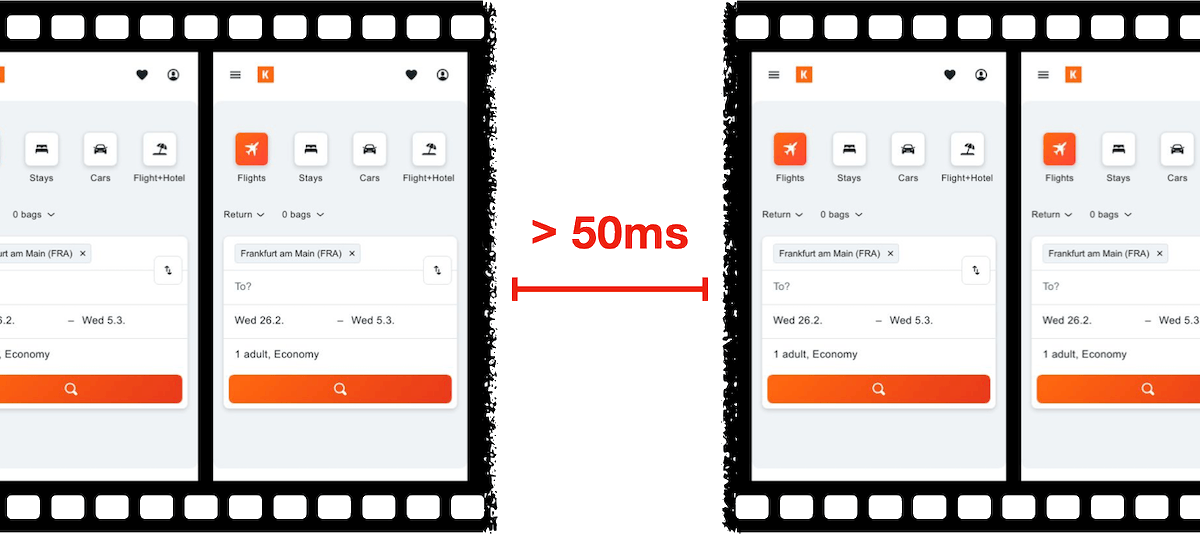
Long Animation Frame – a frame that took longer then 50ms from its start to when it started painting
LoAF allows us to understand how scripts and other tasks affect both hard and soft navigations, as well as how scripts affect interactions. Using the data LoAF provides, we can identify problem scripts and target changes that improve our visitors' experience. We can also finally start to quantify the impact of third-party scripts as they execute in our visitors' browsers.
Keep reading to learn:
- Why animation frame rate matters
- Anatomy of a Long Animation Frame
- Key LoAF milestones and what we can do with milestone data
- Script attribution (and why script details might sometimes be unavailable)
- How to match script data to Interaction to Next Paint, including sub-parts
- How to capture LoAF entries
- Getting started with LoAF
- LoAF support in SpeedCurve
NEW! Monitor Long Animation Frames and get to the bottom of your JavaScript issues
CPU consumption by the browser is one of the main causes – if not the number one cause – of a poor user experience. The primary culprit? JavaScript execution. Now you can use SpeedCurve to monitor Long Animation Frames (LoAFs) and fix the third parties and other scripts that are hurting your page speed.
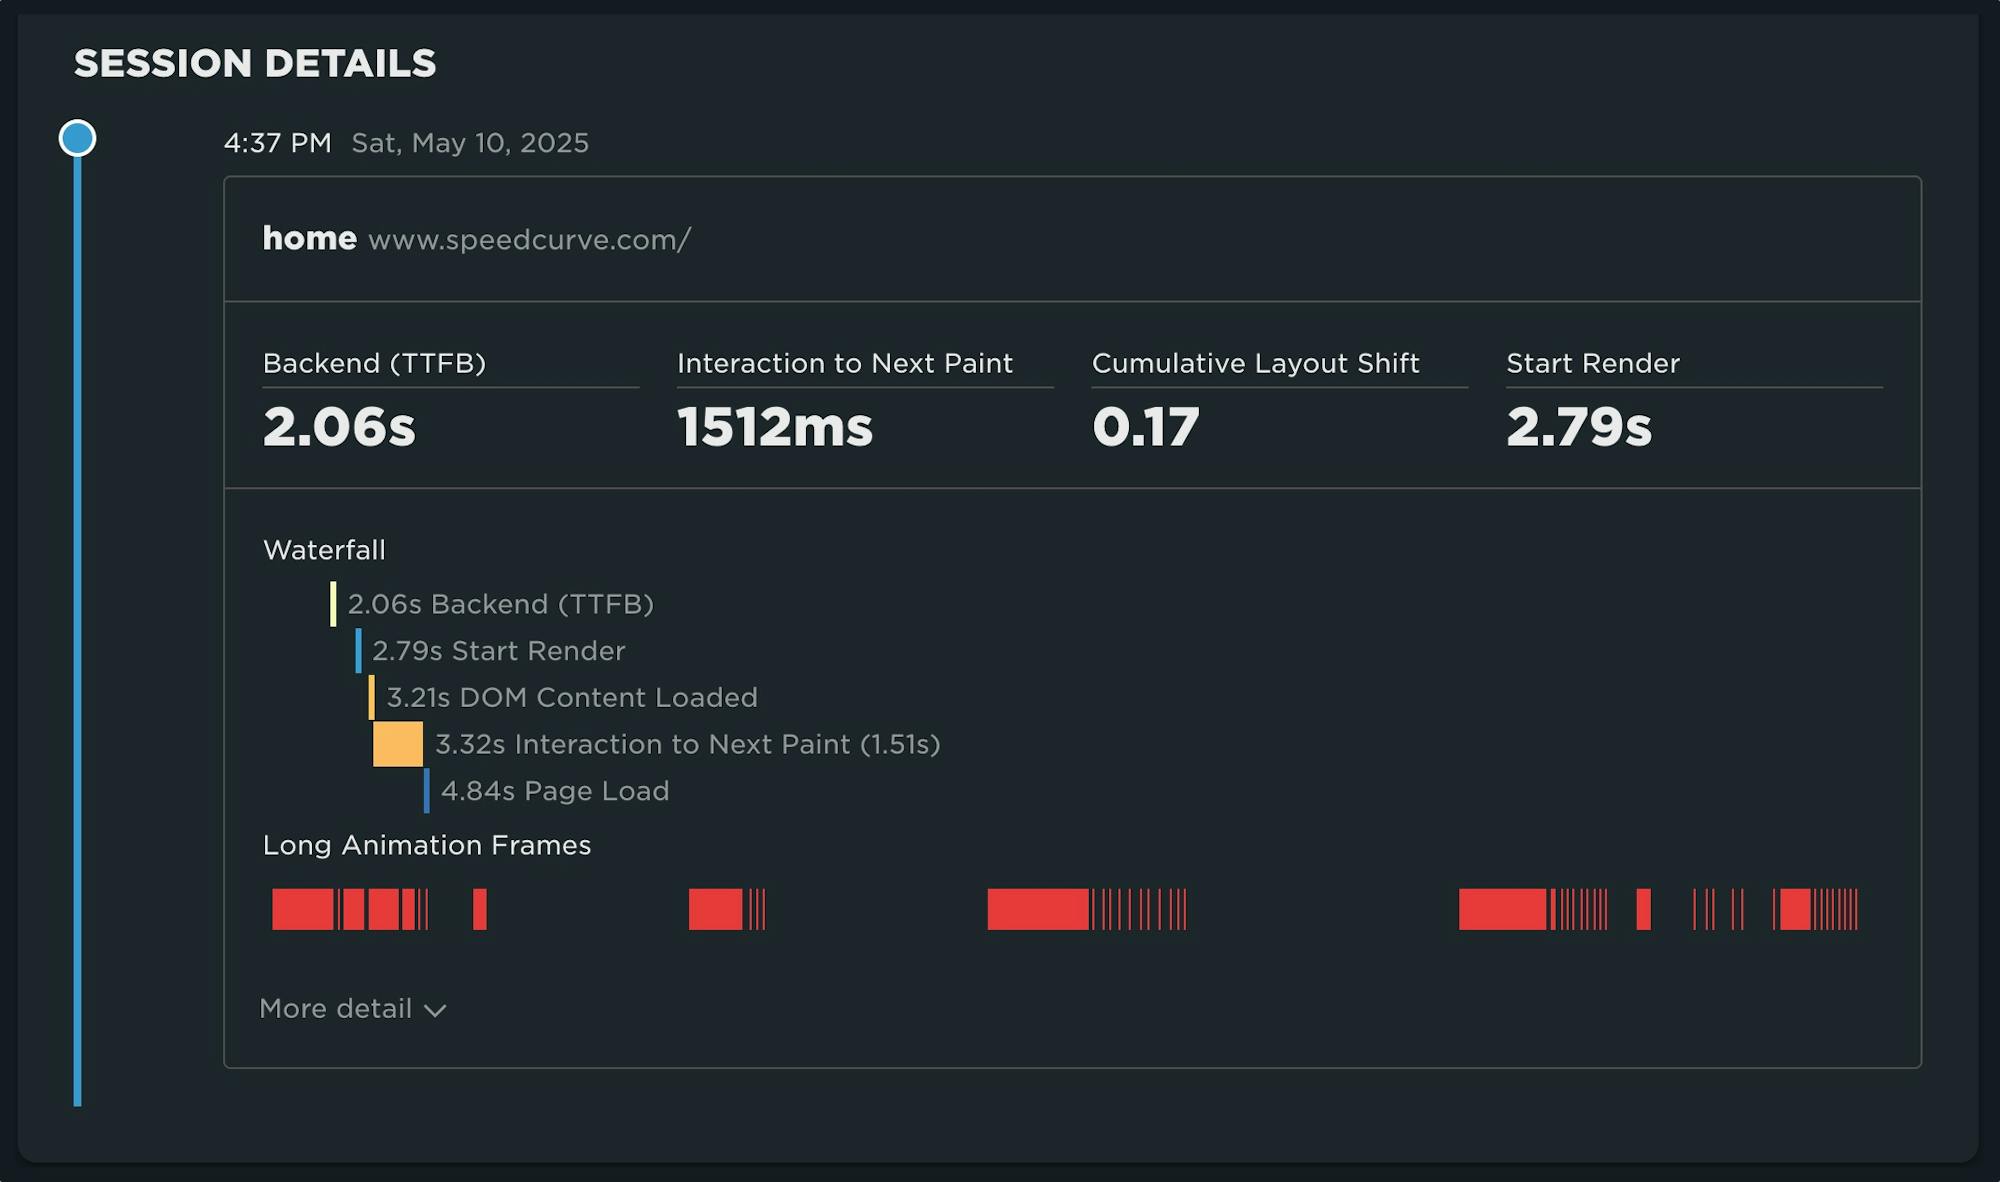
Until recently, we've had little evidence from the field that definitively attributes the root cause of rendering delays. While JavaScript Long Tasks gave us a good indication that there were blocking tasks affecting metrics such as Interaction to Next Paint and Largest Contentful Paint, there was no way to attribute the work or understand how it was ultimately affecting rendering.
Fortunately, we've gotten a lot of help from Chrome in improving the attribution – and ultimately the actionability – of the data we collect in the field with RUM. The introduction of the Long Animation Frames API (LoAF) not only gives us better methods for understanding what's happening on the browser's main thread, in some cases it also gives us attribution to both first- and third-party scripts that occur during a LoAF.
This has been a highly anticipated addition to SpeedCurve, which is available for all our RUM users today. This post covers what's new in the product and points you to a few new resources to help you get up to speed on all things related to LoAF.
Why you need to know your site's performance plateau (and how to find it)
Have you ever wondered why your site got faster, but your business and user engagement metrics didn't improve? The answer might lie on the performance plateau.
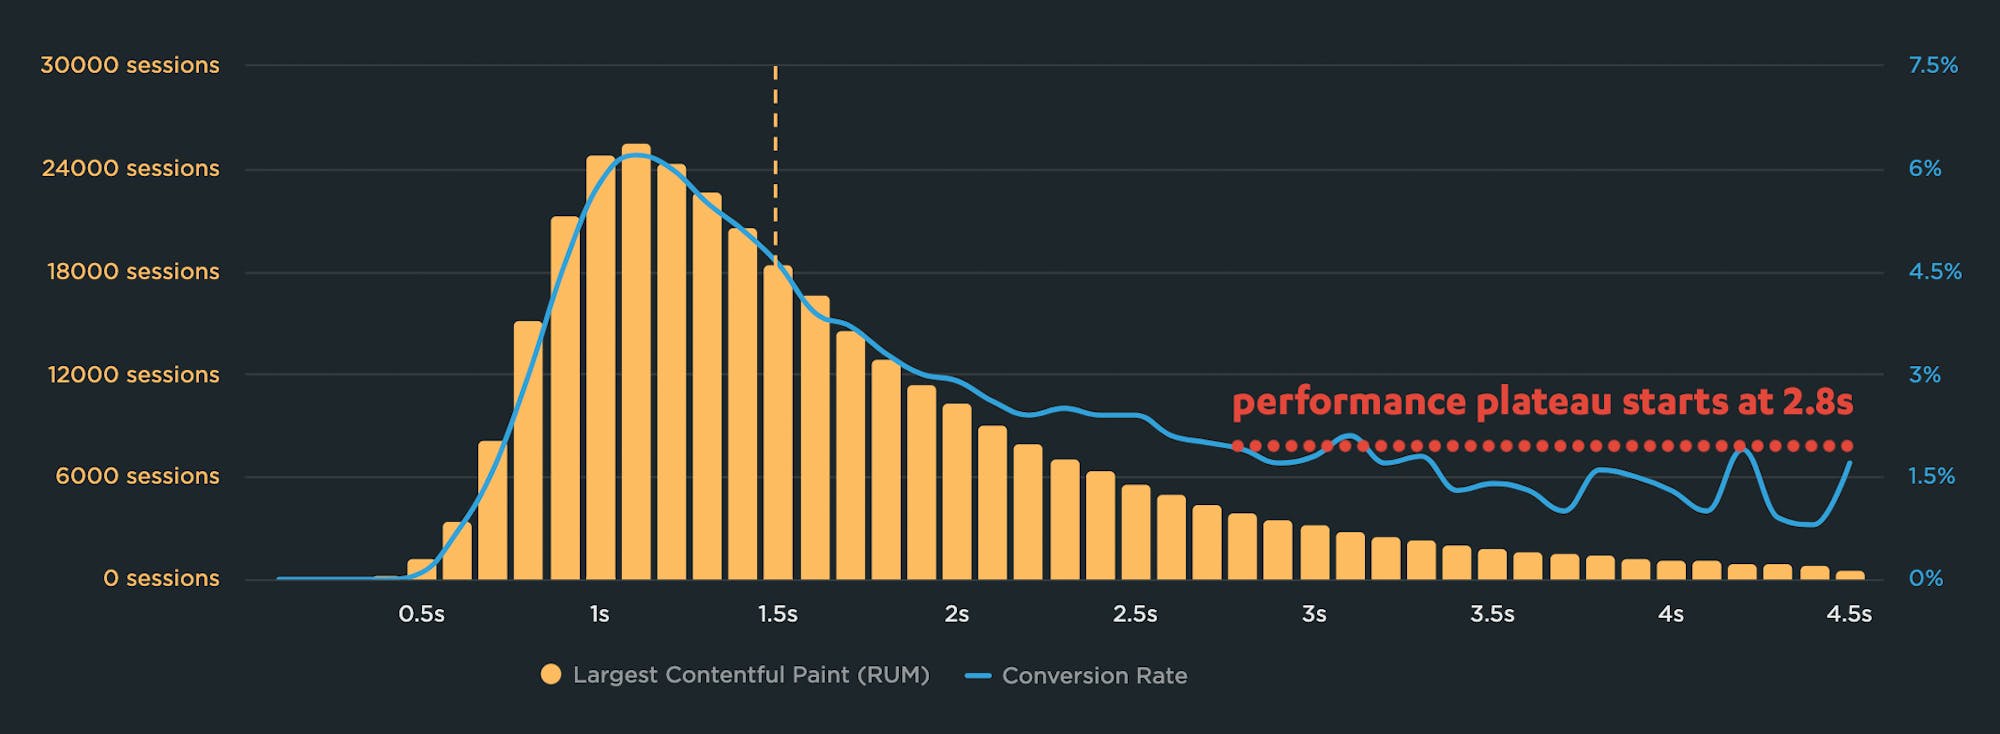
Have you ever asked yourself these questions?
"I made my pages faster, but my business and user engagement metrics didn't change. WHY???"
"How do I know how fast my site should be?"
"How can I demonstrate the business value of page speed to people in my organization?"
The answers might lie with identifying and understanding the performance plateau for your site.


