SpeedCurve is now part of the Embrace family! There are no changes to how you use our products. Our founder Mark shares what this means...
Cumulative Layout Shift: What it measures, when it works (and doesn't), and how to use it

Back in May, we shared that SpeedCurve supports Google's Core Web Vitals in both our synthetic monitoring and real user monitoring tools. Two of the Web Vitals – Largest Contentful Paint (LCP) and First Input Delay (FID) – were actually available in SpeedCurve for quite a while prior to the announcement. The newcomer to the scene was Cumulative Layout Shift (CLS), and, not surprisingly, it's the metric that's gotten the most questions.
A few of the questions I've been asked (or asked myself) about Cumulative Layout Shift:
- What does CLS measure?
- How is it calculated?
- What does it mean in terms of actual user experience?
- Does it correlate to user behaviour or business metrics in any measurable way?
- What are the (inevitable) gotchas?
- Ultimately, how much should we care about CLS?
Six months in, I've had a chance to gather and look at a lot of data, talk with customers, and learn from our friends in the performance community. Here's what I've learned so far.
Visualizing Layout Shifts

One of the big challenges with Google's new Cumulative Layout Shift (CLS) metric is understanding which elements actually moved on the page, when they moved, and by how much. To help with debugging your CLS scores, we've added a new visualization to SpeedCurve that shows each layout shift and how each individual shift adds up to the final cumulative metric.
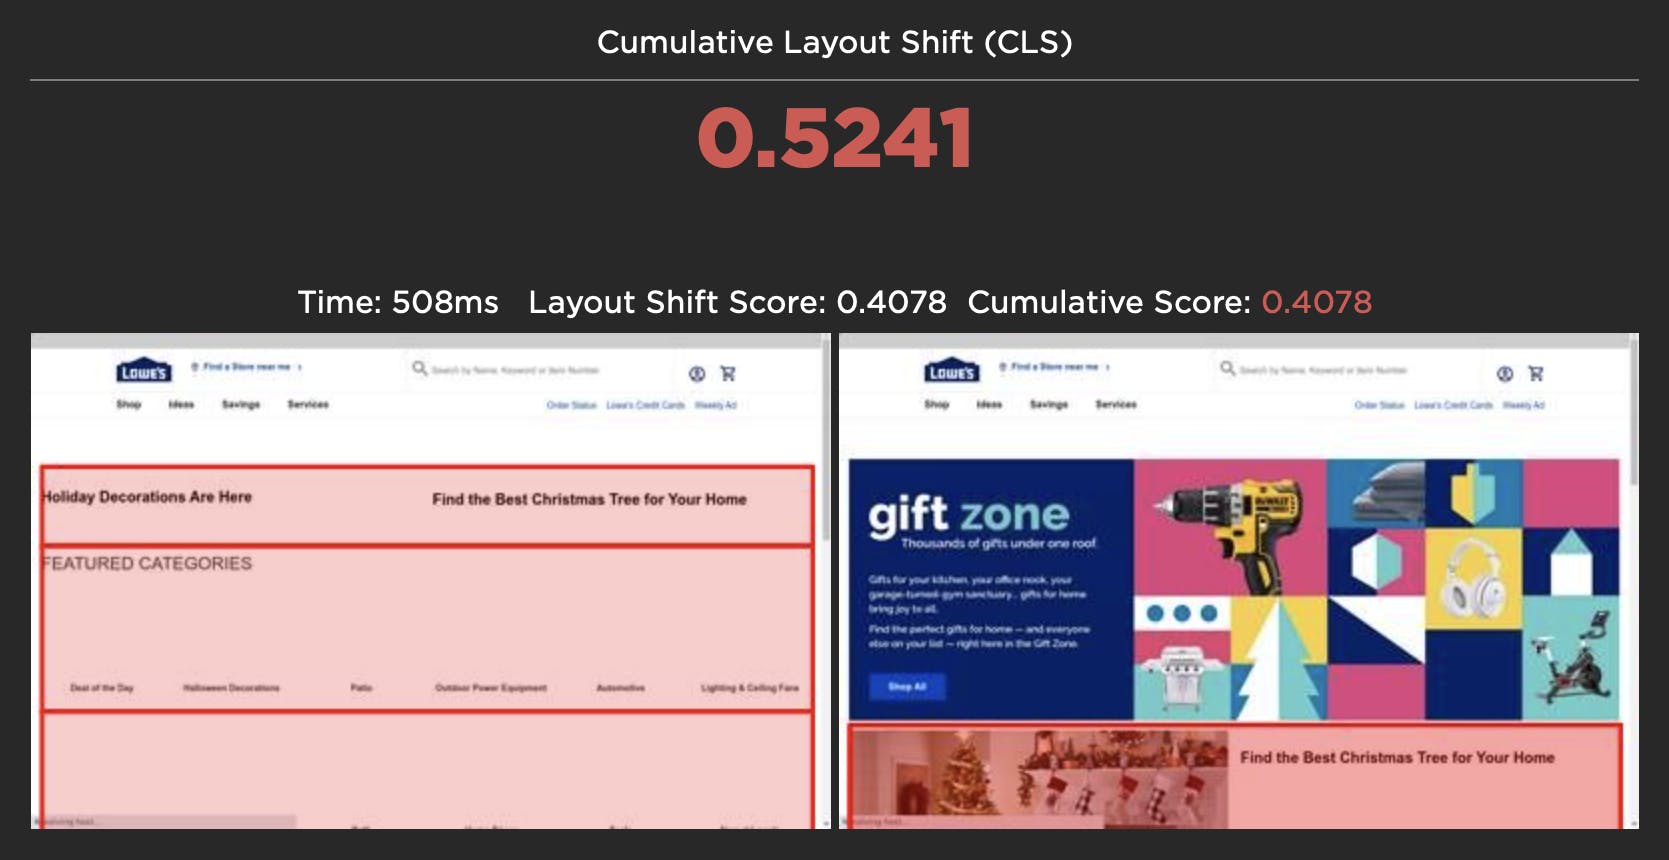
For each layout shift, we show you the filmstrip frame right before and right after the shift. We then draw a red box around the elements that moved, highlighting exactly which elements caused the shift. The Layout Shift Score for each shift also helps you understand the impact of that shift and how it adds to the cumulative score.
