Visualizing Layout Shifts

One of the big challenges with Google's new Cumulative Layout Shift (CLS) metric is understanding which elements actually moved on the page, when they moved, and by how much. To help with debugging your CLS scores, we've added a new visualization to SpeedCurve that shows each layout shift and how each individual shift adds up to the final cumulative metric.
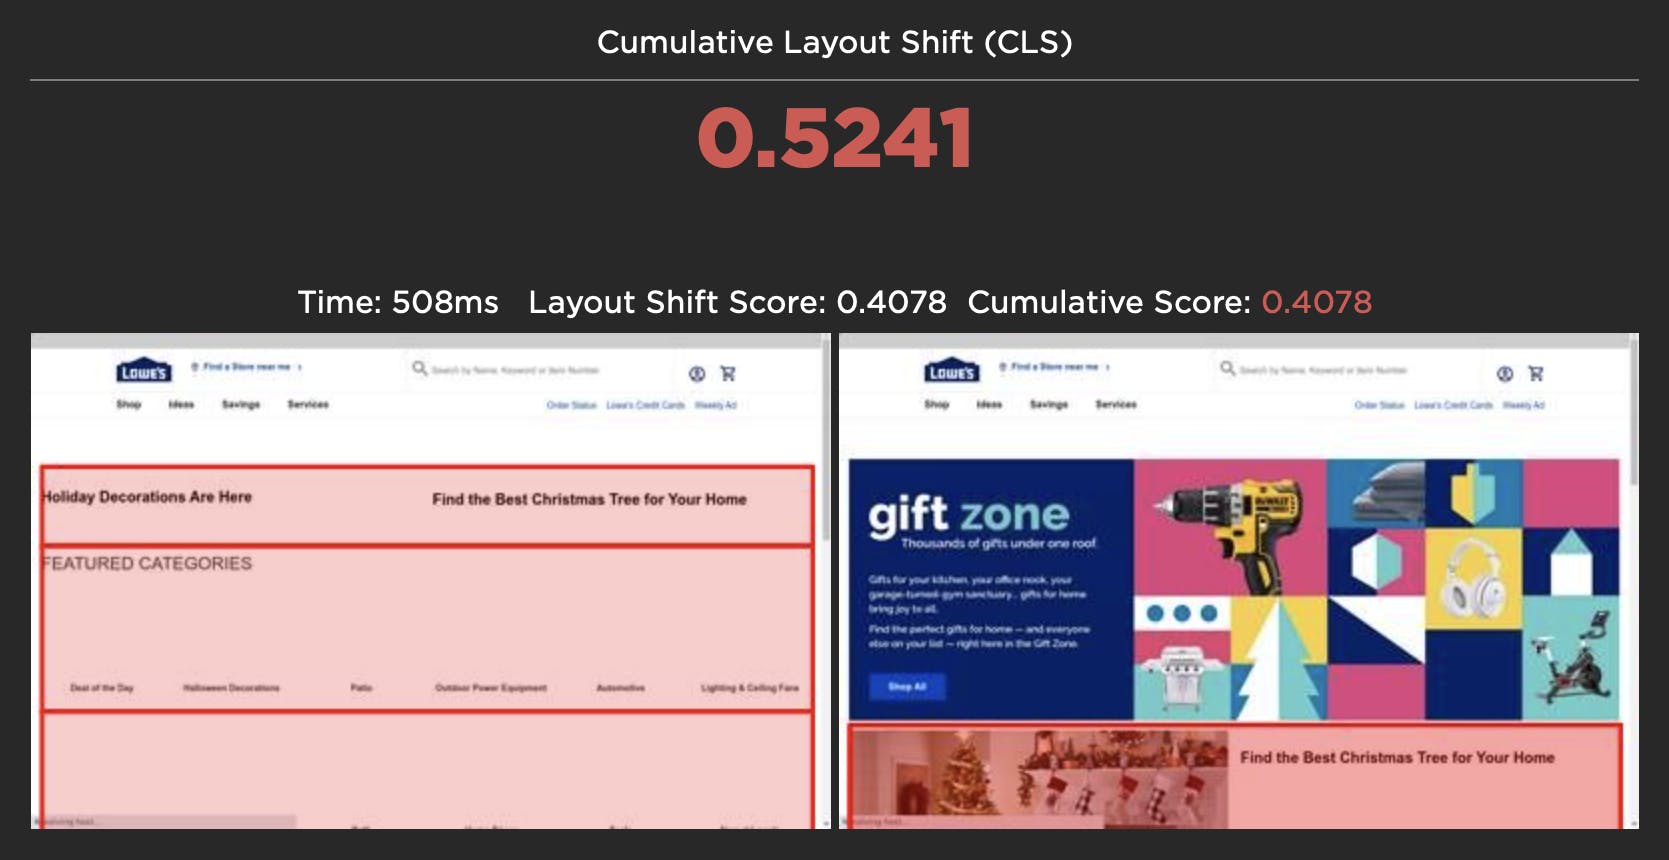
For each layout shift, we show you the filmstrip frame right before and right after the shift. We then draw a red box around the elements that moved, highlighting exactly which elements caused the shift. The Layout Shift Score for each shift also helps you understand the impact of that shift and how it adds to the cumulative score.
Visualizing each layout shift can help you spot issues with the way your page is being rendered. Here are some issues I observed when analyzing layout shifts on a few pages.
The size of the shifting element matters
Some layout shifts can be quite hard to spot when looking at just the filmstrip or a video of a page loading. In the example below, the main content of The Irish Times page only moves a small amount, but because of its large size the Layout Shift Score is quite high, adding 0.114 to the cumulative score.
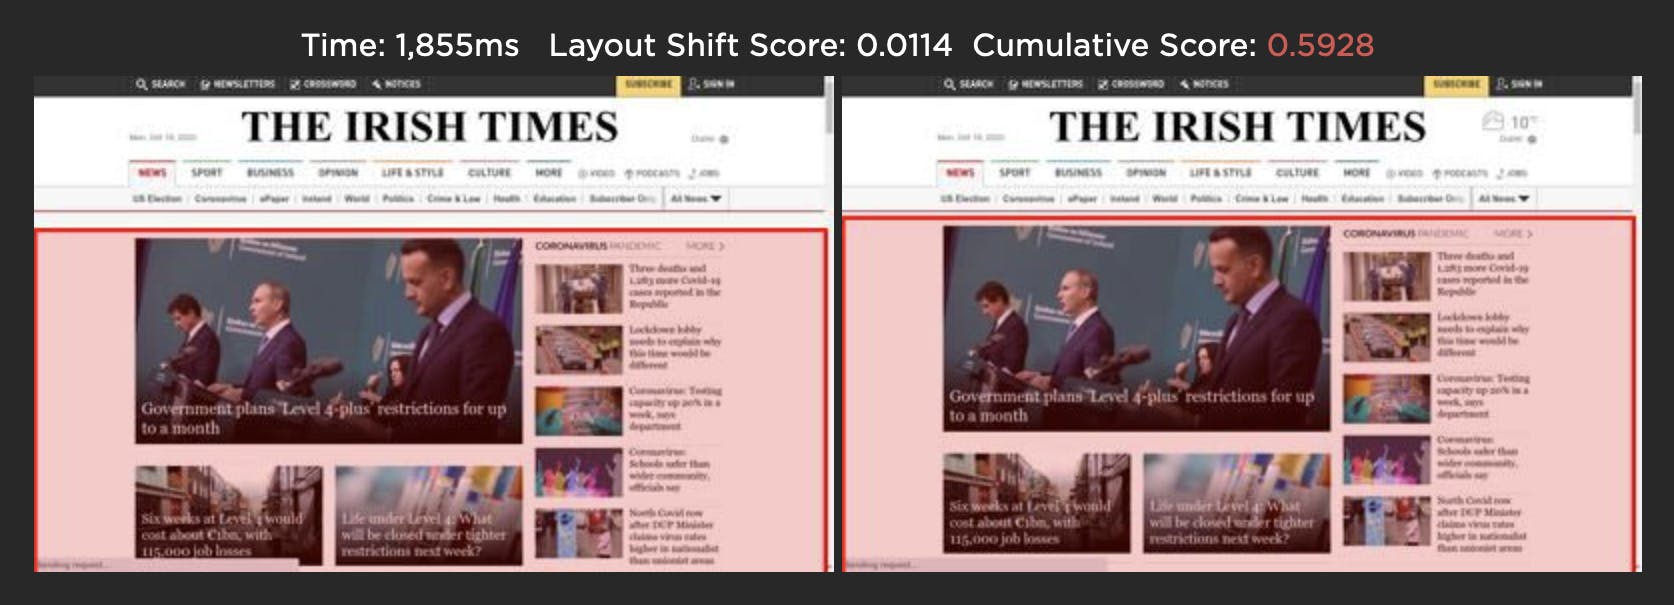
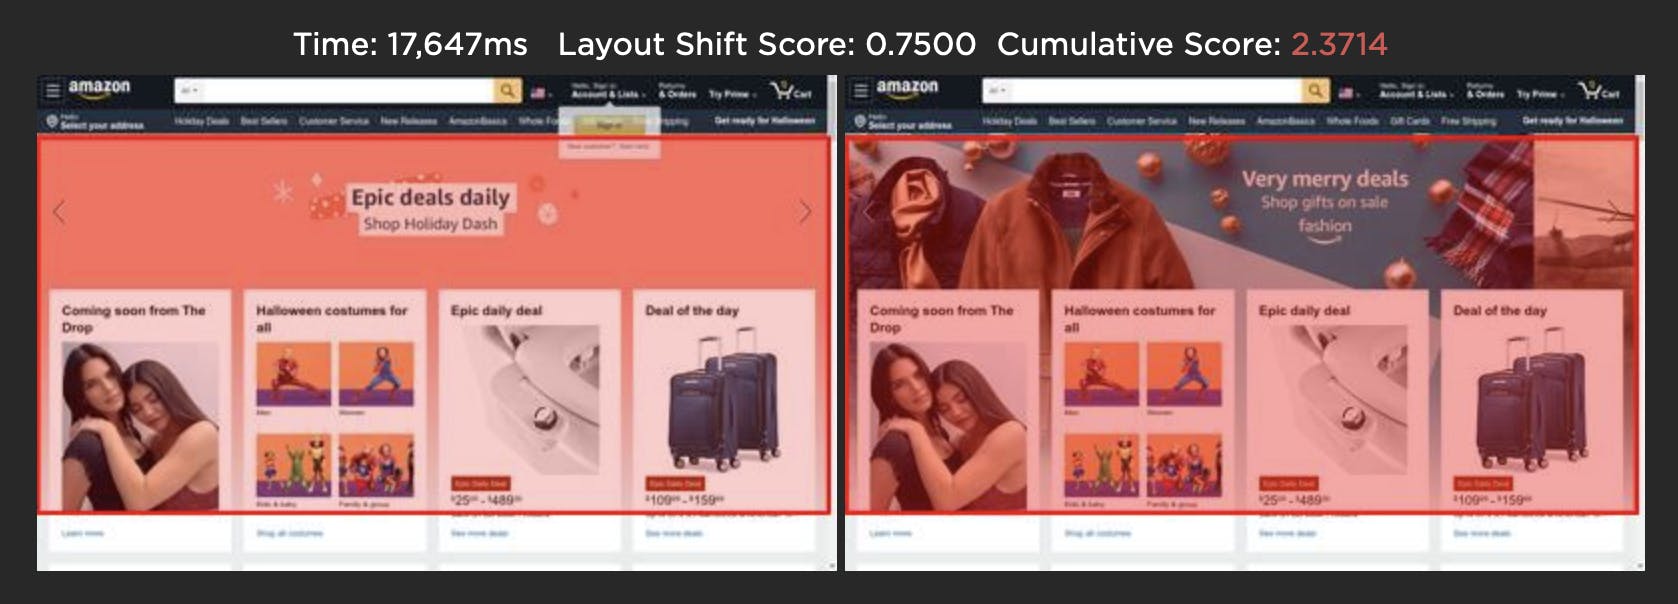
Image carousels can generate false positives
The Amazon homepage below uses an image carousel to slide a number of promotions across the page. While the user experience is fine, CLS gives this a bad score as the layout shift analysis only looks at how elements move on the page. You can avoid a bad CLS score by using CSS transform to animate any elements.
Web fonts and opacity changes can cause CLS issues
Web fonts and opacity changes are two other common areas where we see layout shift issues. While it's good practise to not hide your content while waiting for a web font to load, it can negatively impact your CLS score if the web font then moves an element when it renders.
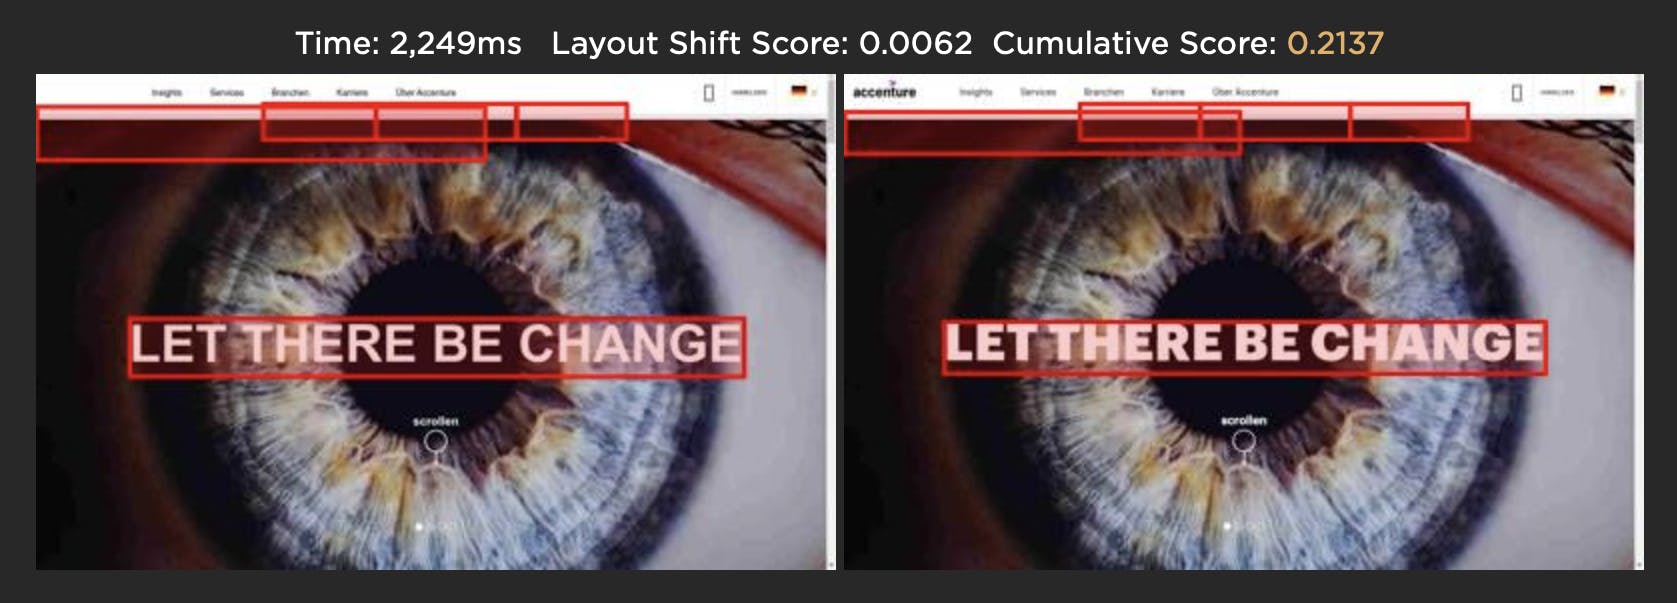
Best to try and match the size of the default font and rendered web font, or reserve space for the final rendered text so layout changes don't ripple through the DOM. CLS also doesn't take into account opacity changes, so adding an element with opacity 0 and then moving it will impact your CLS score.
Takeaway: Visualizing layout changes can help you create better user experiences
Seeing every single layout change as your page renders should really help you understand how your page is constructed and highlight any elements that move, leading to a poor user experience and a bad CLS score. Check out your layout shifts on your test pages. For more good reading, here are some great tips from Addy on optimizing your pages to minimize any shifts.
Related: Tracking Core Web Vitals for a better user experience