2025 was a big year! Here are some highlights...
I say this every year, and every year I mean it: this has been a big year, for both SpeedCurve and the web performance community!

Some highlights:
- Broad browser support for important metrics like Largest Contentful Paint and Interaction to Next Paint
- Exciting new metrics and visualizations for measuring user happiness — as well as identifying the root causes of issues that lead to user UNhappiness
- Nuanced metrics for deeper diagnostics (especially digging into JavaScript issues that were previously elusive)
- Better performance budgets
- Easier for Shopify and Magento stores — as well as SPAs — to enjoy all the benefits of real user monitoring
Let's go!
NEW! A trickle of updates to your waterfall charts
Waterfall charts are the workhorse of any web performance enthusiast. SpeedCurve's interactive waterfall is one of the first components I designed and built more than a decade ago. I've just given our much-loved waterfall chart some team-inspired updates that you may find helpful in understanding how page construction affects important user experience metrics.
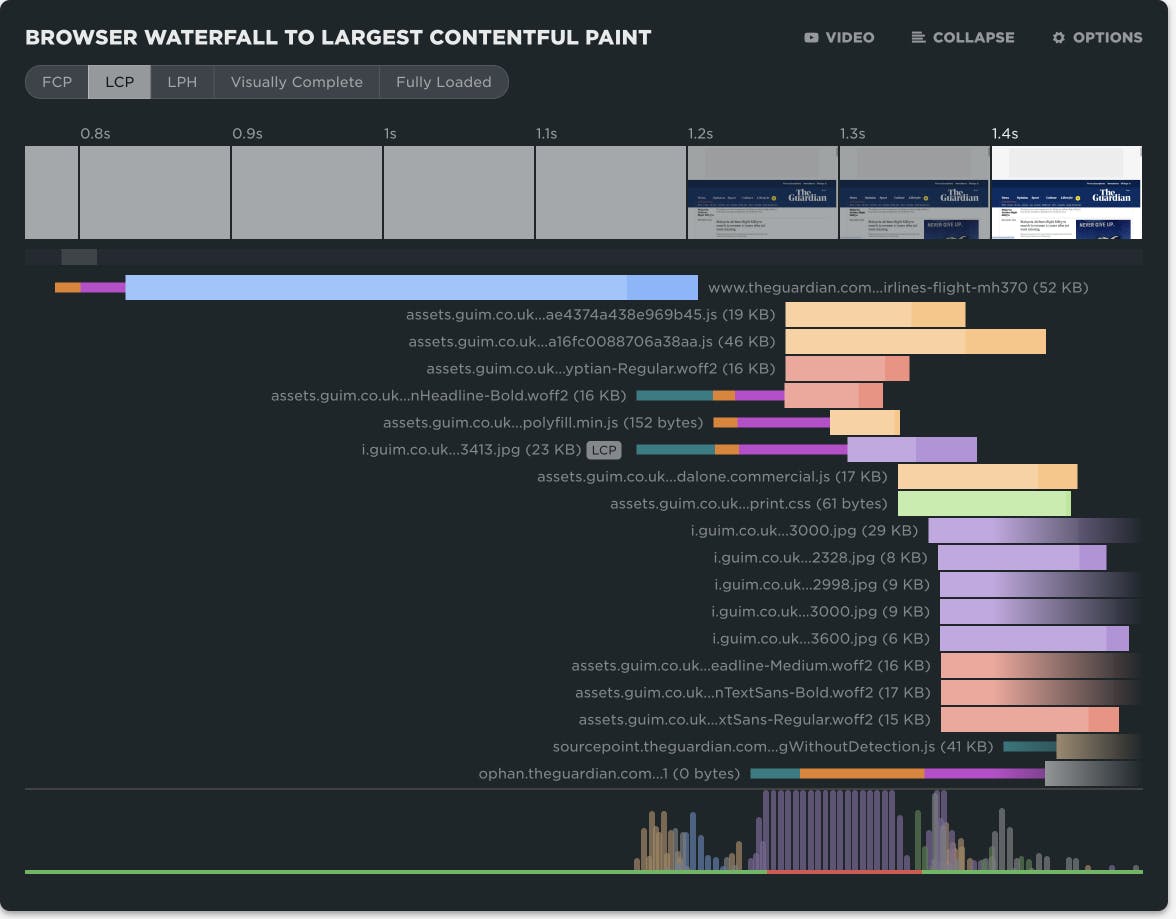
At SpeedCurve, we love incremental updates based on both external and internal user feedback. We dogfood our own products, and while consulting with customers, our in-house performance expert Andy Davies is often confronted by the gulf between a customers questions and how he might answer those questions using the data we collect and the visulizations we wrap around it.
It's not always easy. Making data visible doesn't automatically mean it's useful in answering questions about the intersection of web performance and user behaviour.
Three years ago Andy asked me for a feature in the waterfall chart. I added it straight away, and to this day Andy has never discovered or used the feature!
"Wait, you can do that?" ~ Andy
If Andy uses SpeedCurve everyday, knows it inside out, and still can't stumble across a three-year-old feature, that's not Andy's problem. That's a problem with complexity in the user interface and feature discoverability. It's a common problem as software matures and features get layered on top of each other. What started out simple and easy to explore becomes complex and hidden behind a myriad of options.
Today I'm taking a crack at removing some options in the waterfall to reduce complexity and choice while exposing better defaults.
I'm hoping Andy sees the changes this time around and it helps answer more of his questions...
NEW! A better way to quantify user happiness on your site
The goal of making websites faster is to make users happier. Since user happiness can't be measured directly, we launched the User Happiness metric more than six years ago. We've just released a fresh User Happiness update to reflect changes in web browsers and the overall web performance space!
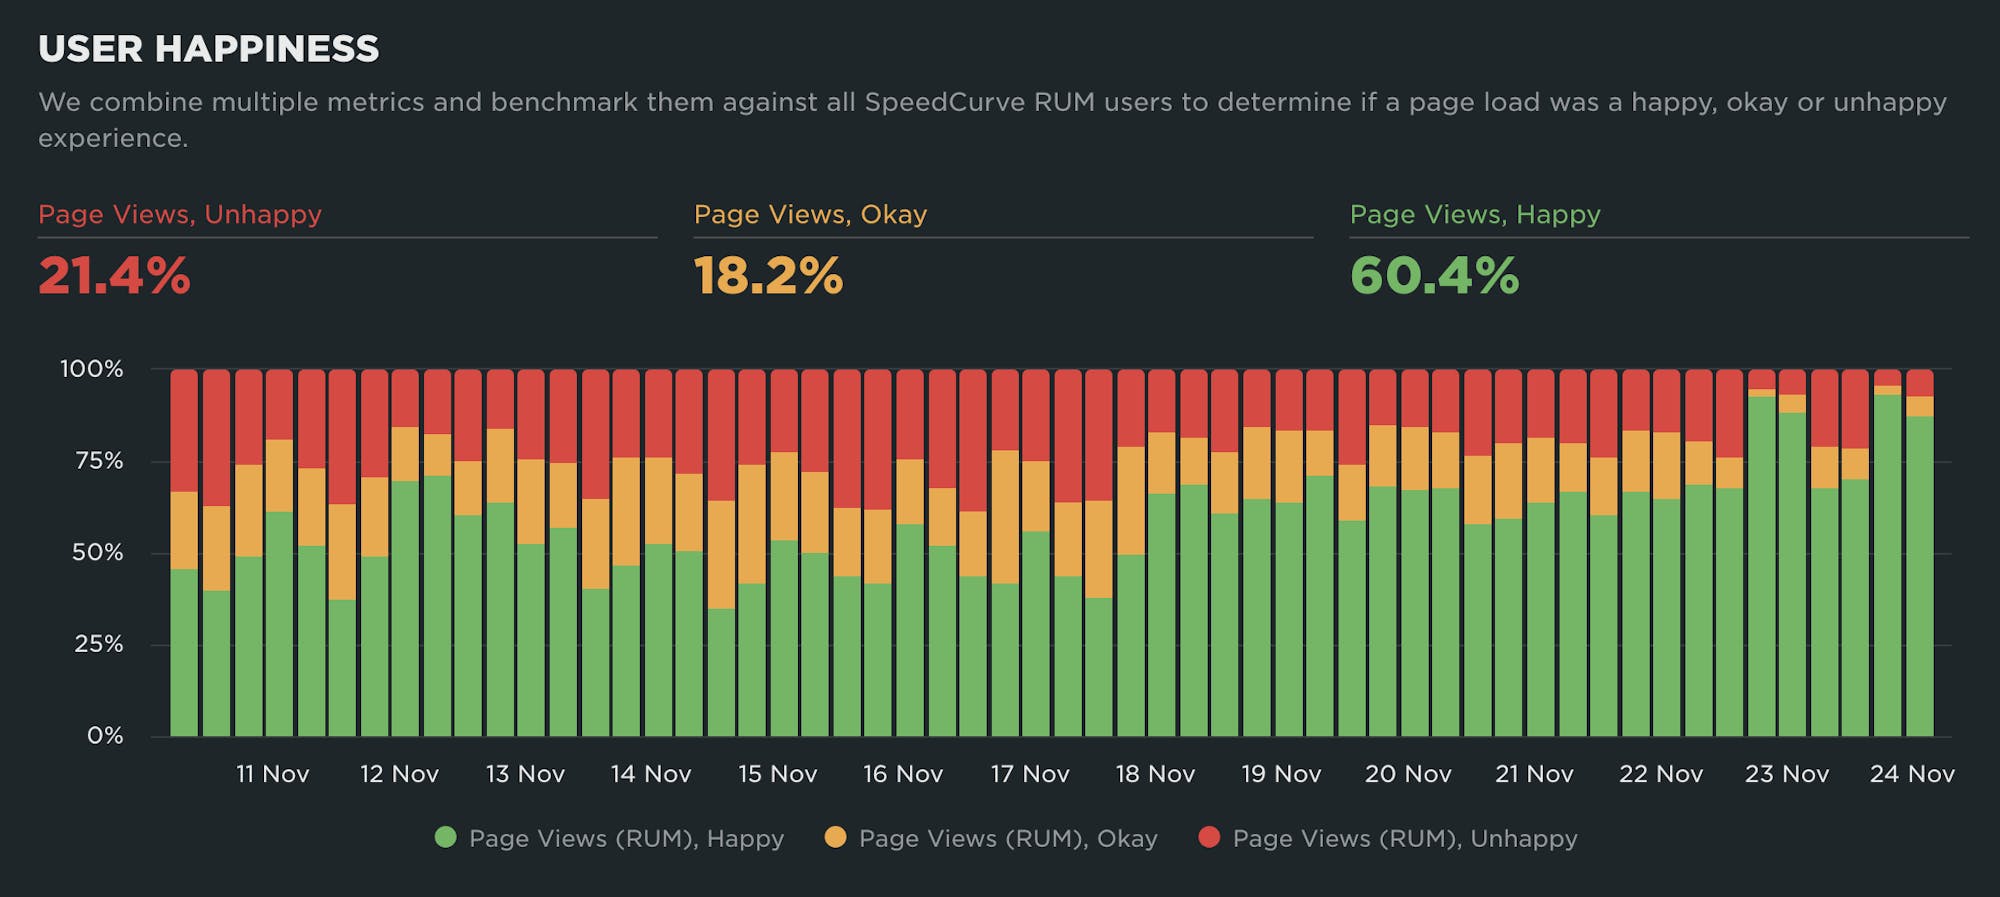
Back in October 2019, we released our User Happiness metric with the goal of quantifying how a user might have felt while loading a page.
User Happiness is an aggregated metric that combines important user experience signals, gathered with real user monitoring (RUM). To create the User Happiness algorithm, we picked metrics and thresholds that we felt reflected the overall user experience: pages that loaded slowly or lagged during interaction were more likely to make someone feel unhappy, whereas fast and snappy pages would keep users happy.
More than six years later, we've updated User Happiness to reflect changes in web browsers and the overall web performance space. Keep reading to learn more.
Performance is about people
Hey, you! 👋🏽 Yeah, you… the person who just clicked the link to get here and read this. Thanks for clicking, and thanks for giving this node a fraction of your attention.
Today, SpeedCurve joins Embrace. It’s going to be awesome and exciting. You can read all the details in the press release and Andrew's blog post or join us for a chat on Dec 9th.
I want to take this moment to remind you, and ourselves, why the web matters.
At its heart, the web is about humanity. It’s about how we choose to evolve ourselves. That’s why user experience, speed and curiosity are interlinked and matter so much.
I’ll keep it succinct: each moment is precious.
NEW! Heatmaps now available on Favorites Dashboards
We’re thrilled to announce that you can now add heatmaps to your Favorites (custom) dashboards in SpeedCurve!
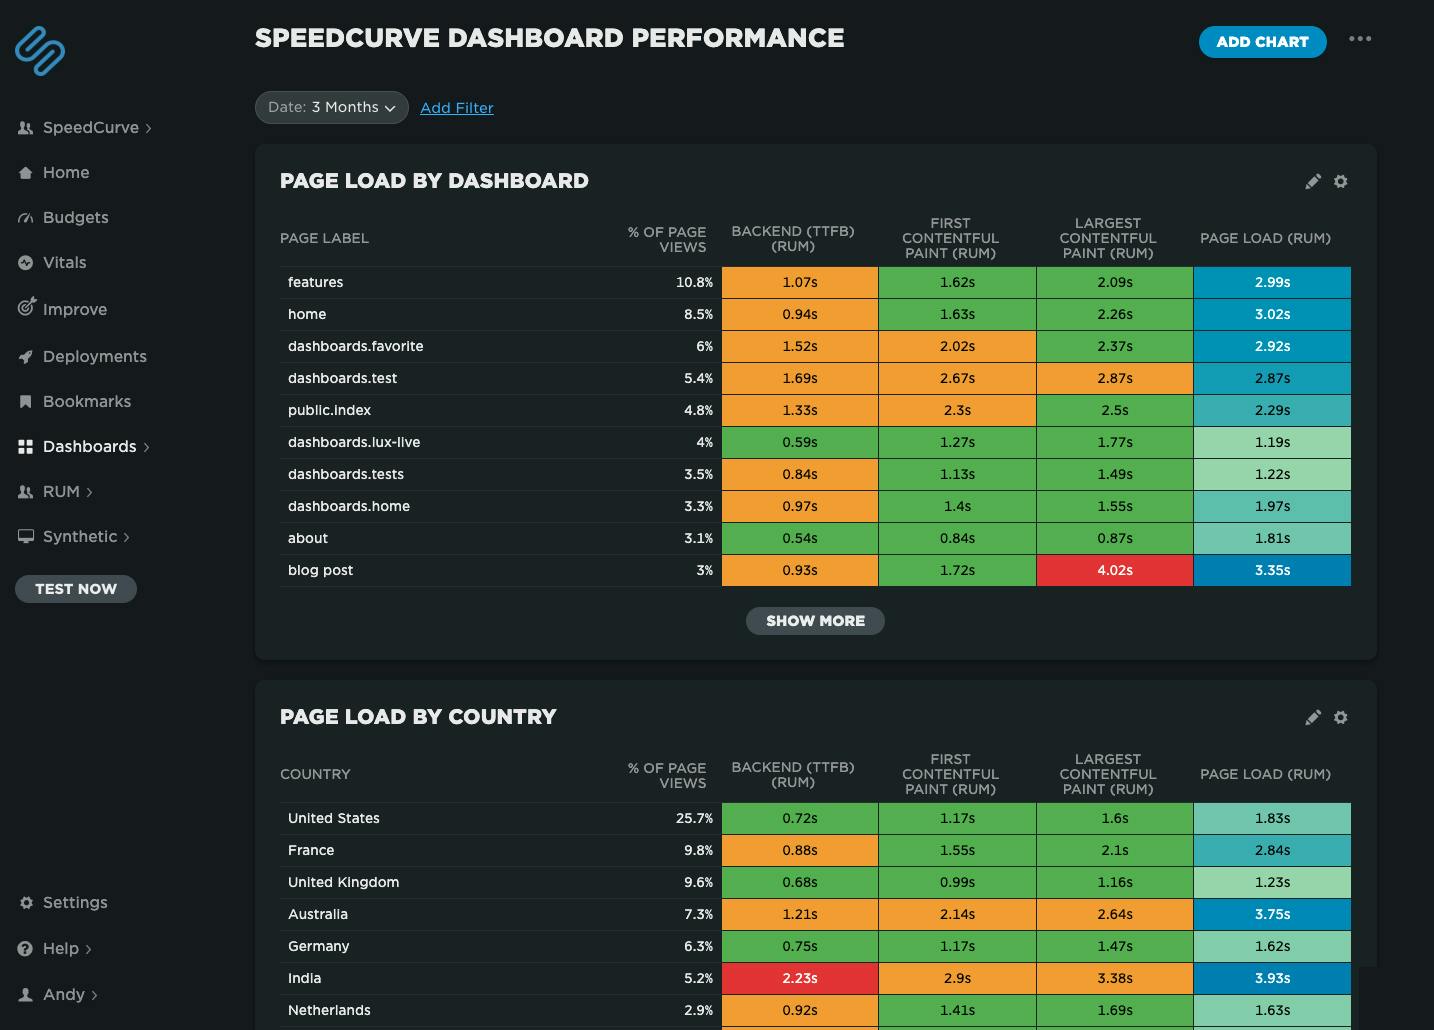 Speedcurve's own performance data for our dashboards. We've got some issues with our blog post page performance, possibly the huge images I've been uploading!
Heatmaps are a powerful way to get an instant overview of where performance issues are hiding across your site. They let you break down your performance metrics (including custom metrics) by different dimensions — including page label, browser, location, and device type — so you can easily spot anomalies and patterns in your web performance data.
For example, you might notice that a specific browser or region consistently loads your site more slowly, or that certain pages are lagging behind the rest. Heatmaps make it easy to visualize and spot those differences at a glance, helping you pinpoint where to focus your optimization efforts.
2025 Holiday Readiness Checklist (Page Speed Edition!)
Delivering a great user experience through the holiday season is a marathon, not a sprint. Here are 25 things you can do to make sure your site is fast and available every day, not just Black Friday.

Your design and development teams are working hard to attract users and turn browsers into buyers, with strategies like:
- High-resolution images and videos
- Geo-targeted campaigns and content
- Third-party tags for audience analytics and retargeting
However, all those strategies can take a toll on the speed and user experience of your pages – and each introduces the risk of introducing single points of failure (SPoFs).
Below we've curated 25 things you can do to keep your users happy throughout the holidays (and beyond). If you're scrambling to optimize your site before Black Friday, you still have time to implement some or all of these best practices. And if you're already close to being ready for your holiday code freeze, you can use this as a checklist to validate that you've ticked all the boxes on your performance to-do list.
NEW! A smarter way to spot performance issues
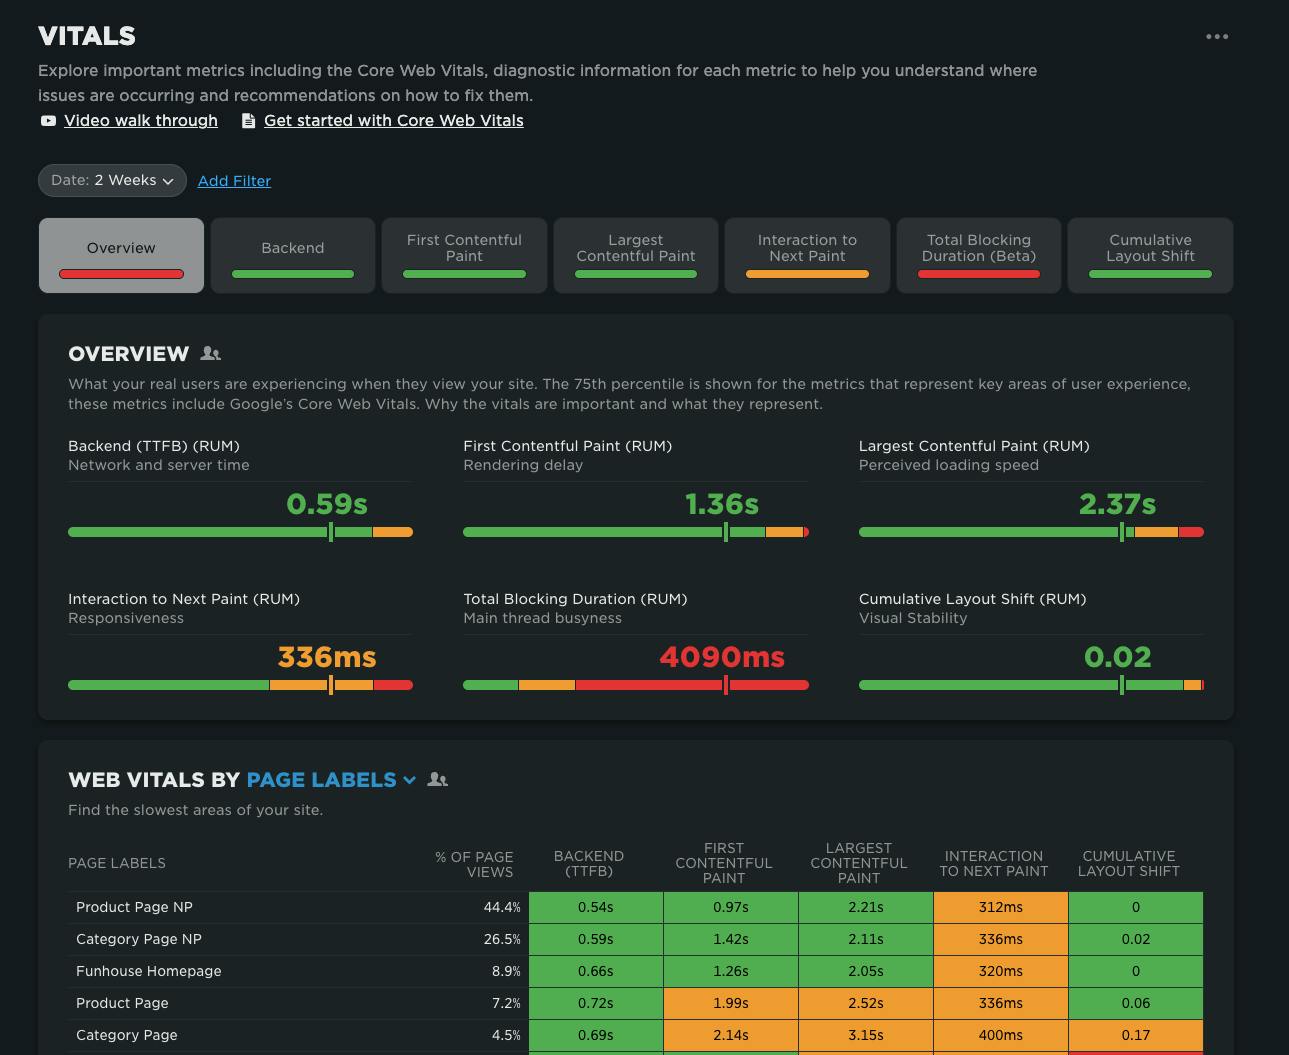
We’re excited to announce the launch of the Vitals Overview dashboard in SpeedCurve — your new starting point for exploring the performance of your site.
When it comes to improving web performance, the journey usually looks like this:
- Identify where the problems are
- Diagnose why they’re happening
- Fix the issues
- Validate that the fixes worked
Our new Vitals Overview dashboard is designed to make that critical first step — identifying performance issues — faster, clearer, and more actionable.
Are your retail landing pages killing conversions?
You've probably started to notice retail campaigns for Halloween, Thanksgiving, and even Christmas! Online campaigns are pricey, so the landing page should be the MOST scrutinized page of your site — but too often it's an afterthought.
I tracked the rendering times of campaign landing pages for leading retailers to see how they compare — who's fast, who's slow, and what's causing their page speed bottlenecks.
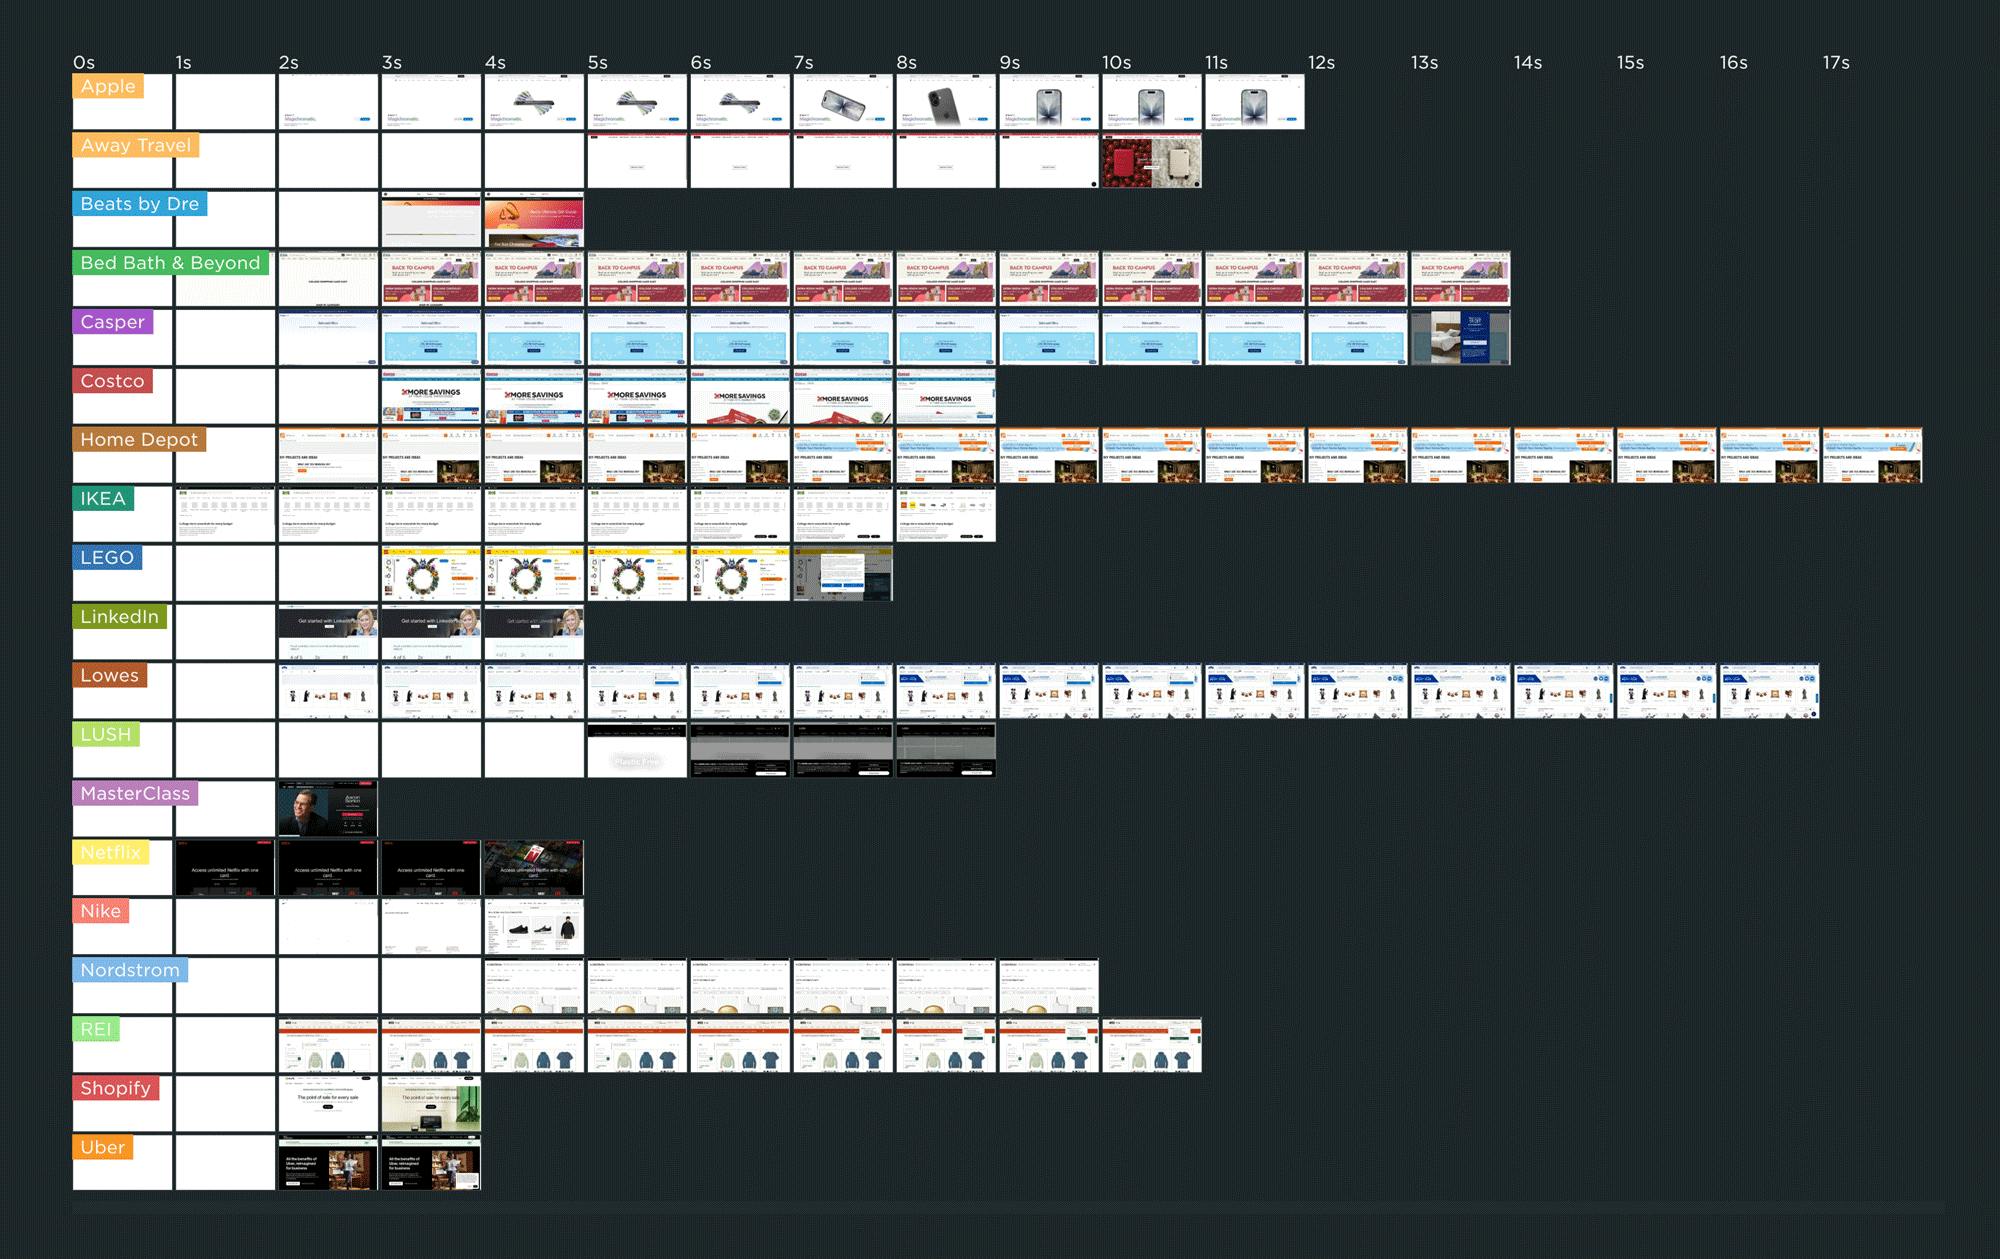
As you can see in this competitive benchmarking leaderboard, rendering speeds varied across pages ranging from Apple to Uber. The fastest campaign page — which belonged to IKEA.com — started to render in about 1 second, which is great to see.
But for many of the other pages, it was common to wait 3 or 4 seconds — or longer! — to see meaningful content.
In this post, we'll cover:
- Why the speed of your campaign landing pages matters... possibly even more than most of the other pages on your site
- Why performance issues on campaign landing pages often go unnoticed
- Common performance issues on landing pages
- A deep dive into the landing page for one of the sites I tracked
- Who should be responsible for the performance of the landing pages on your site?
- What you can do to make sure your campaign landing pages stay fast
When to use CrUX, RUM, and Synthetic web performance monitoring
"Should I use synthetic monitoring, real user monitoring, or CrUX?" We hear this question a lot. It's important to know the strengths and limitations of each monitoring tool and what they’re best used for, so we don’t miss out on valuable insights.

This post includes:
- How synthetic and real user monitoring (RUM) work
- What is CrUX?
- Is CrUX a substitute for RUM?
- When and why to use each tool
- An obscure cheese metaphor
- Plus a quick survey question at the end!
How do Long Animation Frames affect user behavior?
What's the point of a performance metric that doesn't align with user behavior – and ultimately business outcomes? Looking at four different retail sites, we compared each LoAF metric for desktop and mobile and correlated it to conversion rate. We saw some surprising trends alongside some expected patterns.
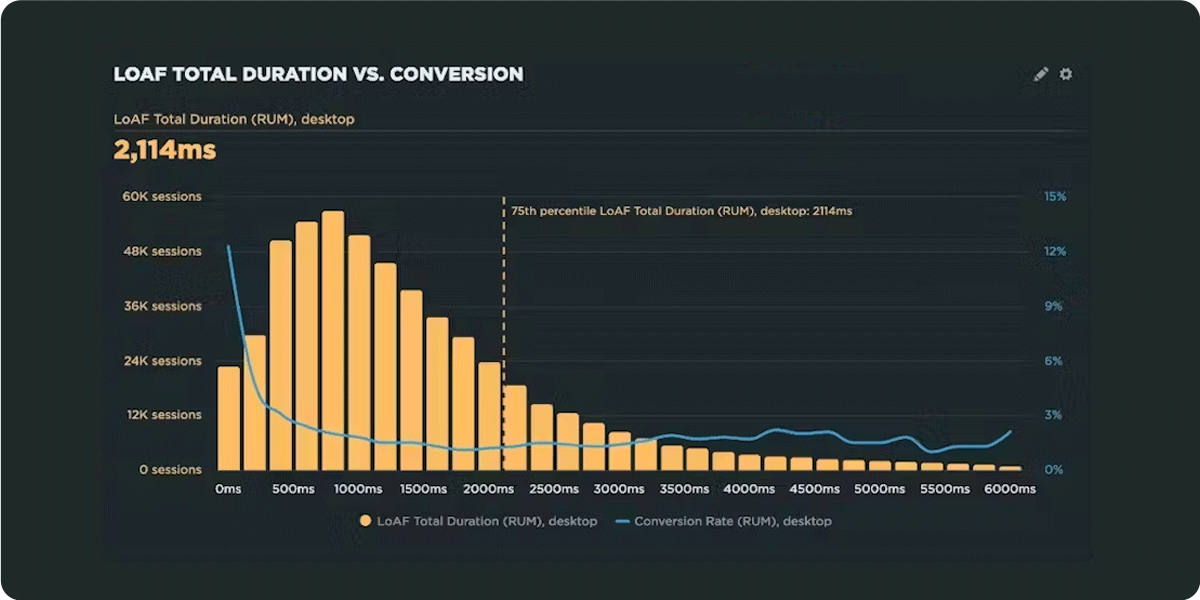
We recently shipped support for Long Animation Frames (LoAF). We're buzzing with excitement about having better diagnostic capabilities, including script attribution for INP and our new experimental metric, Total Blocking Duration (TBD).
While Andy has gone deep in the weeds on LoAF, in this post let's put the new set of metrics to the test and see how well they reflect the user experience. We'll look at real-world data from real websites and find an answer to the question: How do Long Animation Frames affect user behavior?


