New! Vitals Dashboard

Getting up to speed on Core Web Vitals seems to be at the top of everyone's to-do list these days. Just in time for the holidays, we are happy to bring you our new Vitals dashboard to help you get a huge jumpstart.
We love to visualize performance data (in case you haven't heard). We love it even more when we can be true to one of our biggest motivations at SpeedCurve: leveraging both RUM and Synthetic data to help you take action on what matters most.
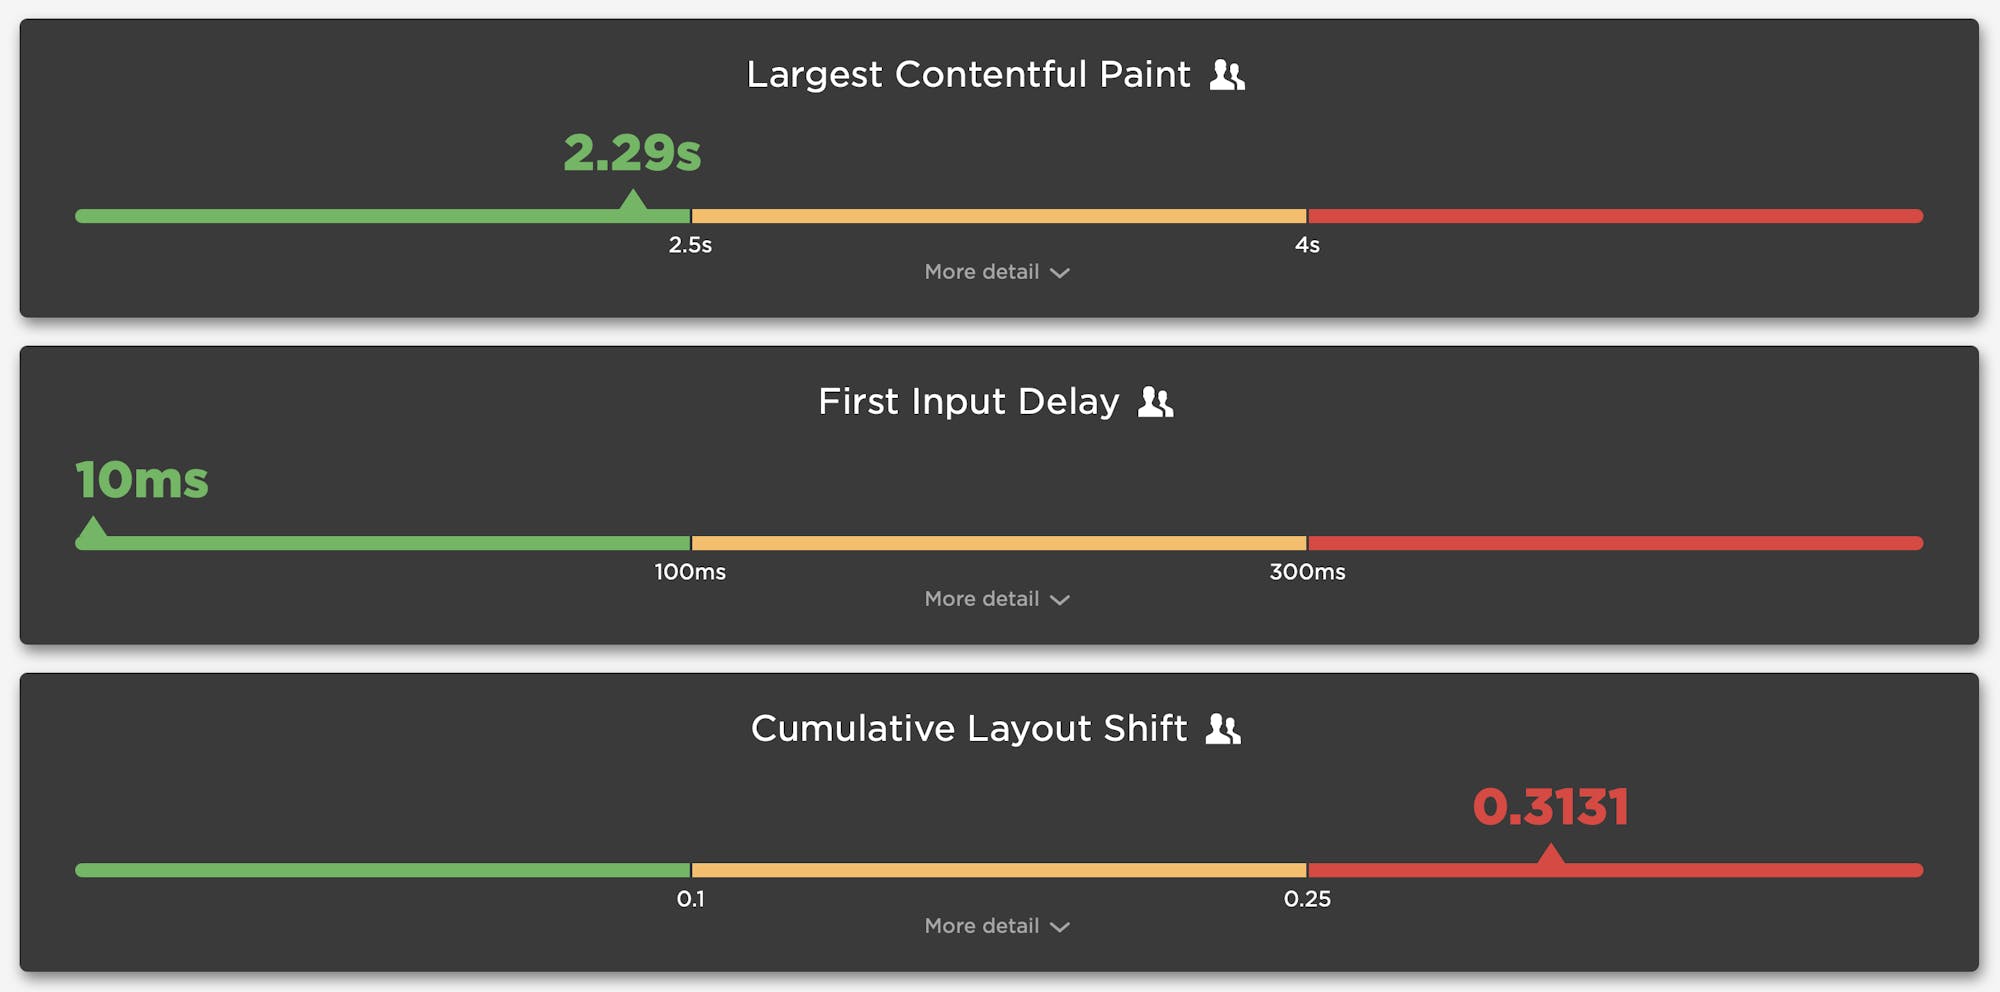
Each vital metric is represented in its own section of the dashboard, with a current view of where you stand relative to the recommended thresholds. This summary view is designed to be a quick snapshot easily digested by those who are simply looking to see where they stand. Expanding each section unlocks a bit more detail around each metric, leveraging the best parts of each dataset and hopefully educating you along the way.
Largest Contentful Paint (LCP)
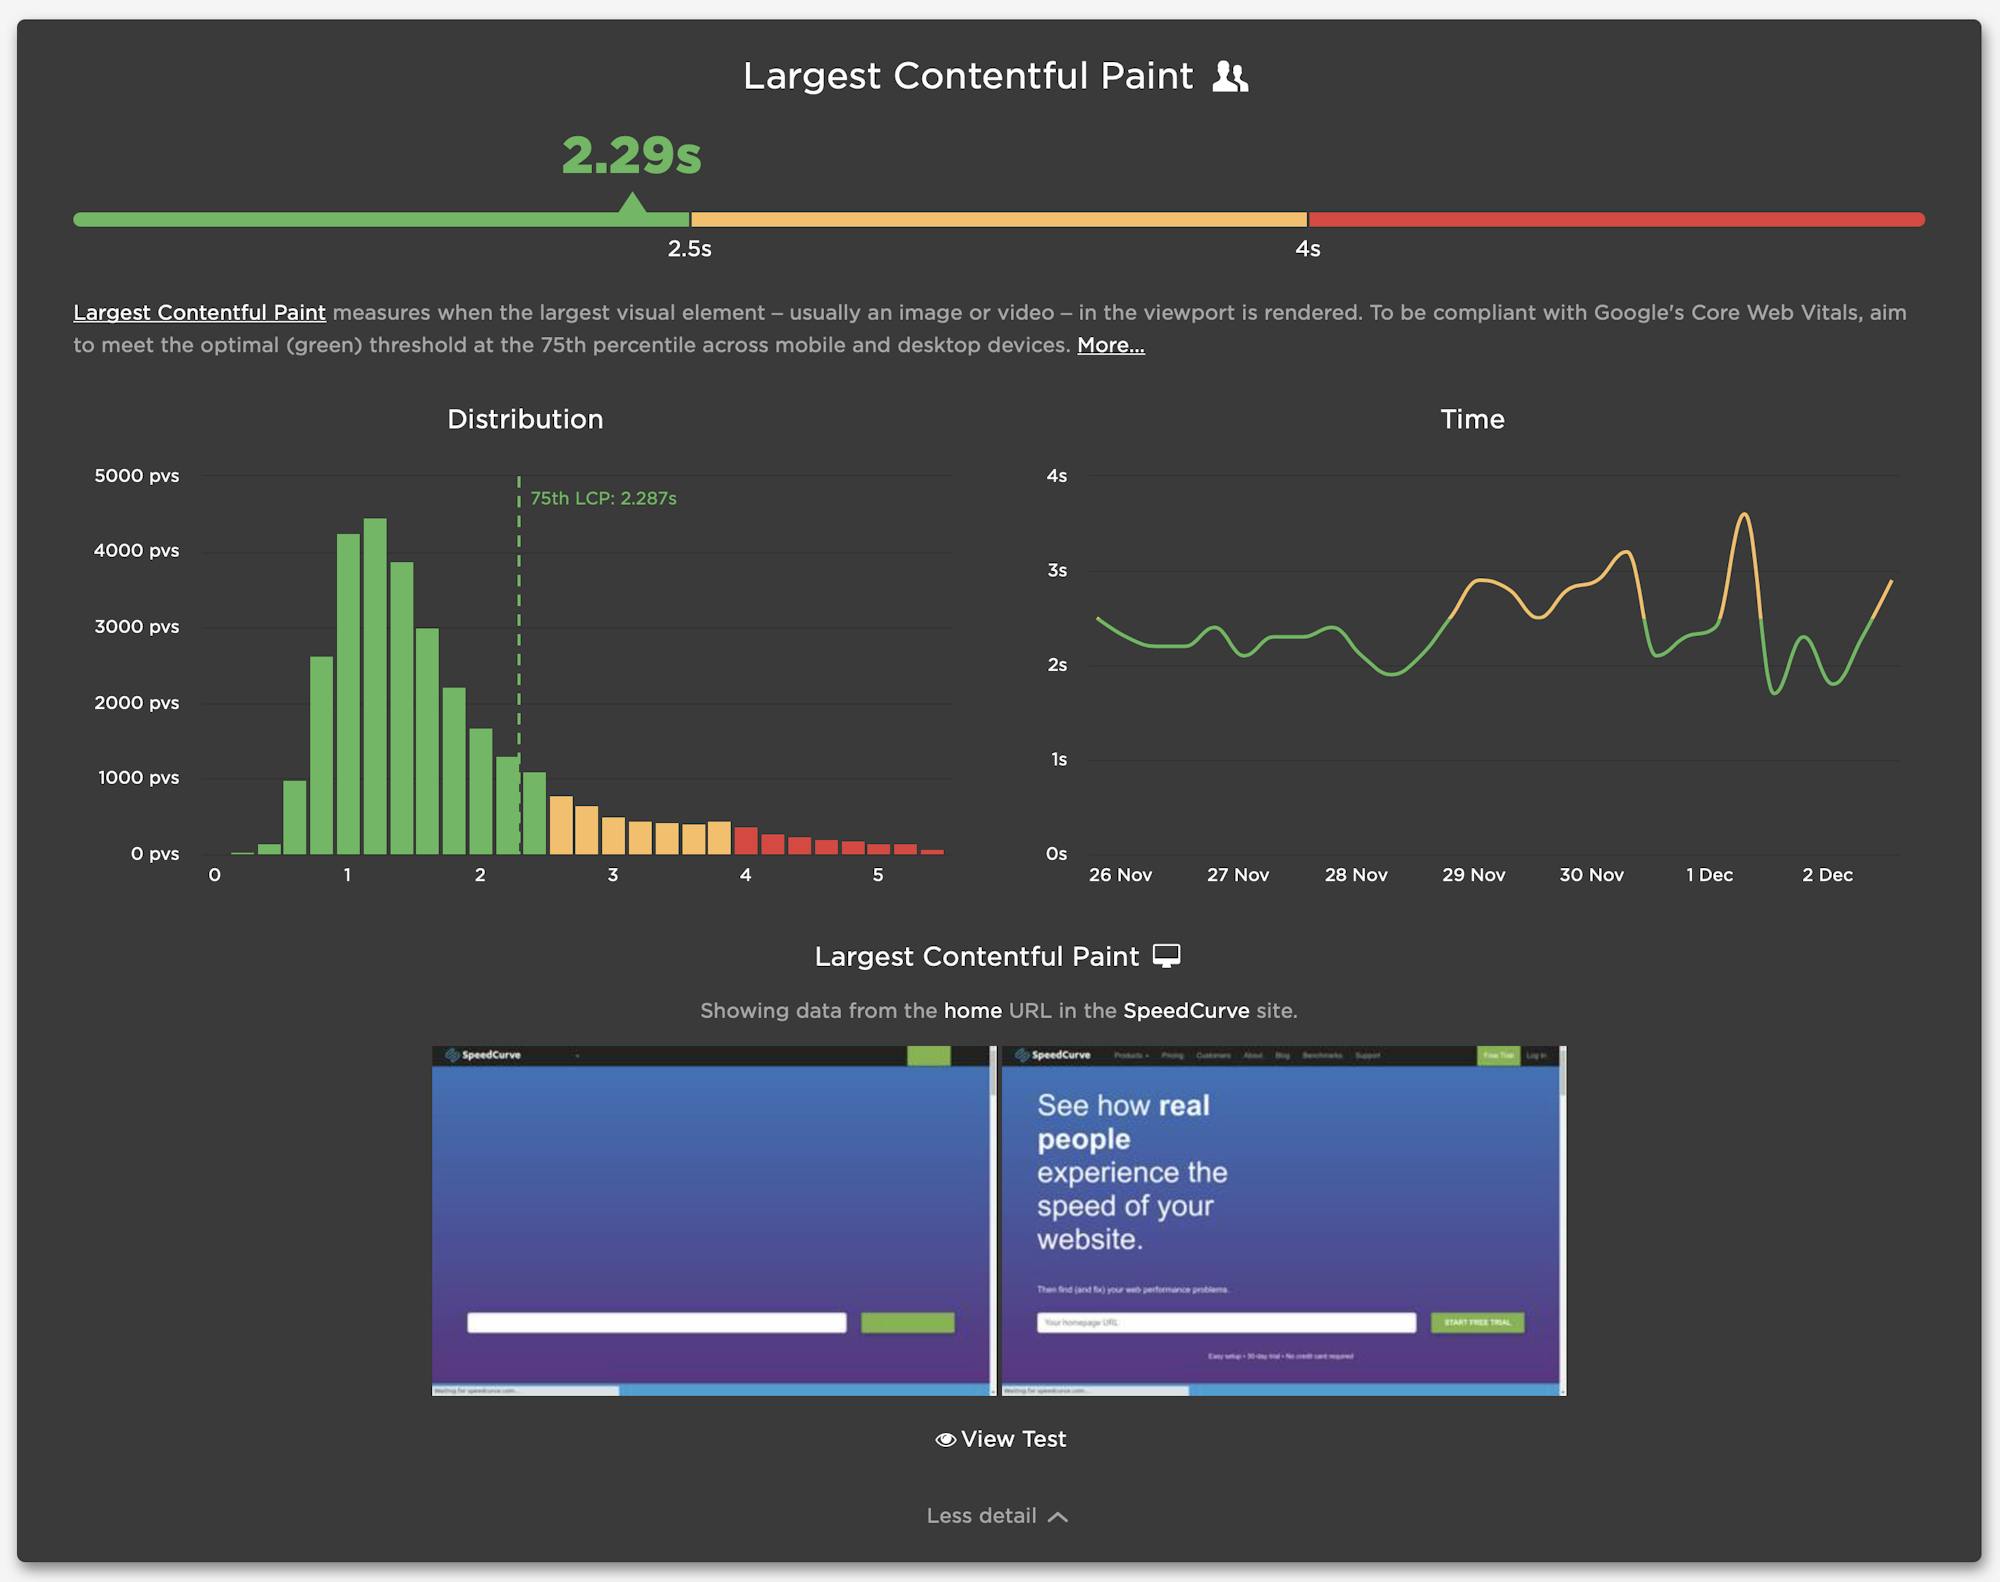
The first vital in the dashboard is Largest Contentful Paint (LCP). When each section is expanded, thresholds taken from the vitals bar are included in the histogram and time series charts. Seeing the distribution alongside the time series helps to identify anomalies or perhaps pockets of users that have different performance characteristics.
Visualizing paint events with just RUM is not possible. In order to do this, we need to examine the before and after frames around LCP taken from a synthetic test. While the accuracy of LCP continues to improve, identifying the element introduced between the two frames shown helps you validate the accuracy of the metric as well as the element attributed to LCP. (If you want to learn more, Joseph has done some great analysis of how paint timing metrics align with filmstrips in this post.)
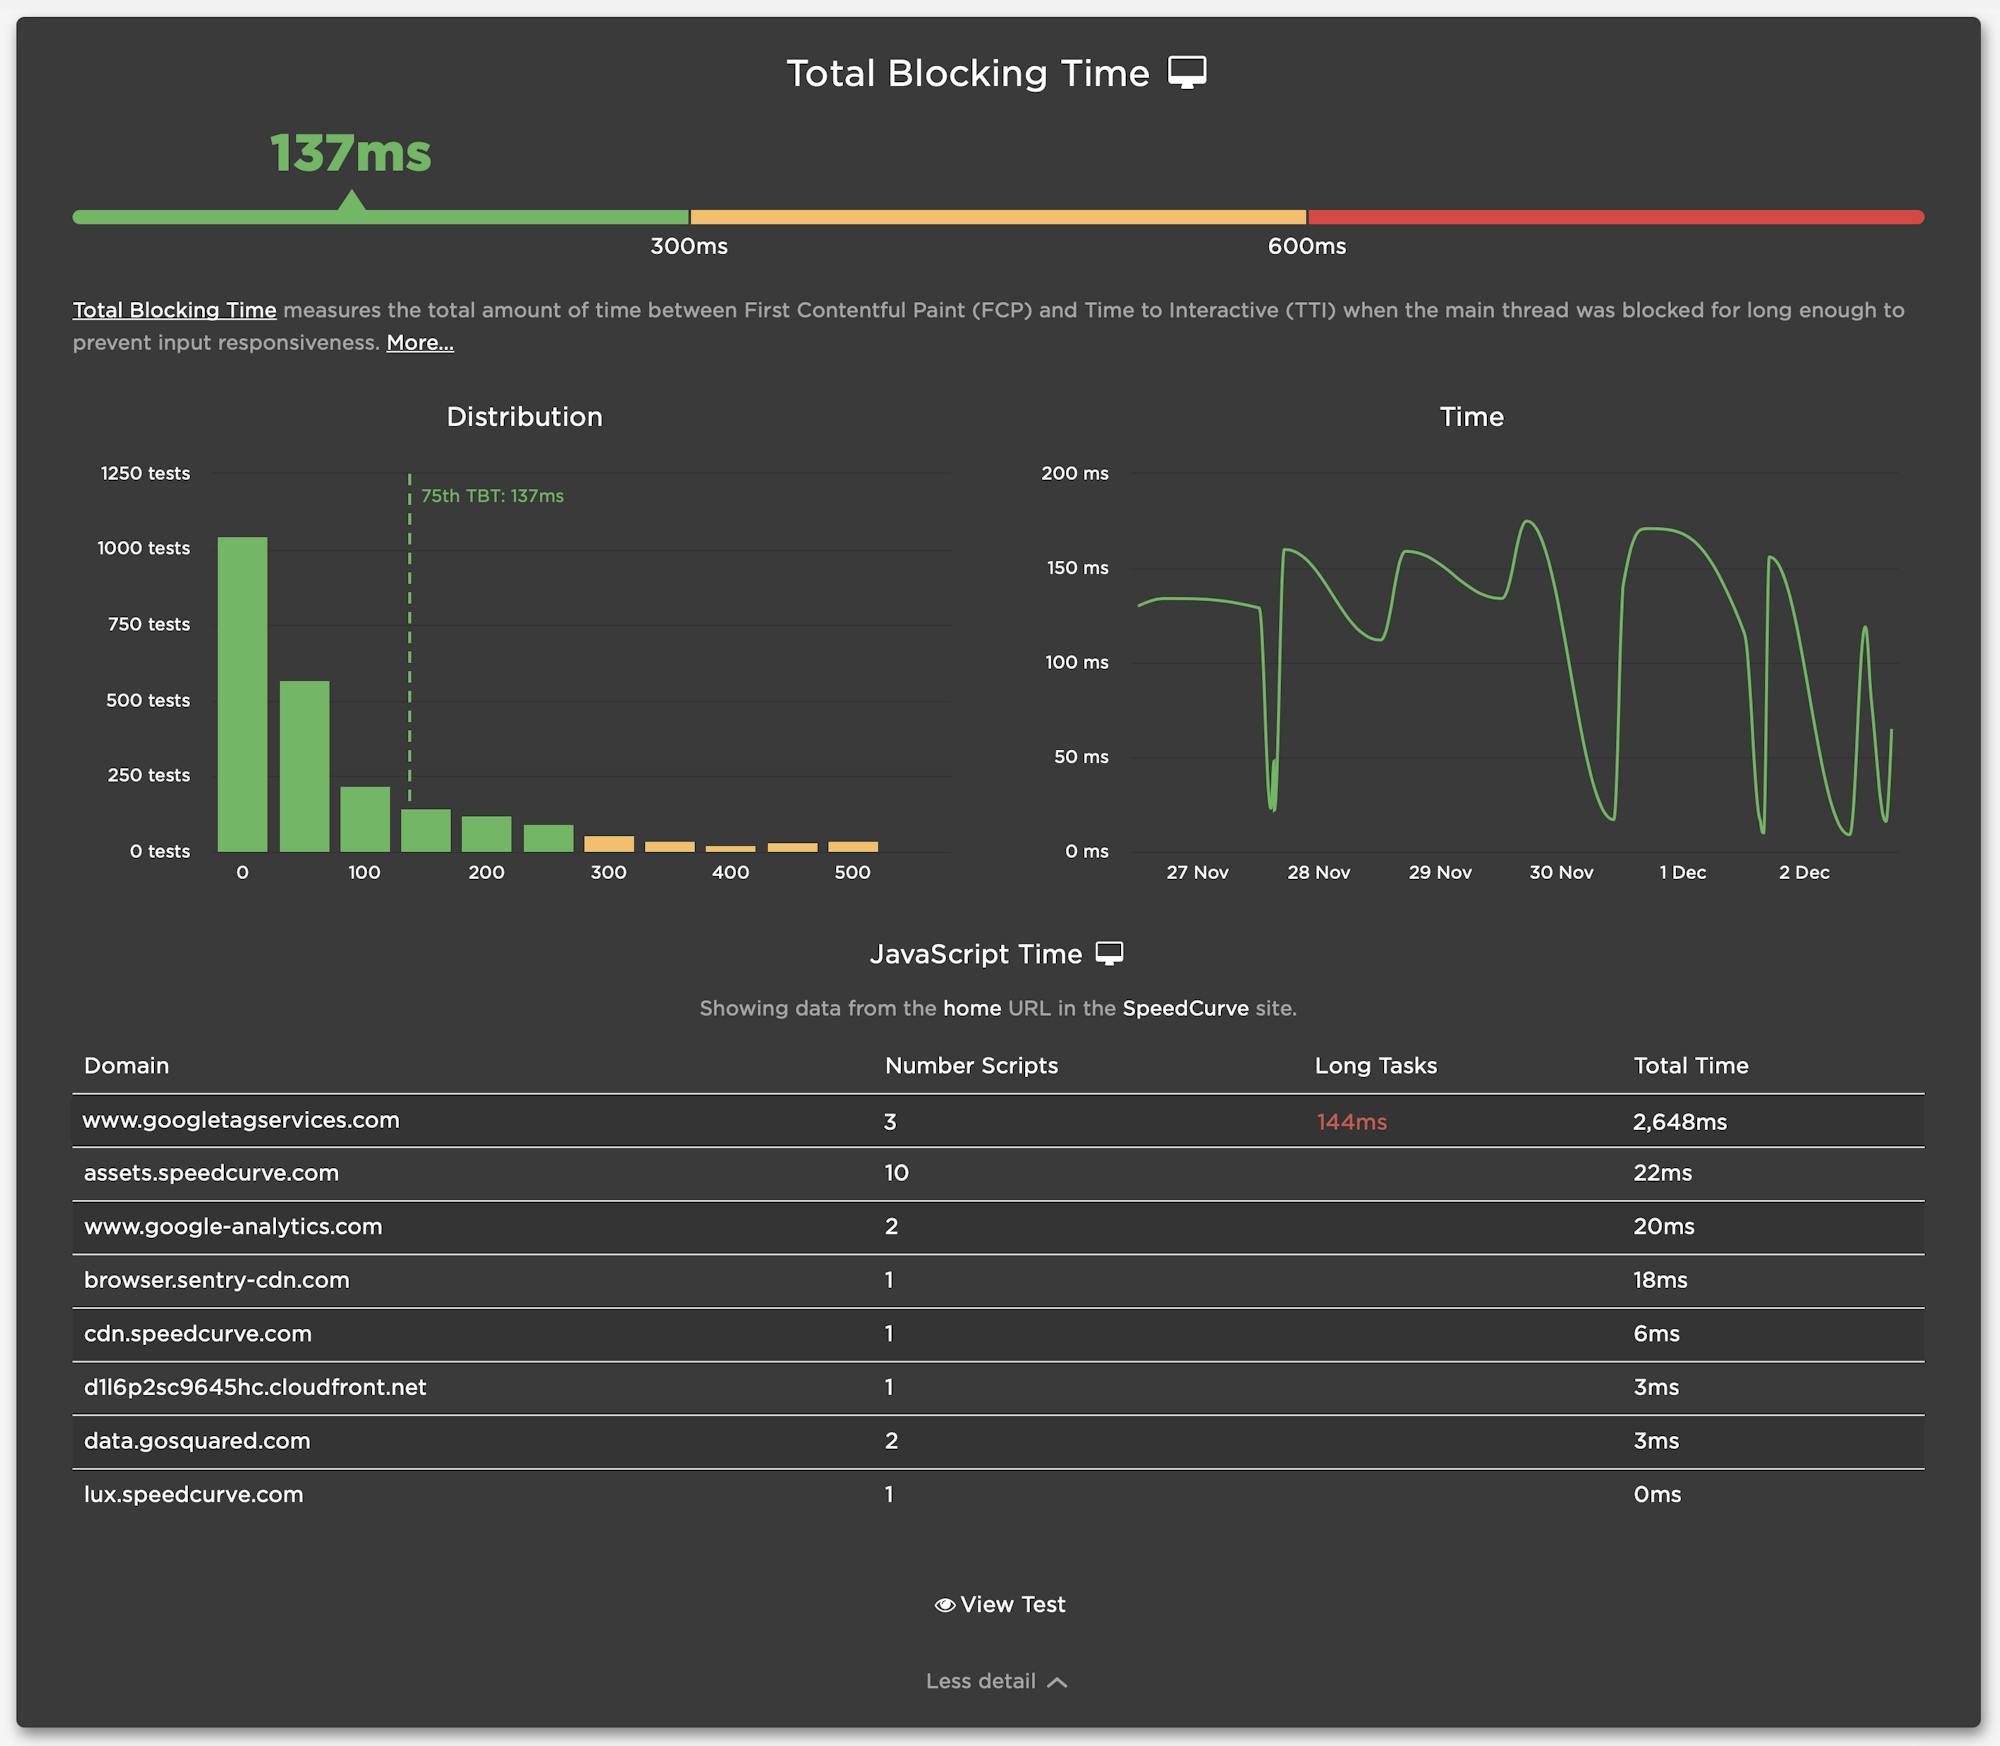
First Input Delay (FID) & Total Blocking Time (TBT)
Both of these metrics are represented in the Vitals dashboard. If you're just focusing on FID, you're likely putting your users at risk of suffering from a poor JavaScript-induced experience. (More on that here). We think there's a lot of value in looking at both Total Blocking Time and First Input Delay to get a better idea of how JavaScript is affecting your users. While we capture Long Tasks, Longest Task and Number of Long Tasks with RUM, synthetic gives us attribution for these offenders. The table in the TBT section shows you the domains responsible, with links to the specific test details. Now that's actionable data!
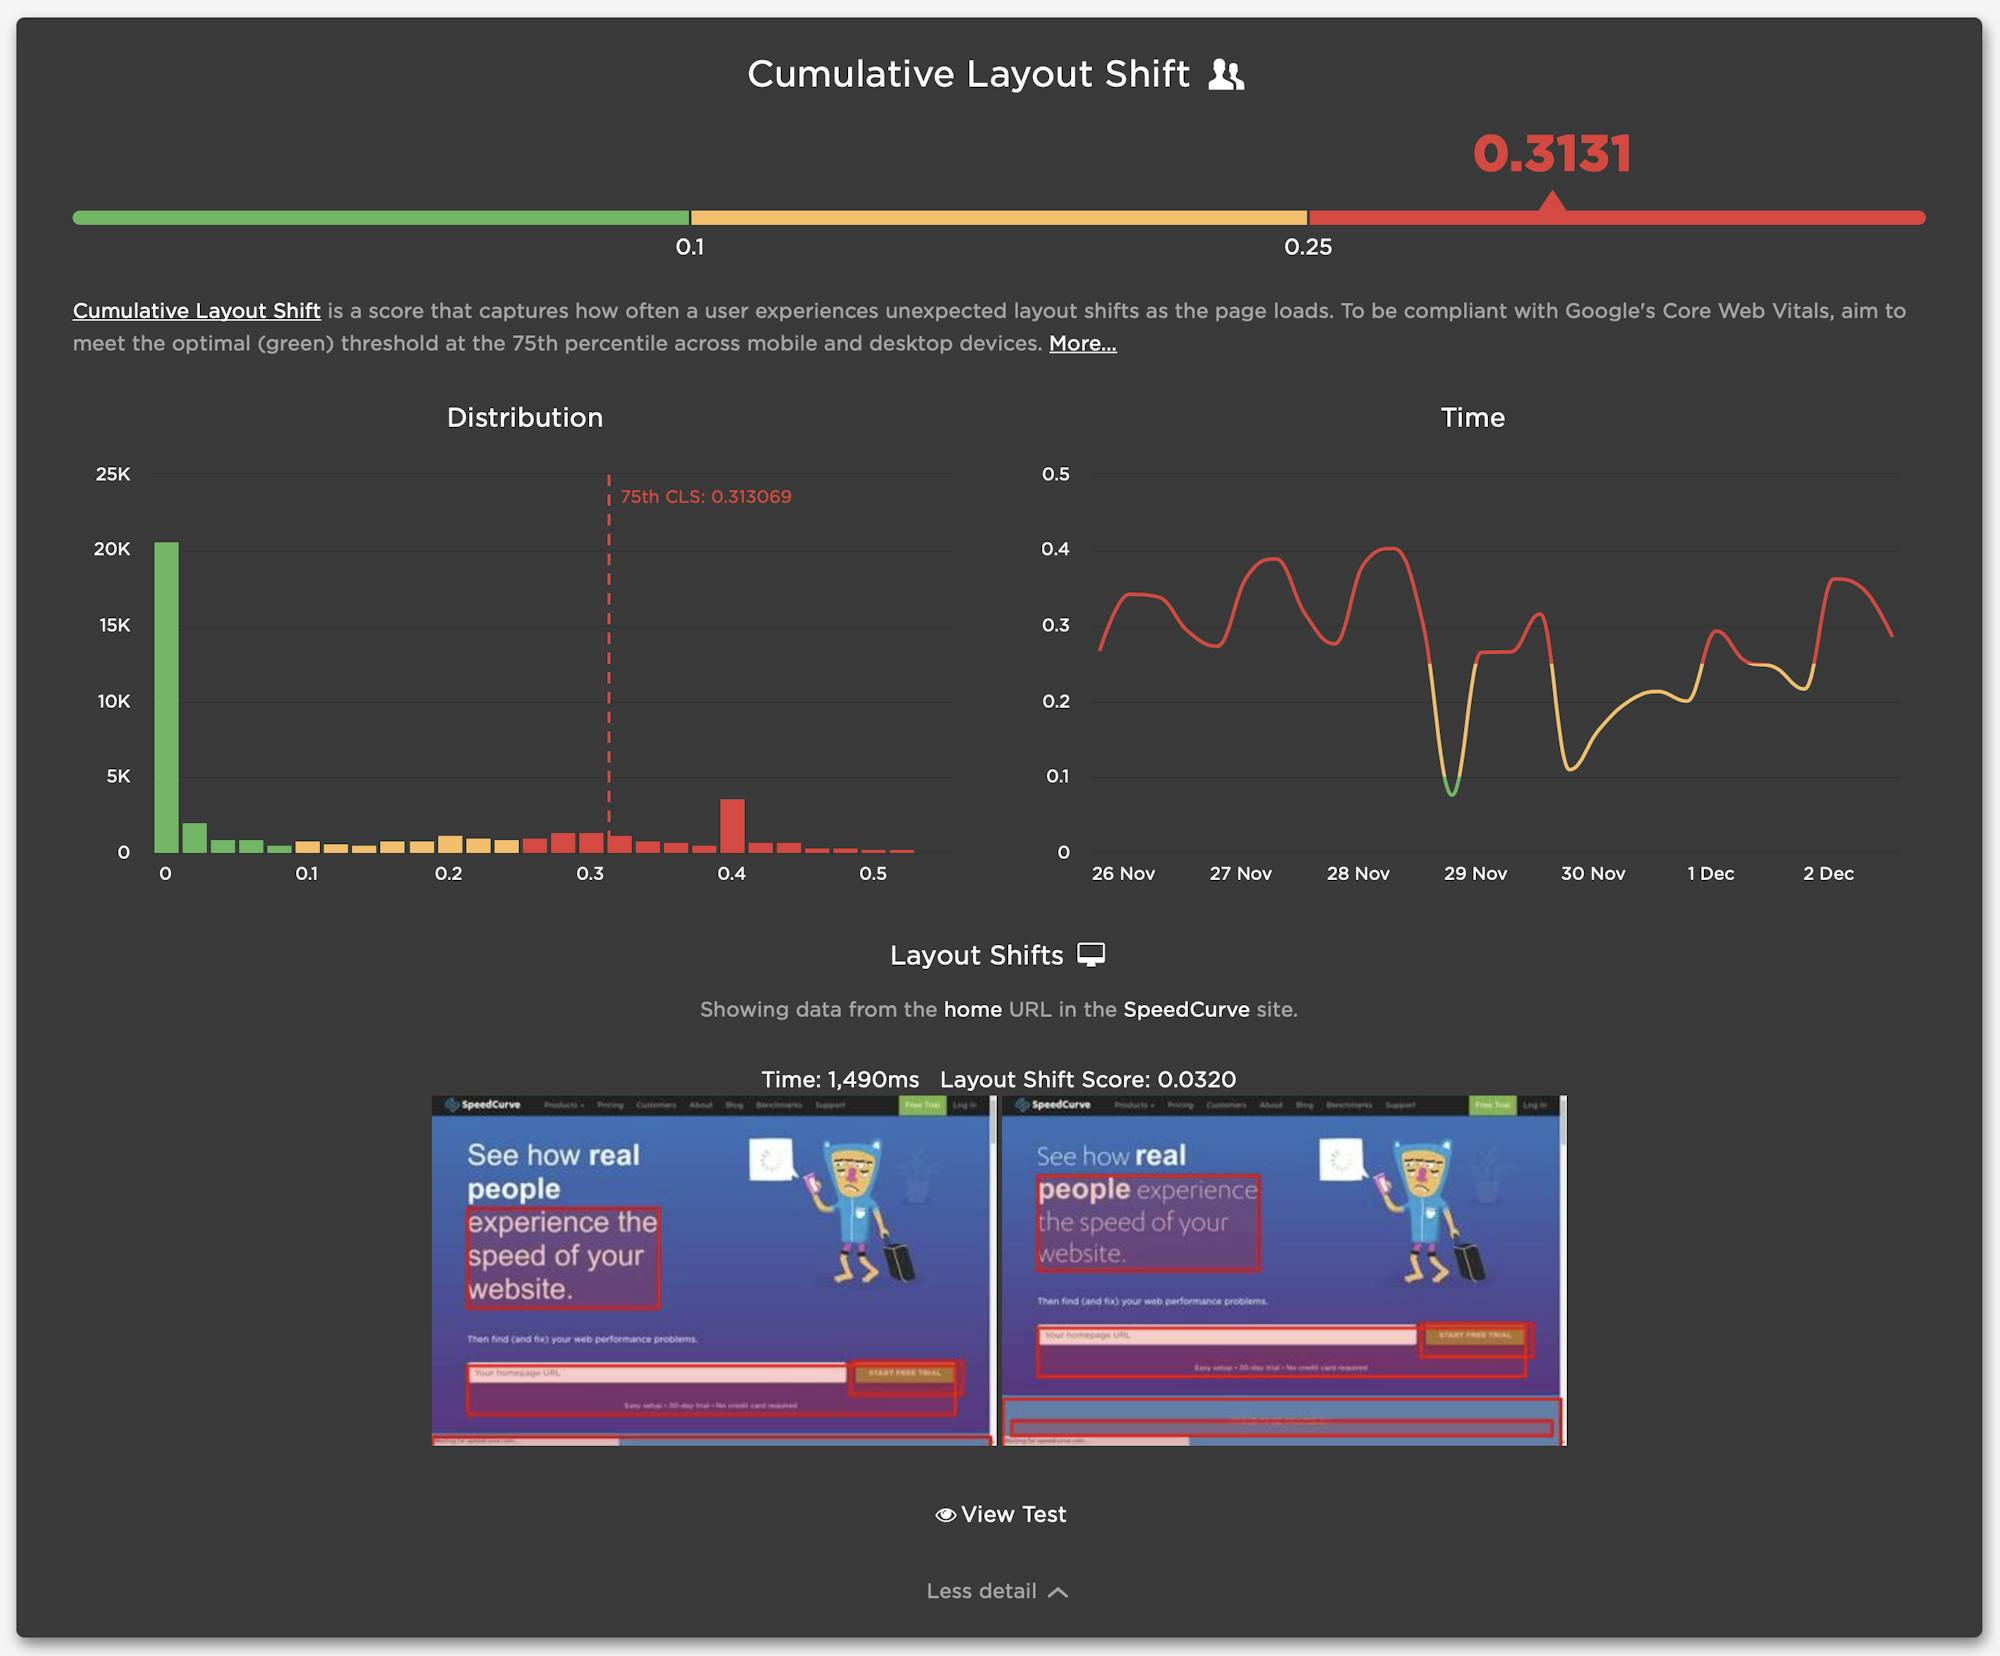
Cumulative Layout Shift (CLS)
If you've seen Tammy's recent post on CLS, as well as the new visualizations introduced by Mark, you'll know we've been spending A LOT of time thinking about how to help you understand and debug CLS. That work has been included here to help you understand your score and identify the layout shifts that drive it.
Things you may ask (or that we want to tell you anyway)
What if I don't have RUM with SpeedCurve?
Don't fret. If you have RUM with someone else, that's great! We still love you. (If not, feel free to try our RUM.) Just make sure you're using RUM somewhere, as it's crucial for understanding Vitals. But if you're not using our RUM tool, we still want you to get use out of this dashboard, so we'll default to showing you synthetic data.
Add page labels in Synthetic and RUM
By default, we'll make attempts to match up your RUM and Synthetic data. To ensure we get this right – and to give you more flexibility as you dive into Vitals – it is REALLY important that you set your page labels in RUM and Synthetic to match. More on this here and here.
Where can I learn more about Web Vitals?
- Check out our support center if you have specific questions
- Keep reading this blog! We have lots that we've said and more that we'll say on the topic
- Subscribe to our YouTube channel and look for videos on vitals and other interesting topics
- Here's another great place to start: https://web.dev/vitals/