NEW! Monitor Long Animation Frames and get to the bottom of your JavaScript issues

CPU consumption by the browser is one of the main causes – if not the number one cause – of a poor user experience. The primary culprit? JavaScript execution. Now you can use SpeedCurve to monitor Long Animation Frames (LoAFs) and fix the third parties and other scripts that are hurting your page speed.
Until recently, we've had little evidence from the field that definitively attributes the root cause of rendering delays. While JavaScript Long Tasks gave us a good indication that there were blocking tasks affecting metrics such as Interaction to Next Paint and Largest Contentful Paint, there was no way to attribute the work or understand how it was ultimately affecting rendering.
Fortunately, we've gotten a lot of help from Chrome in improving the attribution – and ultimately the actionability – of the data we collect in the field with RUM. The introduction of the Long Animation Frames API (LoAF) not only gives us better methods for understanding what's happening on the browser's main thread, in some cases it also gives us attribution to both first- and third-party scripts that occur during a LoAF.
This has been a highly anticipated addition to SpeedCurve, which is available for all our RUM users today. This post covers what's new in the product and points you to a few new resources to help you get up to speed on all things related to LoAF.
What's new in your SpeedCurve dashboards?
Despite the complexity that comes with measuring script-related performance in the wild, our LoAF release is relatively straightforward.
In short, we've:
- Added new metrics and made them available throughout the product
- Created helpful new data visualizations in three of your dashboards
- Added a valuable new visualization to your RUM waterfall
New metrics
The LoAF API allows us to derive several useful metrics that are powerful tools in your monitoring toolkit.
Total Blocking Duration (TBD)
The most notable addition is Total Blocking Duration, currently considered experimental. The intent of TBD is to give us a similar summary metric to Total Blocking Time, which is available in our synthetic tool. Total Blocking Time is often used as a synthetic proxy for understanding how JavaScript execution interrupts the user experience by introducing delays causing slow interactions, slow loading hero images, or other user frustration such as 'jank' during scroll.

Total Blocking Duration (TBD) is different from Total Blocking Time (TBT) in a few ways:
- LoAFs that contribute to TBD are measured from the beginning of the page load for 60 seconds or until the user leaves the page (whichever occurs first).
- TBT measures the sum of Long Tasks, while TBD measures the blocking duration for all LoAFs measured as described above. LoAFs are fundamentally different from Long Tasks.
If you're a RUM user, you'll see Total Blocking Duration throughout your dashboards, most notably featured as a hero metric in your Vitals dashboard (as shown above).
Other new metrics
We've also added these metrics, which will help you dig into LoAF in a number of nuanced ways:
- LoAF Total Duration – Total duration of ALL LoAFs measured
- LoAF Entries – Total count of ALL LoAFs measured
- LoAF Style and Layout Duration – Time spent calculating style and layout for the frame
- LoAF Work Duration – Total duration of non-rendering phases across ALL LoAFs
- LoAF Script Total Duration – Total duration of scripts that executed across all LoAF entries
You'll be able to track all these metrics in custom charts in your Favorites dashboards.
Vitals dashboard updates
The Vitals dashboard has been updated in a few areas. As mentioned earlier, Total Blocking Duration is a Beta metric that appears for RUM users in place of Total Blocking Time. Additionally, in the TBD section we've added a table for Execution Duration by dimension.
In this example, we can quickly see which page groups are most heavily affected by total Execution Duration:

A secondary table shows you scripts that are attributed to Long Animation Frames. These scripts are both first-party scripts (origin) as well as third-party scripts (external vendors). You can see the total duration for the script (note, this is inclusive of blocking but not exclusively blocking duration) as well as any forced style and layout attributed to that script.

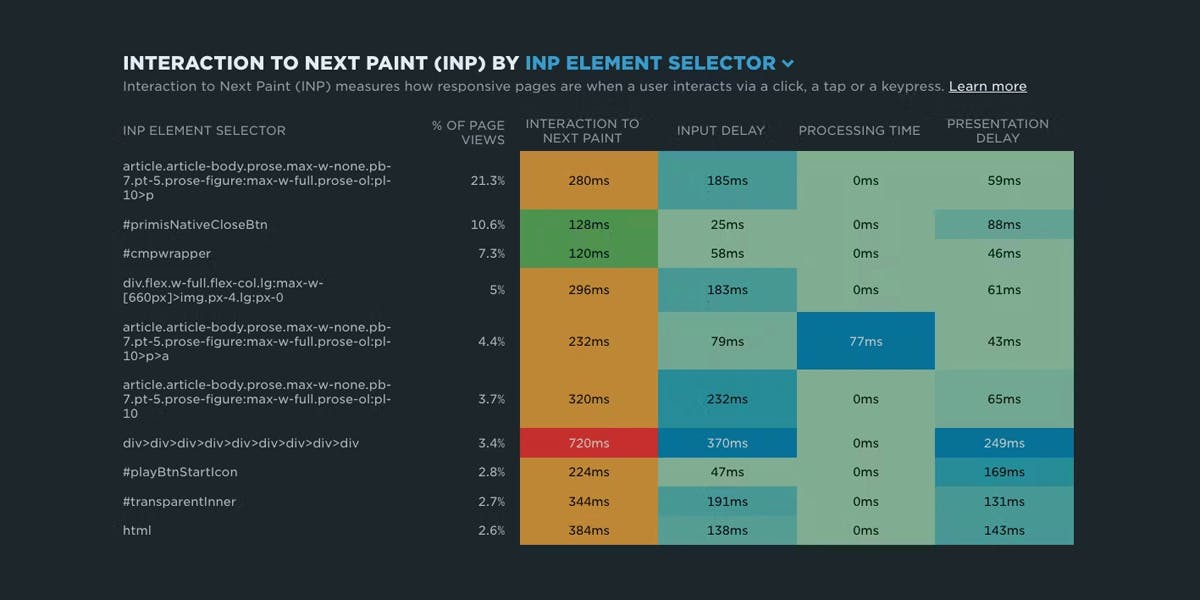
In the Interaction to Next Paint (INP) section of the Vitals dashboard, you have a new table that shows scripts attributed during the INP phase.

You can also filter this table to scripts that occurred during the different INP subparts: Input Delay, Processing Time, and Presentation Delay.

RUM JavaScript dashboard updates
The Execution Duration by Script shown earlier in the Total Blocking Duration Vitals section also appears at the top of the JavaScript dashboard. Additionally, dimension tables for Page Labels, Device Types, and Browsers have been updated to included LoAF Entries, LoAF Total Duration, and LoAF Total Blocking Duration.

Home dashboard updates
Your Home dashboard now includes a table for the slowest scripts and their total execution duration.

Drilling into your RUM waterfall
When you're diagnosing an issue, you can drill into a set of sessions for further interrogation. This is useful when investigating a spike or a baseline change to a metric in a time series chart, or if you simply want to learn more about the demographics and see some example sessions that meet the chosen criteria.
Clicking on a time series chart gives you a few options. Click on 'View Sessions' to drill in further.

The 'Sessions' section of the dashboard lists individual sessions you can explore. In this case, we're looking at an example of a session where INP was high.

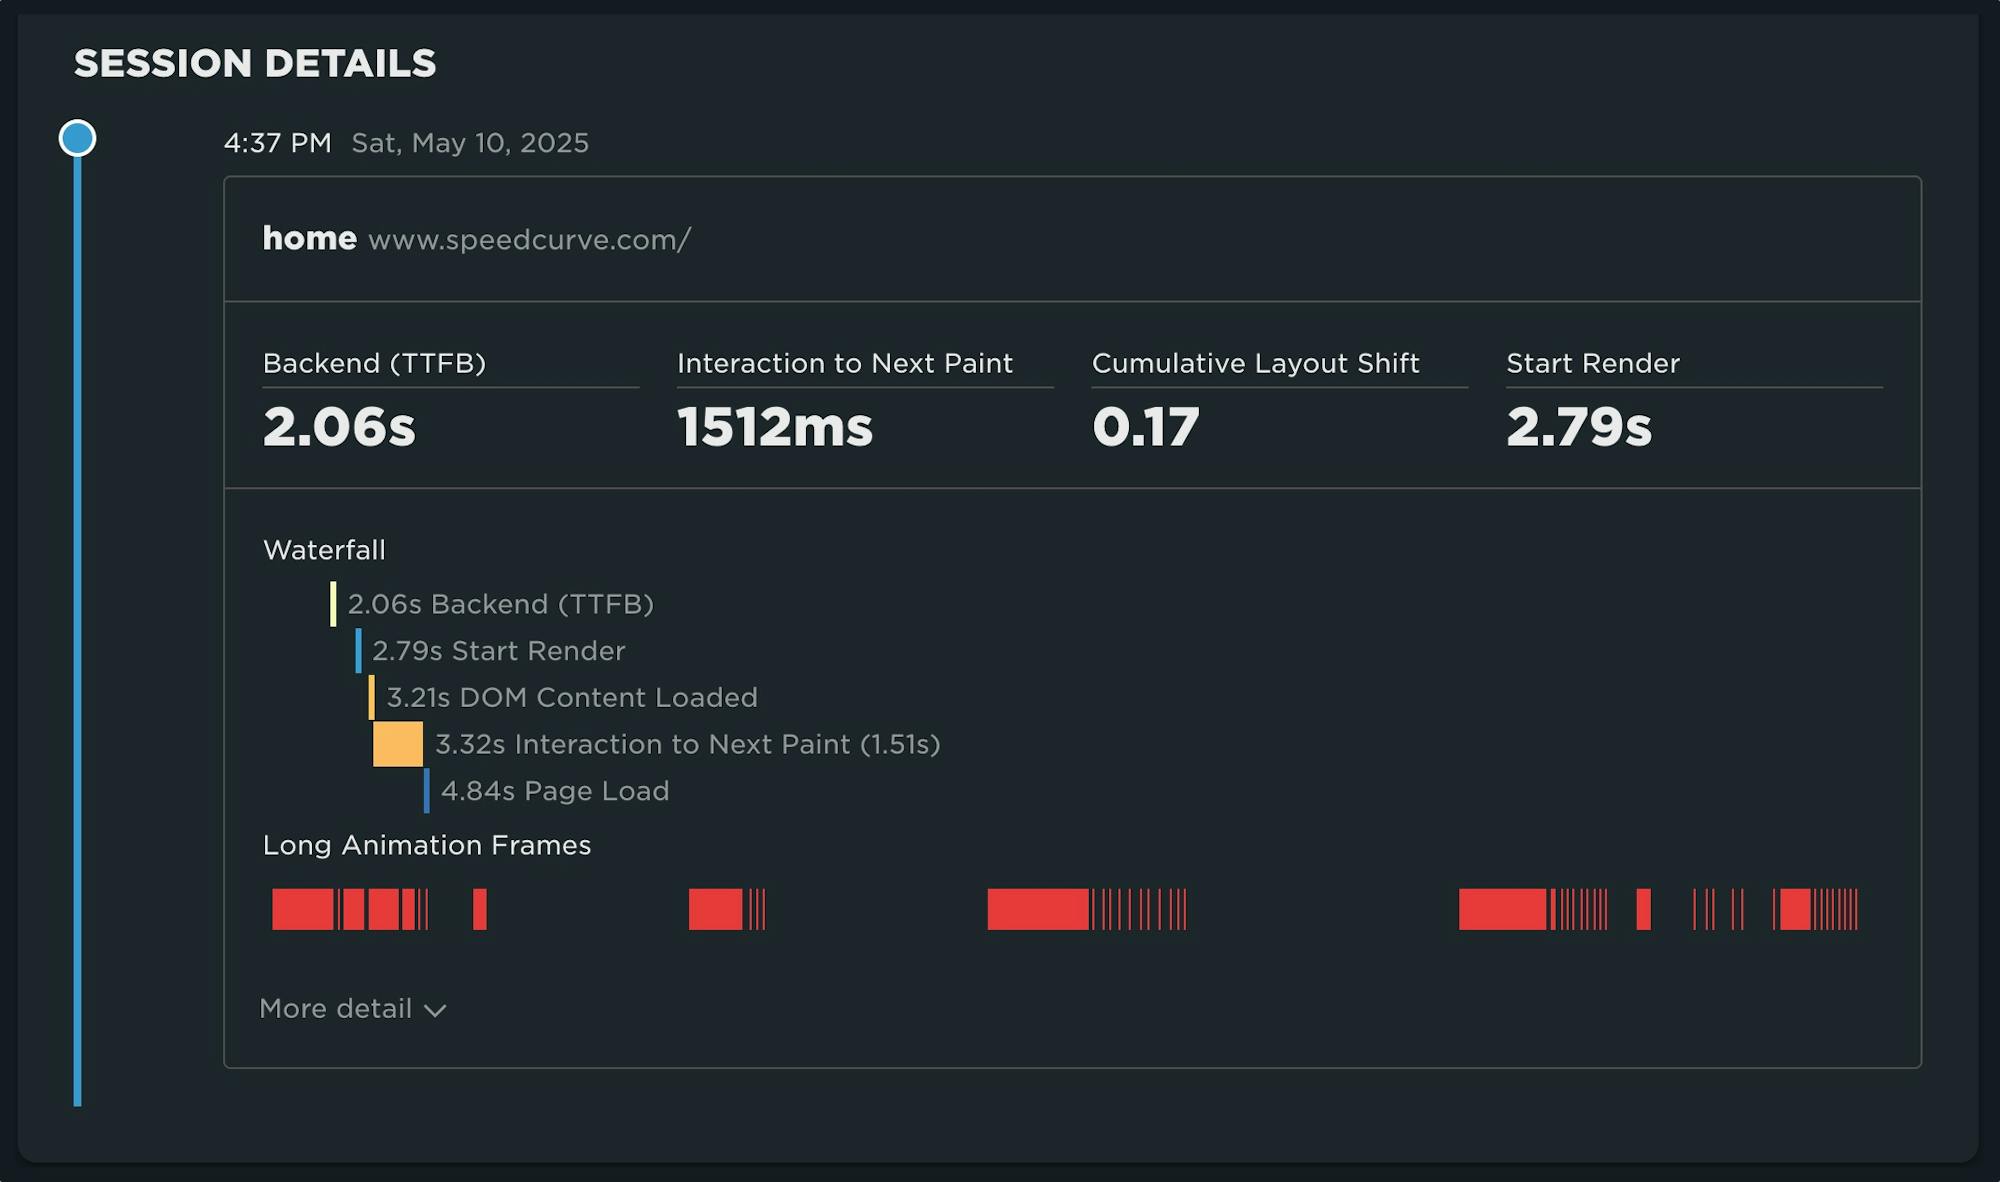
Clicking on the session gives us details for each page in the user's session. We've introduced a new visualization that shows you Long Animation Frames (the red bars) aligned with the waterfall chart above, which lets you see when the LoAF occurred during the rendering timeline.
Hovering over each red LoAF gives more attribution detail, listing scripts that executed during the LoAF. In this example, we can see attributed scripts and their duration (important, this is not just blocking duration). You'll also see Unattributed time, which can't be attributed to a specific script.

More resources
This is a complex topic. While we've done our best to simplify how you think about and monitor LoAF, there are a few resources that go much deeper and provide a lot of understanding that may be useful.
My colleague Andy Davies provides a wealth of information in his latest post, a detailed guide to understanding LoAF. Andy has also created a great debugging guide for investigating INP.
Our Support Hub is a good resource for everything from understanding how to navigate JavaScript-related issues in SpeedCurve to interpreting what all these metrics mean
Get started!
Interested in tackling your JavaScript issues, but don't have RUM? Start a free trial today!
If you're already a SpeedCurve customer but you're not using RUM yet, send us a note at support@speedcurve.com and we'll enable your RUM trial and help you get started.