Are your retail landing pages killing conversions?

You've probably started to notice retail campaigns for Halloween, Thanksgiving, and even Christmas! Online campaigns are pricey, so the landing page should be the MOST scrutinized page of your site — but too often it's an afterthought.
I tracked the rendering times of campaign landing pages for leading retailers to see how they compare — who's fast, who's slow, and what's causing their page speed bottlenecks.
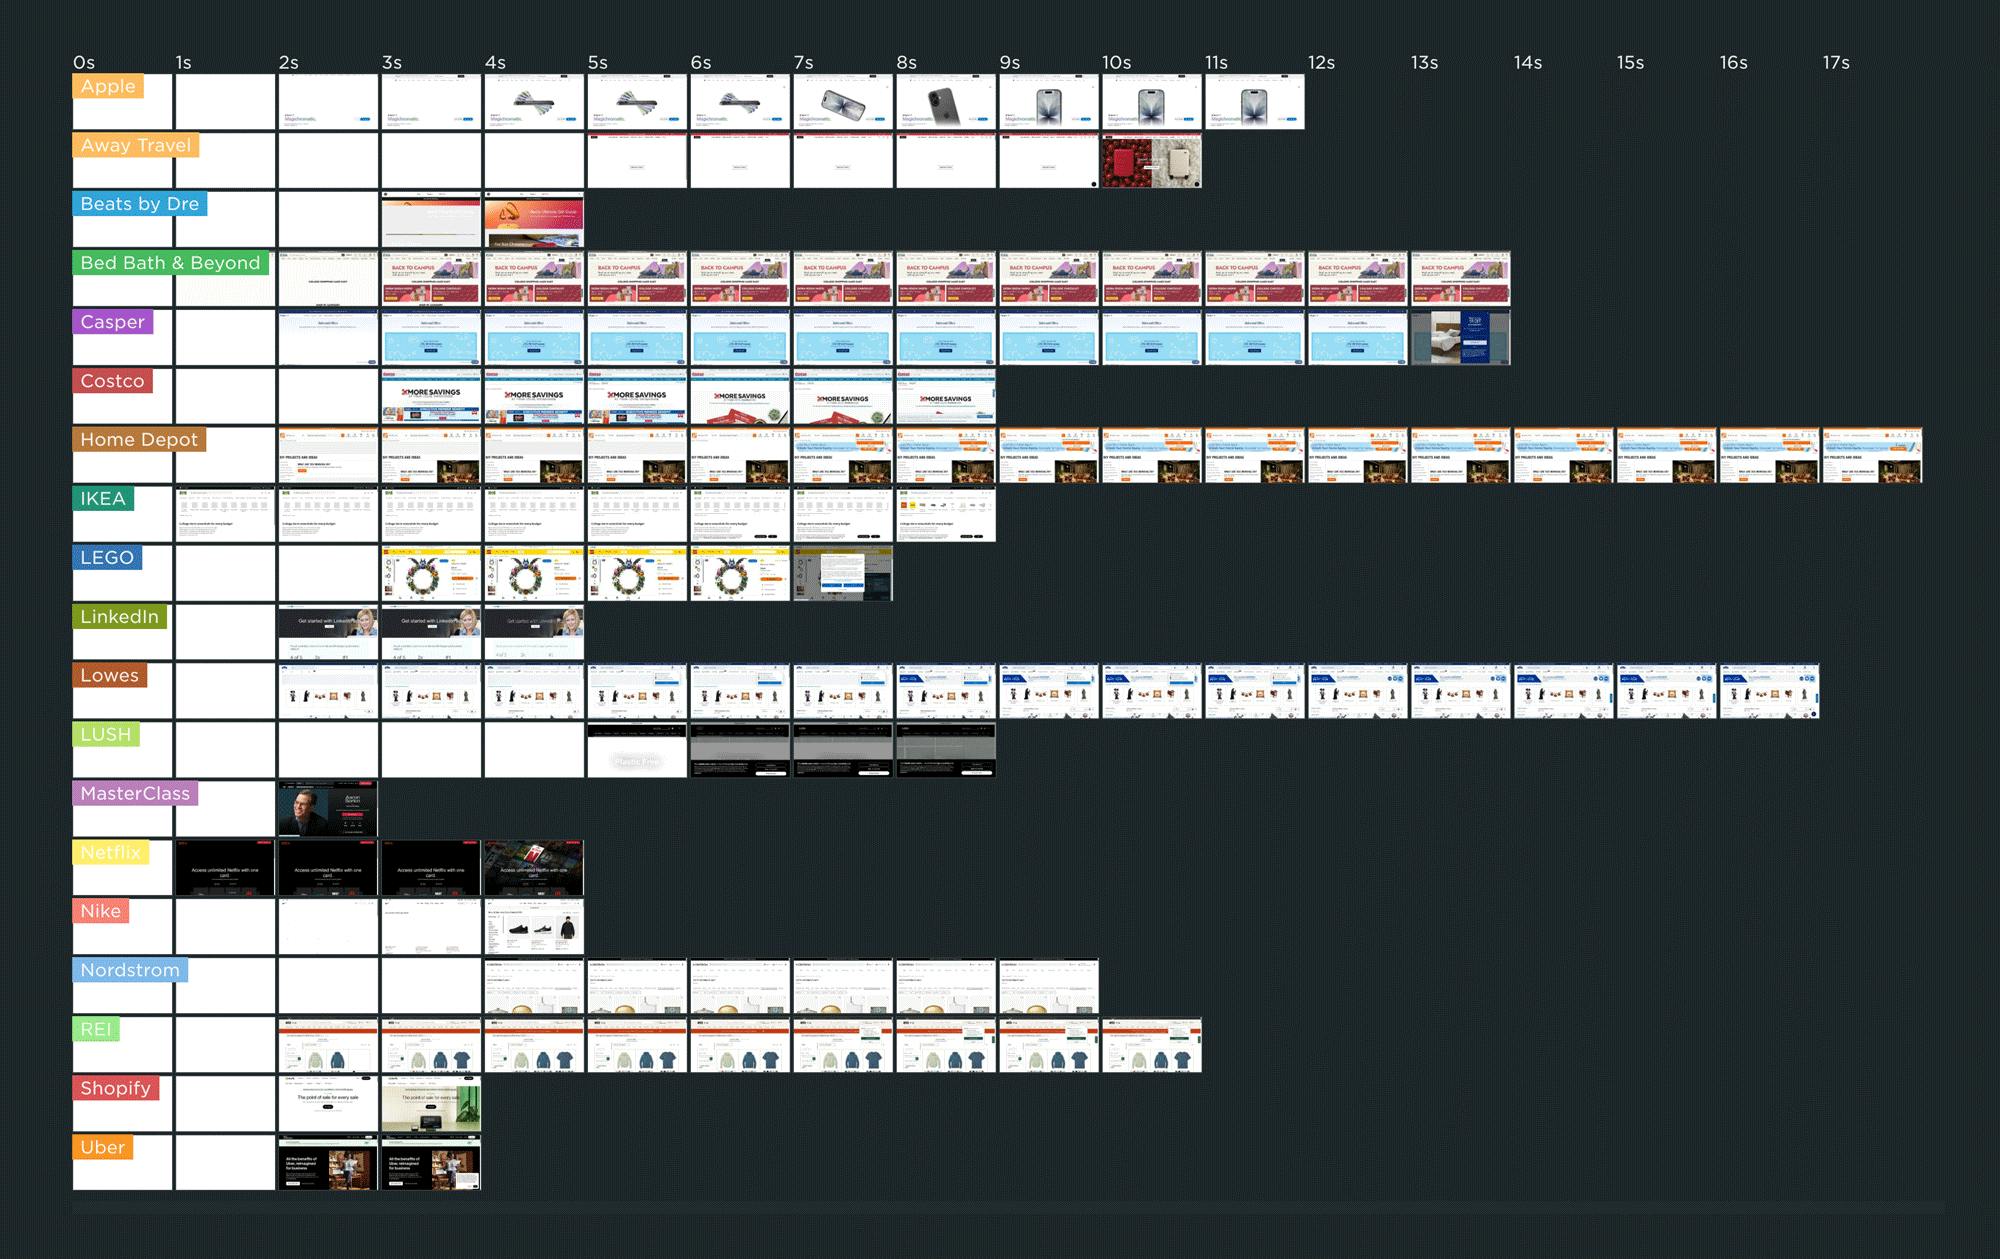
As you can see in this competitive benchmarking leaderboard, rendering speeds varied across pages ranging from Apple to Uber. The fastest campaign page — which belonged to IKEA.com — started to render in about 1 second, which is great to see.
But for many of the other pages, it was common to wait 3 or 4 seconds — or longer! — to see meaningful content.
In this post, we'll cover:
- Why the speed of your campaign landing pages matters... possibly even more than most of the other pages on your site
- Why performance issues on campaign landing pages often go unnoticed
- Common performance issues on landing pages
- A deep dive into the landing page for one of the sites I tracked
- Who should be responsible for the performance of the landing pages on your site?
- What you can do to make sure your campaign landing pages stay fast
It's crucial to deliver a fast landing page
Retail campaigns are expensive! If you've ever done media buying for a retail site, you know how much it costs to buy all those Google ads, print ads, and other promotions. You're putting a lot of money into getting people to your landing page.
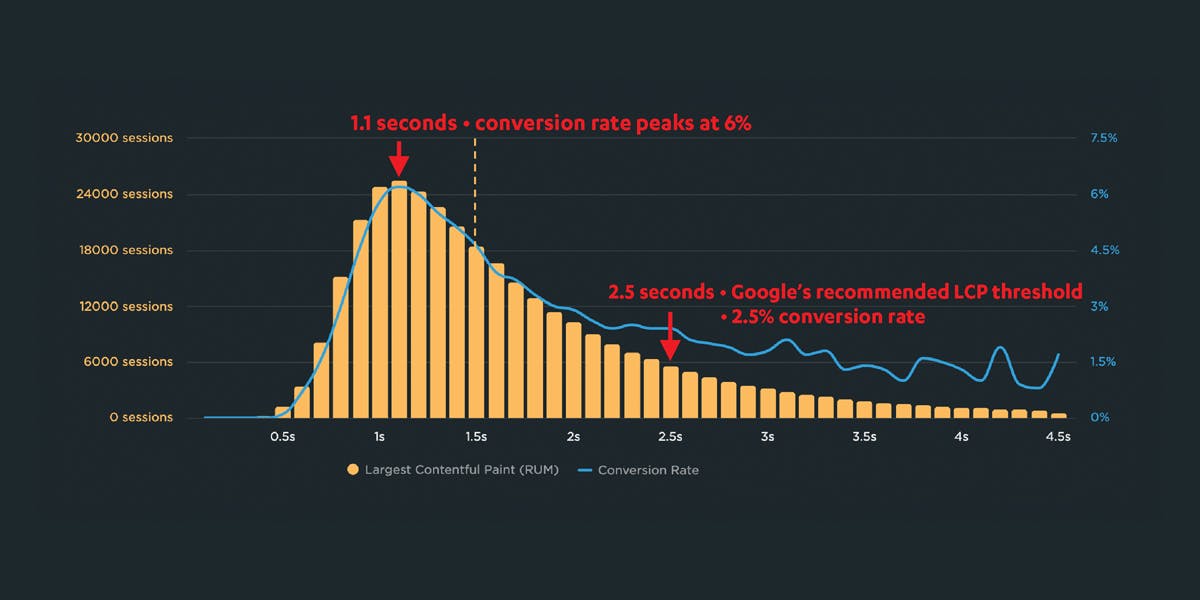
Slow pages have a direct impact on conversion rate. Contentsquare aggregated data from 997 of their customers' retail sites and found the following:
- Visitors who experienced good INP (Interaction to Next Paint, a performance metric that measures the responsiveness and usability of a page) had a 25% better conversion rate than users experiencing poor INP.
- Users who experienced poor INP were more likely to bounce or express frustration (via rage clicks or multiple interactions) than users who experienced good INP.
 Slowness affects your brand. Not only does a faster page boost conversion rate, it also helps ensure that users have a positive perception of your brand — meaning they're more likely to return and shop with you again.
Yet performance issues on landing pages go unnoticed
A campaign landing page should be the MOST scrutinized page of your site during a sales and marketing campaign. Yet too often it's an afterthought.
Yes, landing pages are packed with all kinds of sales and marketing widgets that scrutinize so many parts of the customer journey — social, retargeting, cross-selling, up-selling, A/B testing, and many more.
But that level of scrutiny doesn't extend to understanding:
- the speed and usability of the page
- how users perceive speed and usability
- the impact of user-perceived speed and usability on bounce rate and conversion rate
All of those metrics are measurable, but too often they're not.
Why is page speed ignored?
Campaign landing pages tend to exist underneath the umbrella of marketing. That means they're not always subjected to the same rigour — from a web performance and usability perspective — as the evergreen pages on a site.
(IMPORTANT: I am *not* throwing marketing folks under the bus here. This is an issue with company-wide performance culture, not any one team. More on that later in this post.)
In my experience, there are a few common reasons why the speed and usability of landing pages are overlooked:
- Pages are designed by external agencies, who are disengaged from the lifecycle of the page. Design is treated as a thing that happens at the beginning of a project, so designers don't see the page through to production.
- Pages are built on ecommerce platforms (e.g. Shopify, Wix, Squarespace), where it's very easy to add plugins without understanding the impact on page speed.
- Pages are not performance tested before release. Because they're outside the purview of the performance engineering team, campaign pages are not tested while still in their staging environment, using whatever synthetic performance monitoring tool the performance team regularly uses. (Learn more about pre-release testing in your staging and dev environments.)
- Pages are not monitored after release. You're probably familiar with the idea of "war rooms" on Black Friday and other major retail events. The war room team monitors the site closely for performance disruptions, slowdowns, and other anomalies. Yet campaign pages are often released quietly and without dedicated eyes on their performance.
Performance audit: Awaytravel.com
For this post, I decided to randomly audit one of the pages that had slower rendering times. (Note that this is NOT a name-and-shame exercise. Away is a great company that I have a tonne of respect for.)
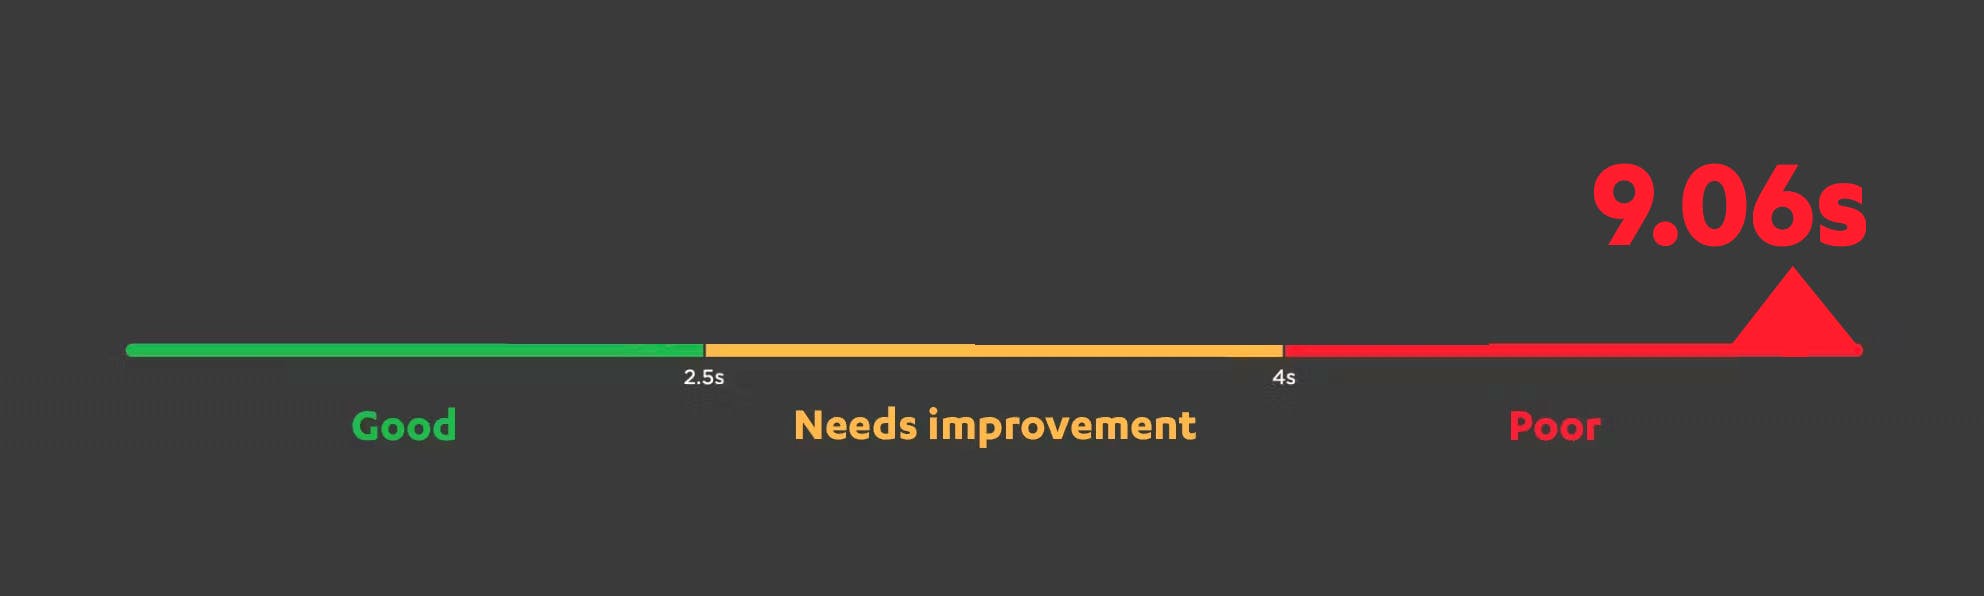
Initial rendering times are slow
This campaign page doesn't start to render until 4.3 seconds, and it takes more than 9 seconds for the largest visual element to render in the viewport.
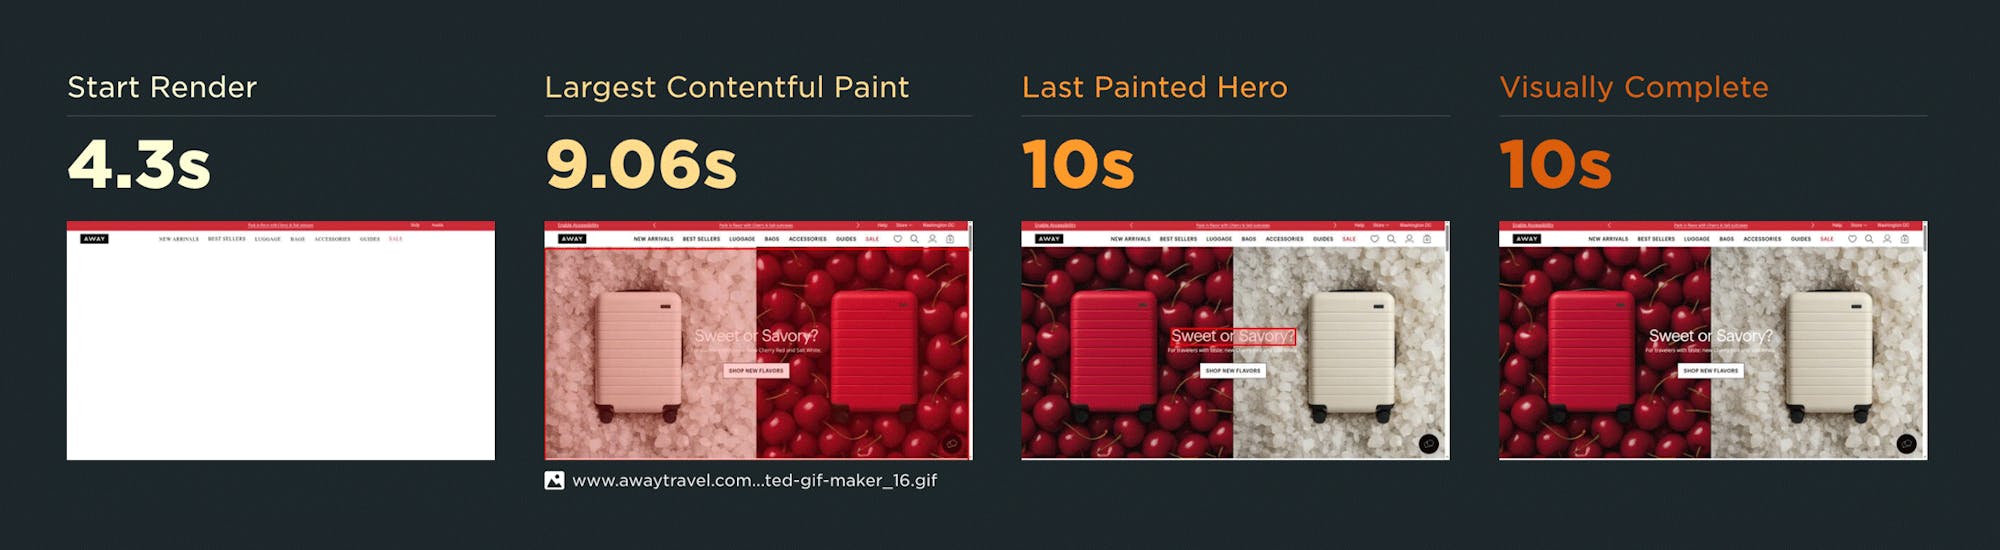
We typically want to see pages start to render in less than 2 seconds. Google considers Largest Contentful Paint (LCP) slower than 4 seconds to be poor. Faster LCP times correlate with greater engagement and — crucially important — higher conversion rates.
Let's dig into what's slowing down this page.
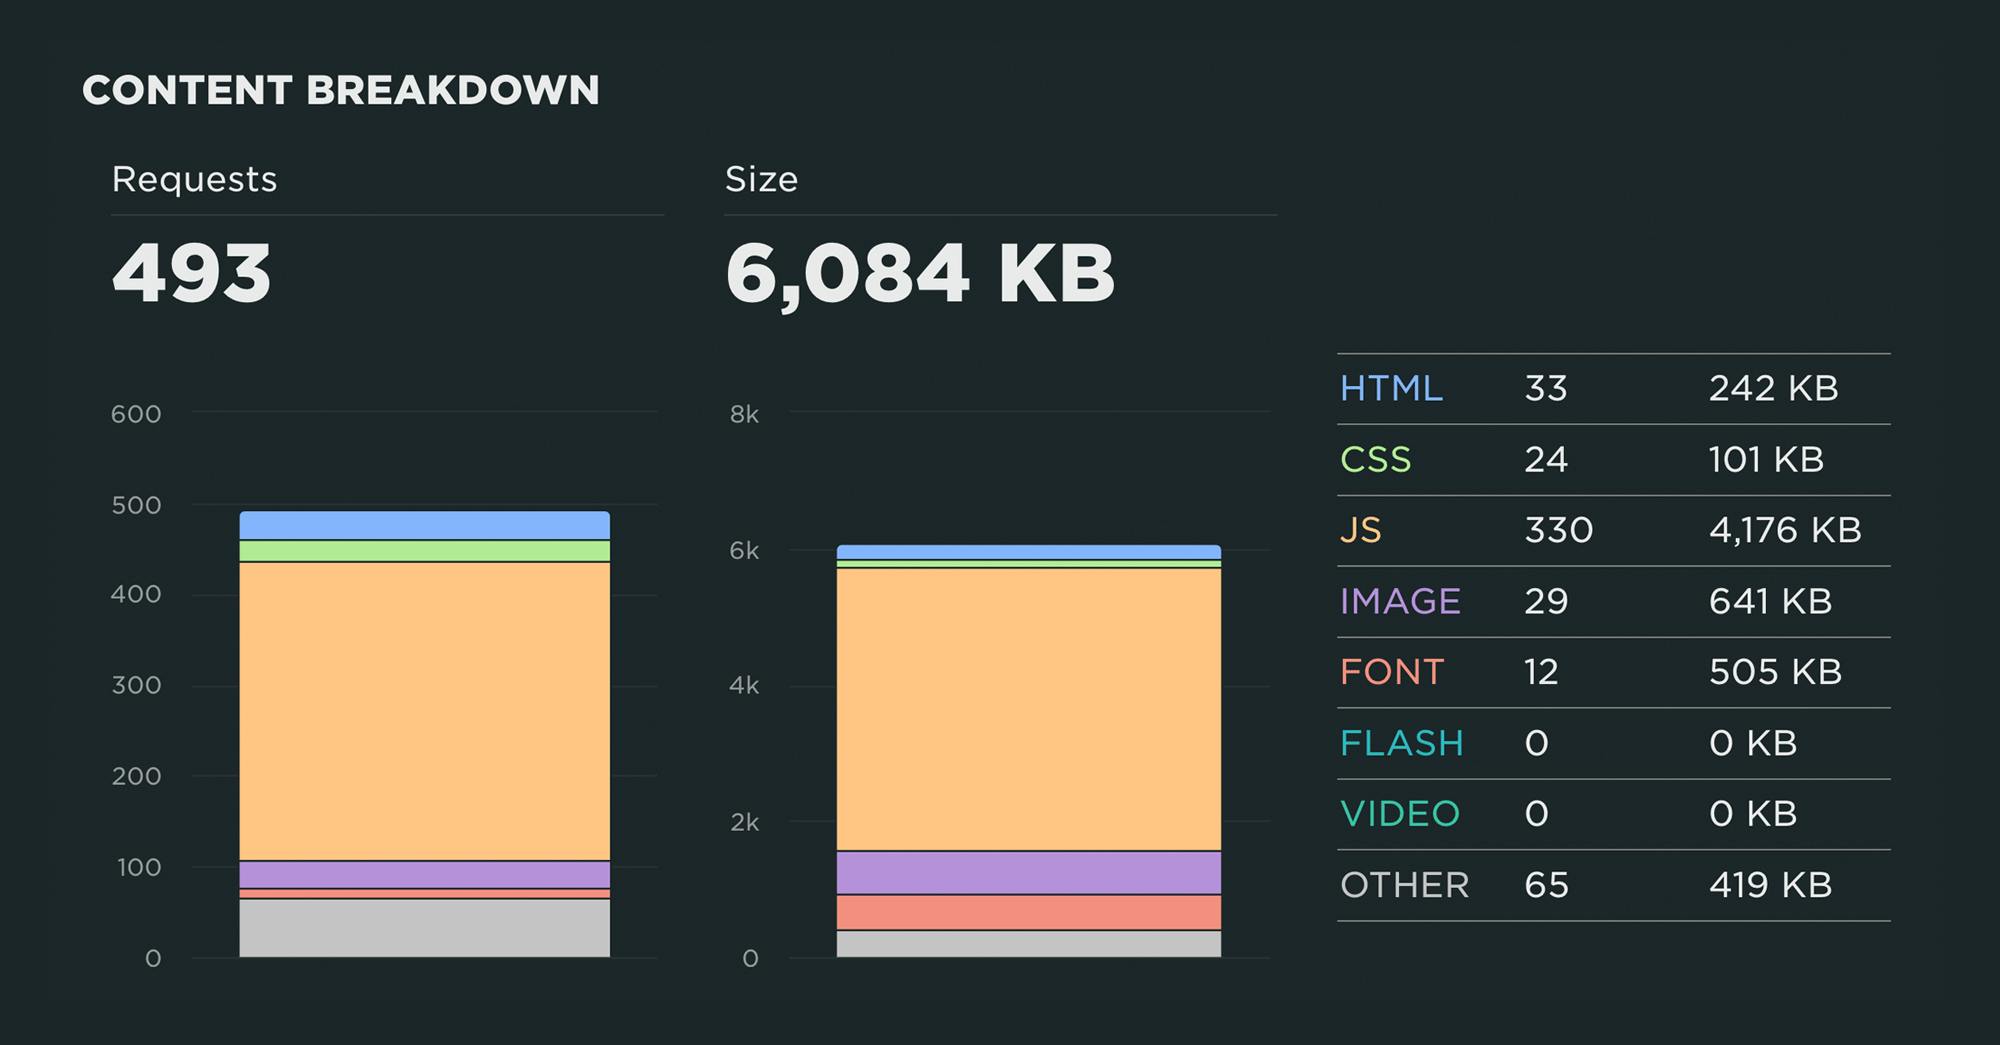
There's a LOT of JavaScript
Looking at the composition of this page, we see that it's fairly large, at around 6MB. More notably, this page contains a very large number of requests — 493 in total, with 330 of those requests in the form of JavaScript.
Excessive JavaScript is always a red flag, but it's not always a cause for concern. If most of these JS requests are being called after the important visual content has rendered and the page has become usable, they're not necessarily an issue. I've seen very large pages, with tonnes of JS, that were still highly performant.
The next step is to figure out if all these scripts are helping or hurting the page.
The critical rendering path is cluttered
Before we investigate what's making a page slow, it's essential to understand the critical rendering path. The critical rendering path is the set of steps a browser takes to convert all a pages resources – from images and HTML to CSS and JavaScript – into a complete, functional web page.
Optimizing the critical rendering path means:
- Taking a good look at the order in which the resources on your pages render. Does essential content and scripting load first? Are non-essential or lesser resources deferred?
- Making sure that each resource in the rendering path is as performant as possible. Are images optimized? Are you using a content delivery network (CDN) to bring elements like images closer to your users, so that delivery times are faster? Are you compressing and caching the right things?
The best way to investigate the critical rendering path is to look at a waterfall chart for the page. A waterfall chart shows you all the resources on the page, the order in which each resource is requested by the browser, and the size and duration of each request, among other things.
Here is a high-level waterfall for the Away campaign page. It shows how key metrics align with the rendering timeline (the filmstrip view at the top of the chart).
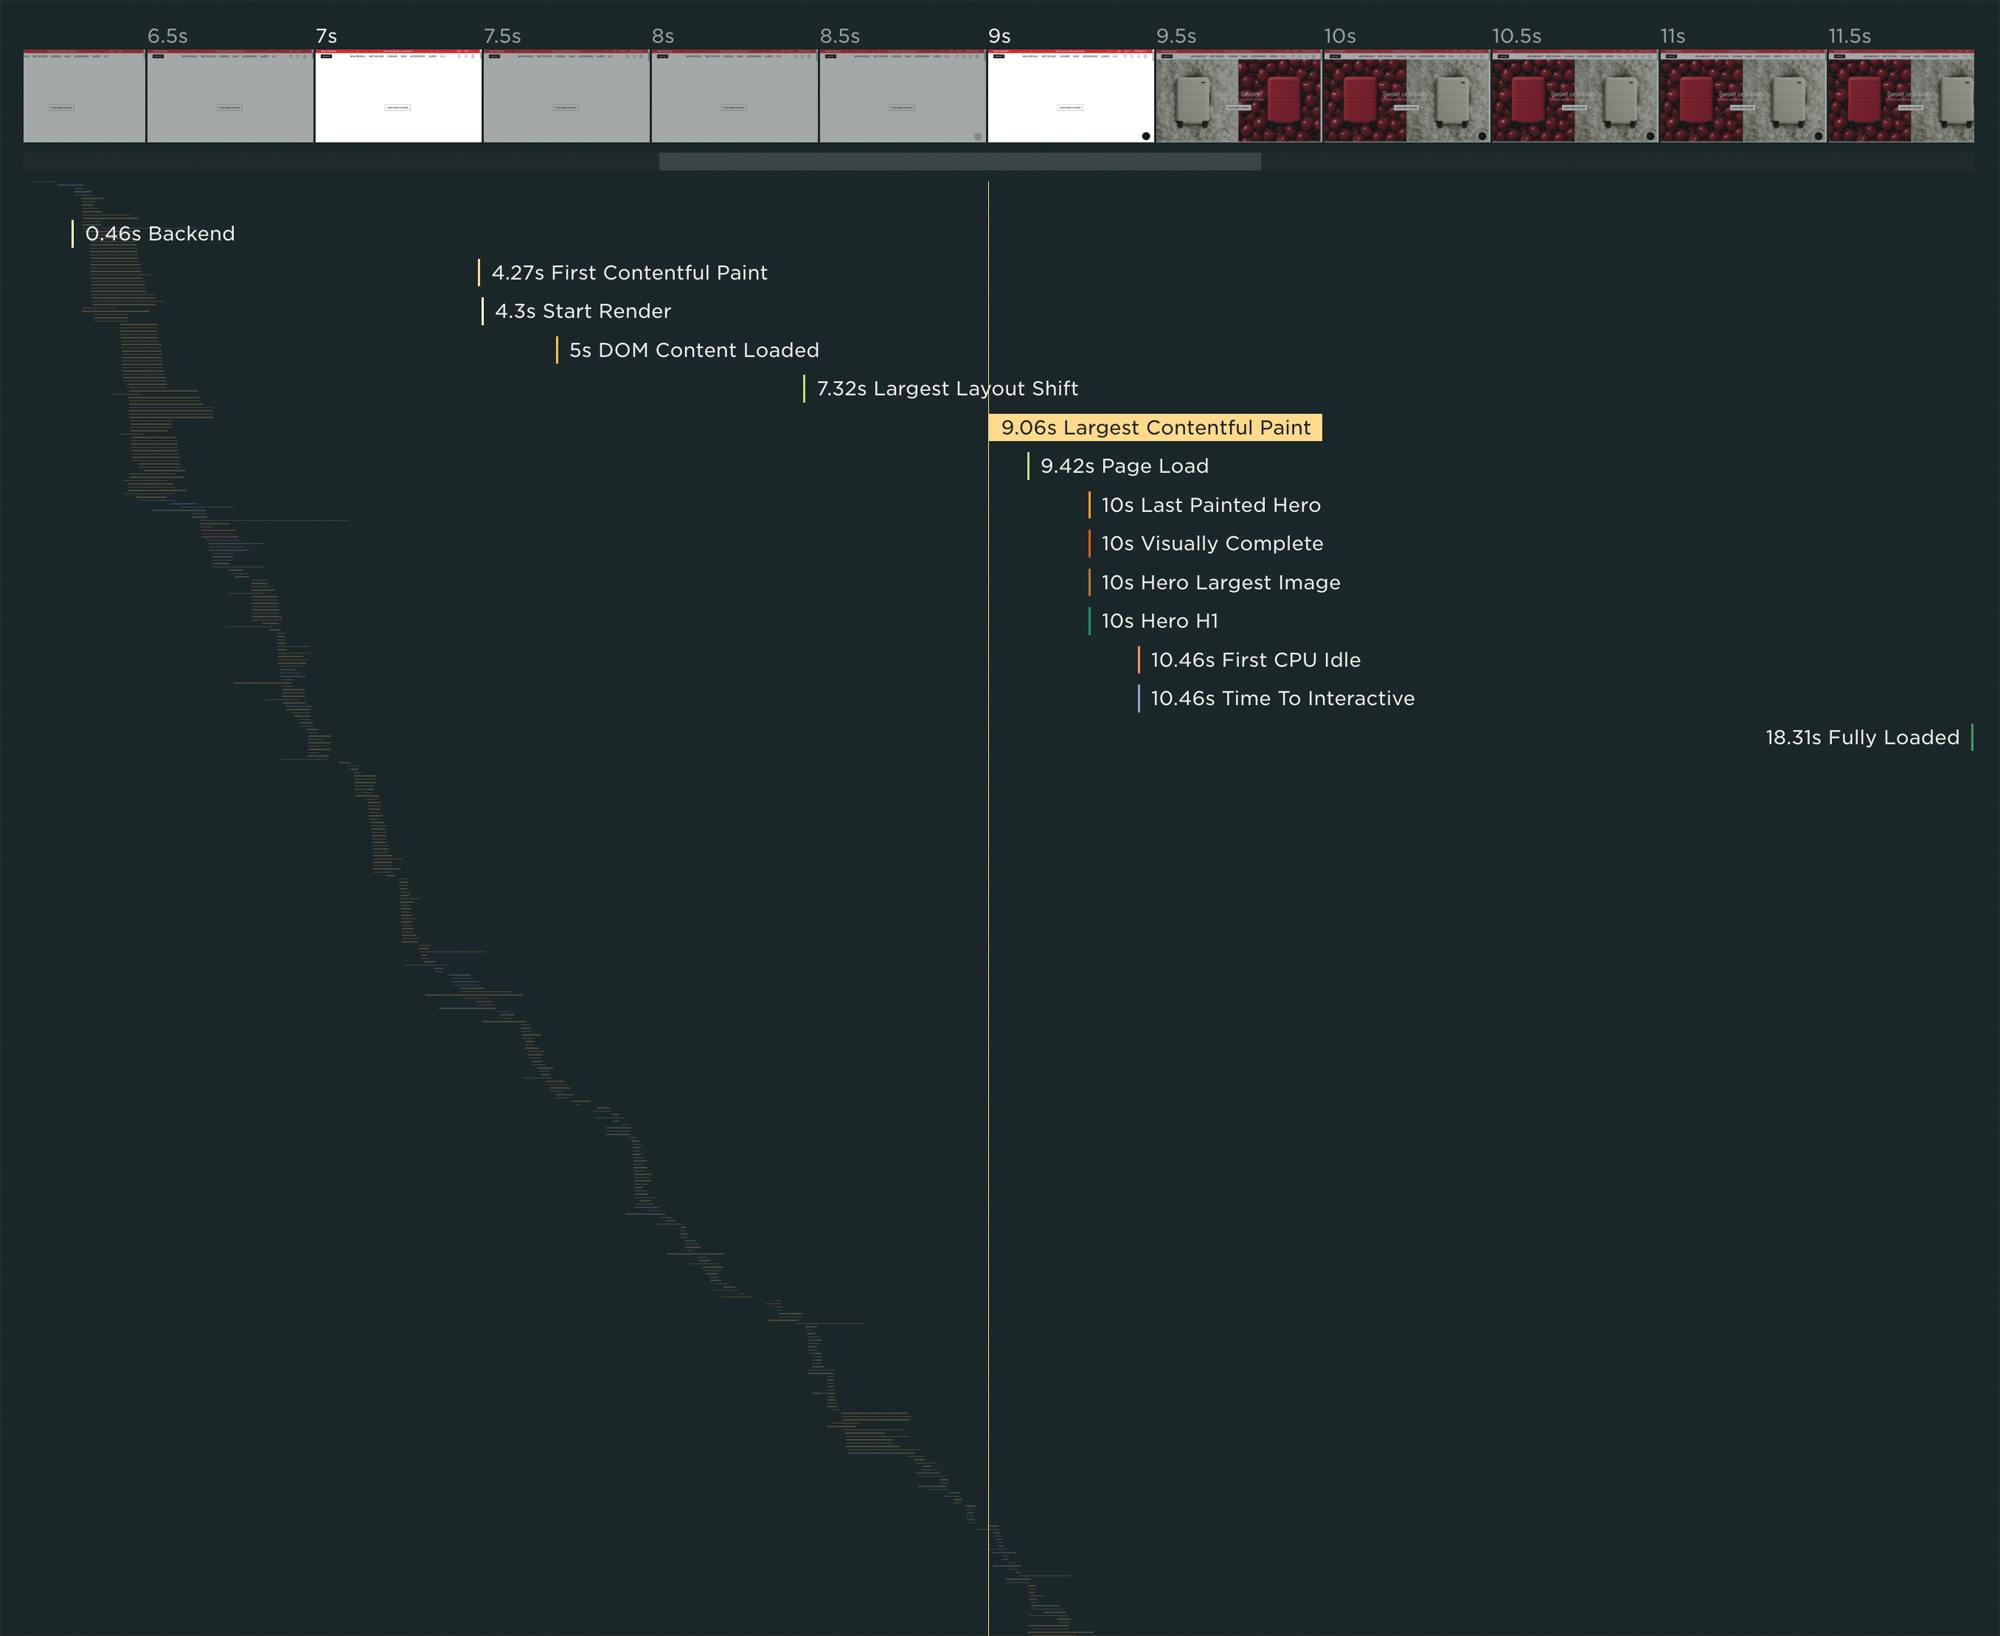
I'm not sharing a visual of the fully expanded waterfall, because it contains more than 600 items, but I can share that more than 400 resources are requested before the LCP event happens.
In other words, there are more than 400 items in the critical rendering path for this page. In an ideal world, the critical path could have as few as three or four requests: the initial HTML, render-blocking CSS (if necessary), render-blocking JS (again, if necessary), and hero image.
Third-party JavaScript is an issue
To investigate the performance of third-party JavaScript, we can take advantage of a nifty feature in SpeedCurve (available under 'Options' in the top right corner of the waterfall), which lets you learn which requests have high CPU usage, as well as excessive main thread activity.
It also lets you group third-party scripts from the same provider so you can get a better sense of the subsequent calls each script generates, along with the performance impact. (Learn more about third-party tracking.)
With third parties grouped, we can see a few things:
- This page contains a large number of third-party scripts, including Google Tag Manager, Google Ads, Tiktok, Reddit, Facebook, Pinterest, Criteo, and Amazon.
- The bulk of these third-party calls happen before LCP — in other words, in the critical rendering path.
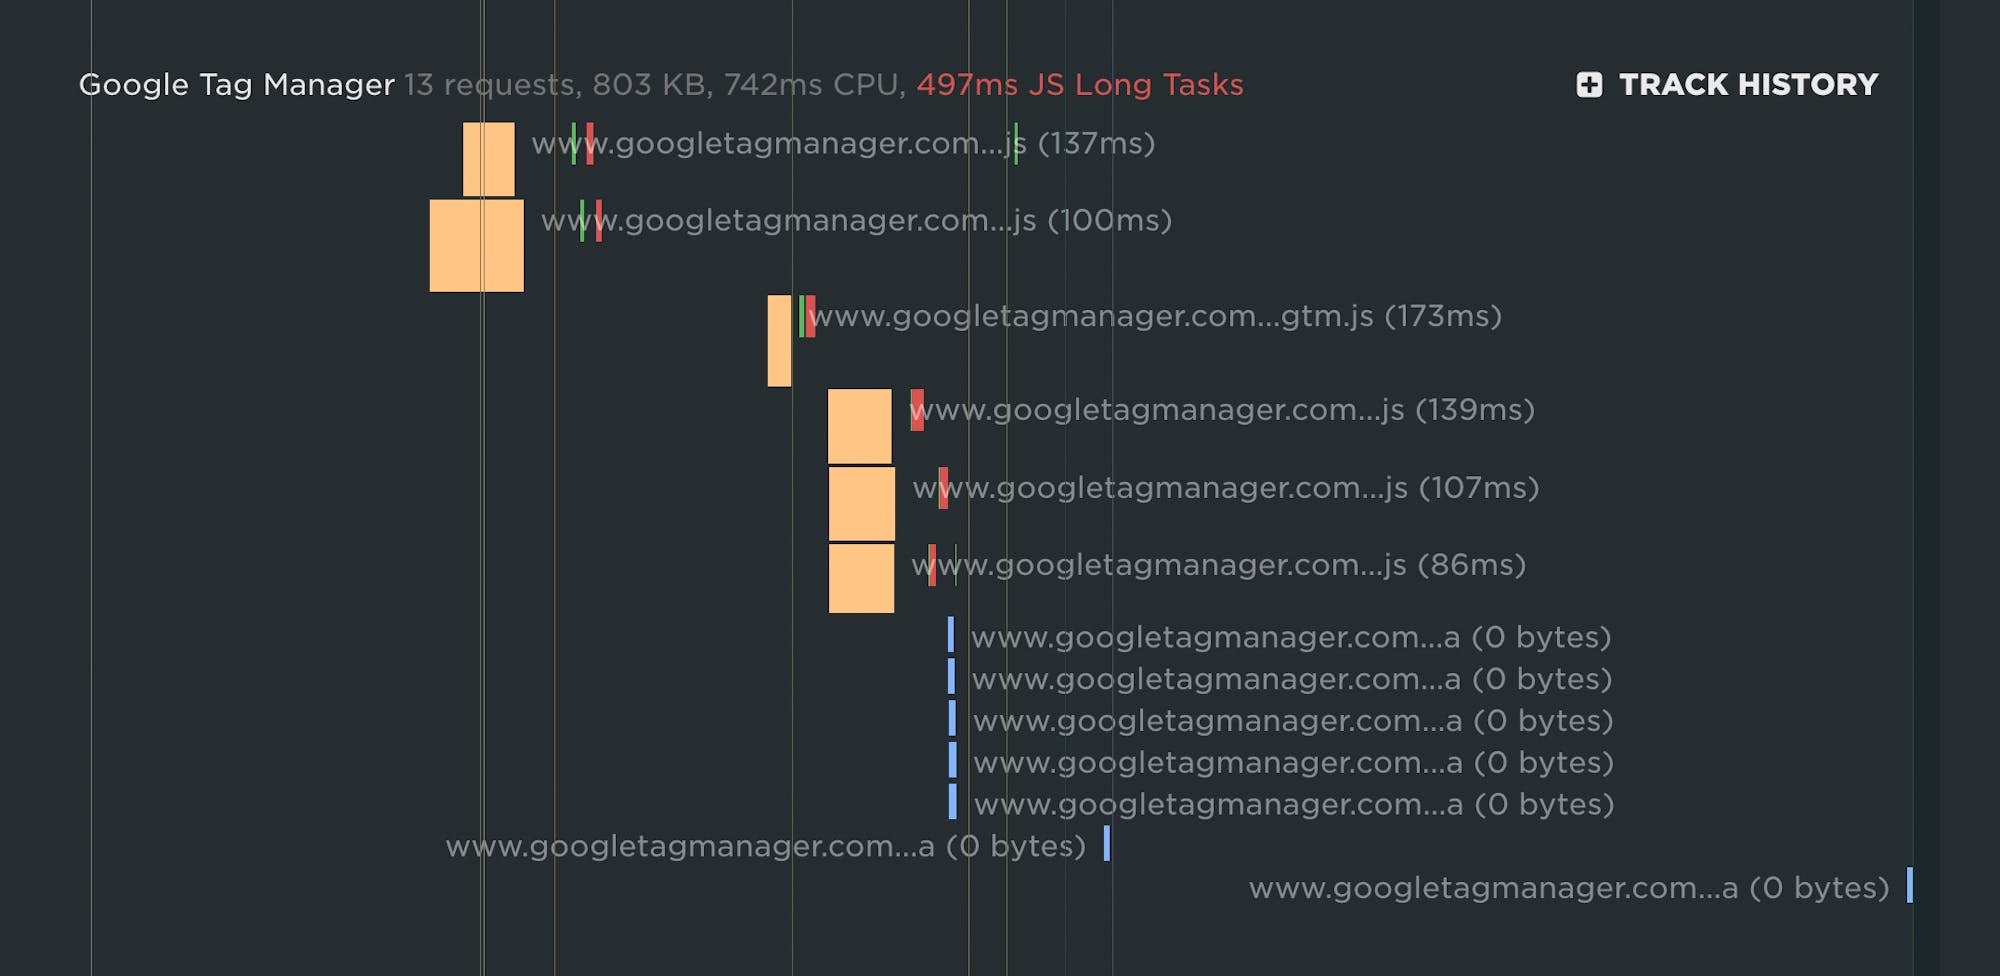
- Some third parties, such as Google Tag Manager, incur a significant performance penalty. As you can see below, GTM calls 13 resources and has a total Long Tasks time of 497 milliseconds. (Any task greater than 50s is a cause for concern.) Excessive Long Tasks don't just mean slower rendering times. They also mean that the page can feel unstable as users interact with it.
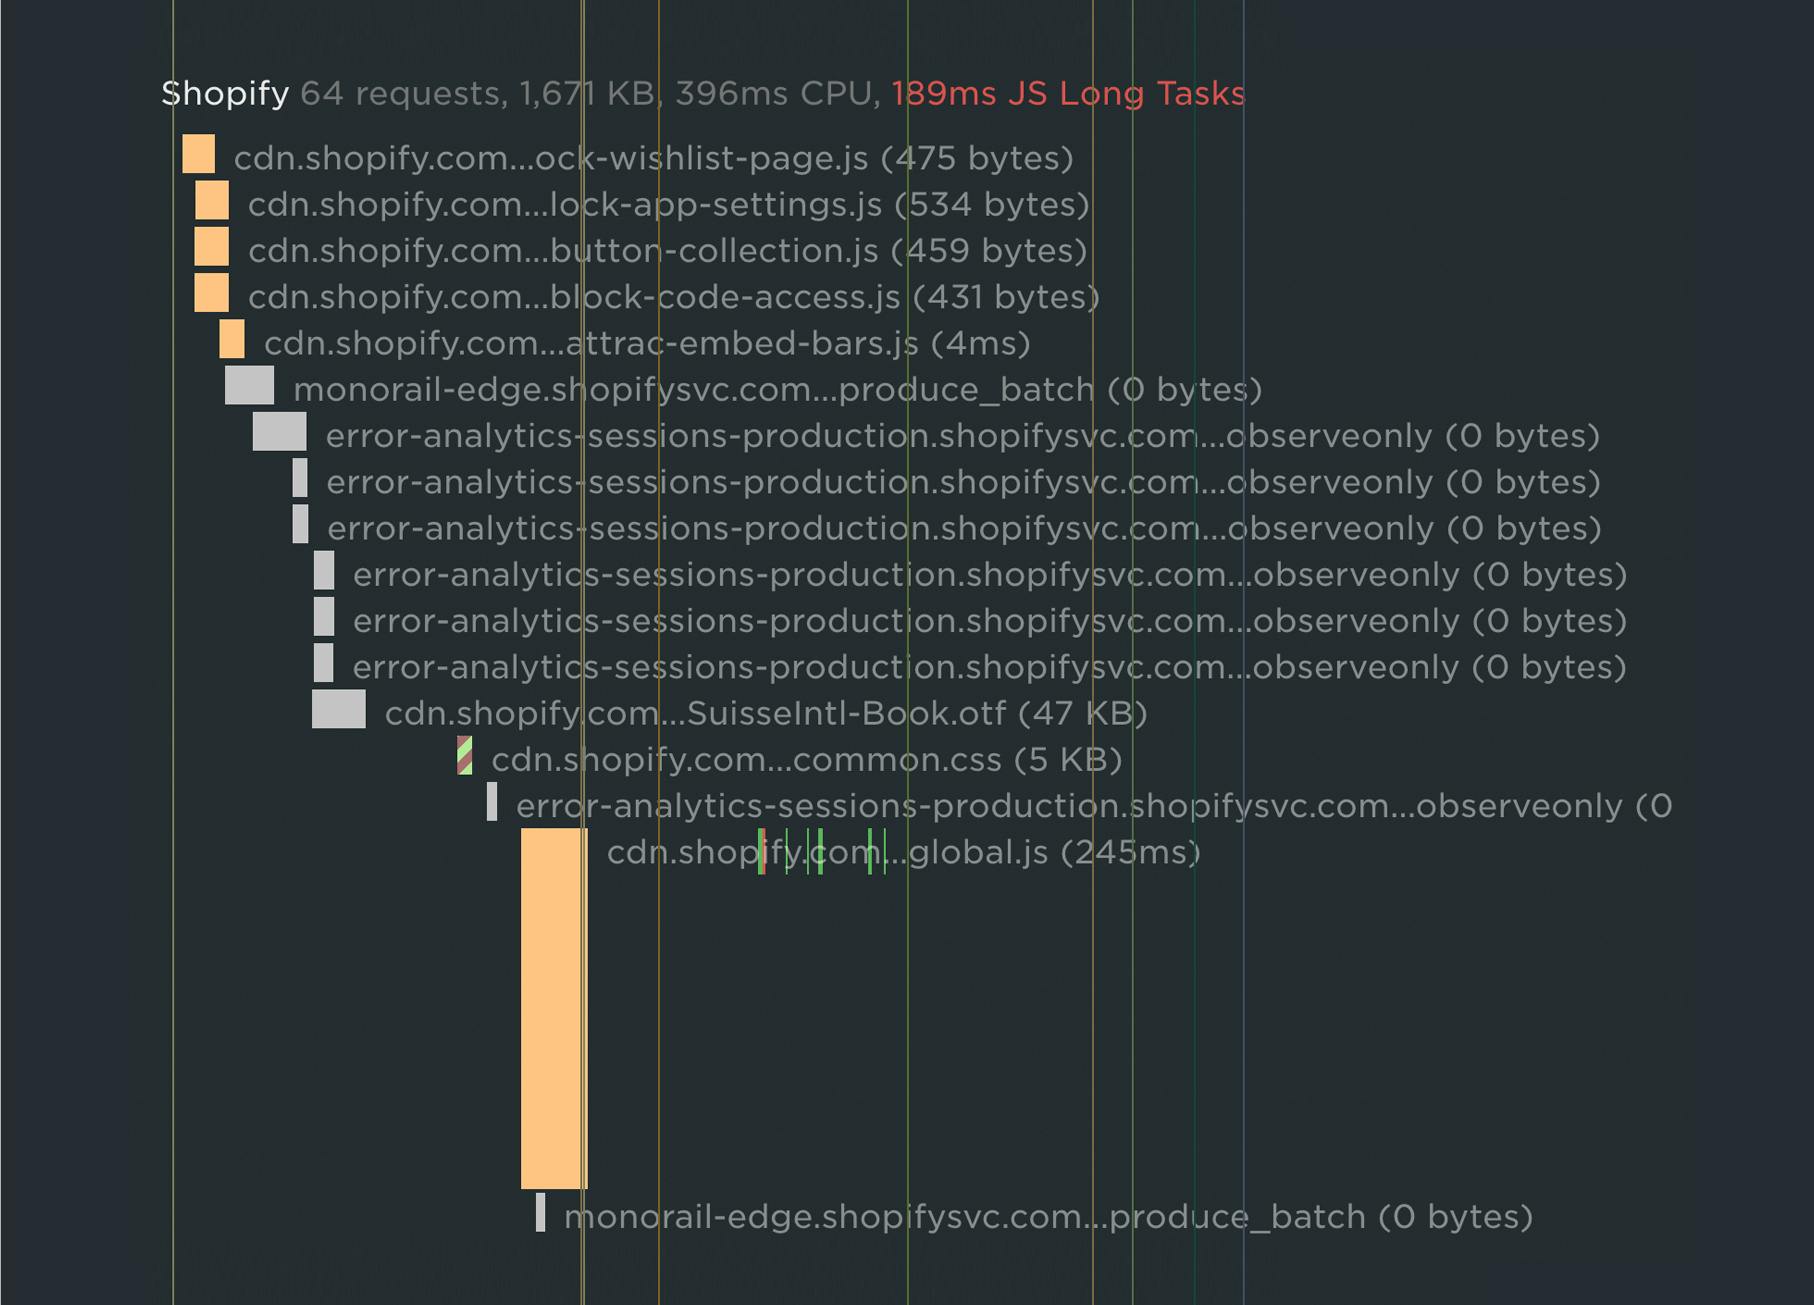
This site is a Shopify storefront
As more and more retailers of all sizes migrate to Shopify, it's not a surprise to see that this site is built on Shopify. Many of the 64 Shopify requests are from the theme (which appears to be a custom theme) that this storefront is built with.
(Not all Shopify themes are created equal. Some are definitely more performant than others. Lucky for the rest of us, Sia Karamalegos — a performance consultant who also happens to be a Shopify expert — maintains Theme Vitals, a tool that lets you test the speed of your Shopify theme. She recently posted a list of the fastest Shopify themes in 2025.)
Shopify plugins: Death by a thousand cuts
Selecting a fast Shopify theme is just the first step. You also need to ensure that all those plugins — which can be dangerously easy to install with just a click or two — aren't slowing down your pages.
On this landing page, there were a number of plugins that delayed rendering:
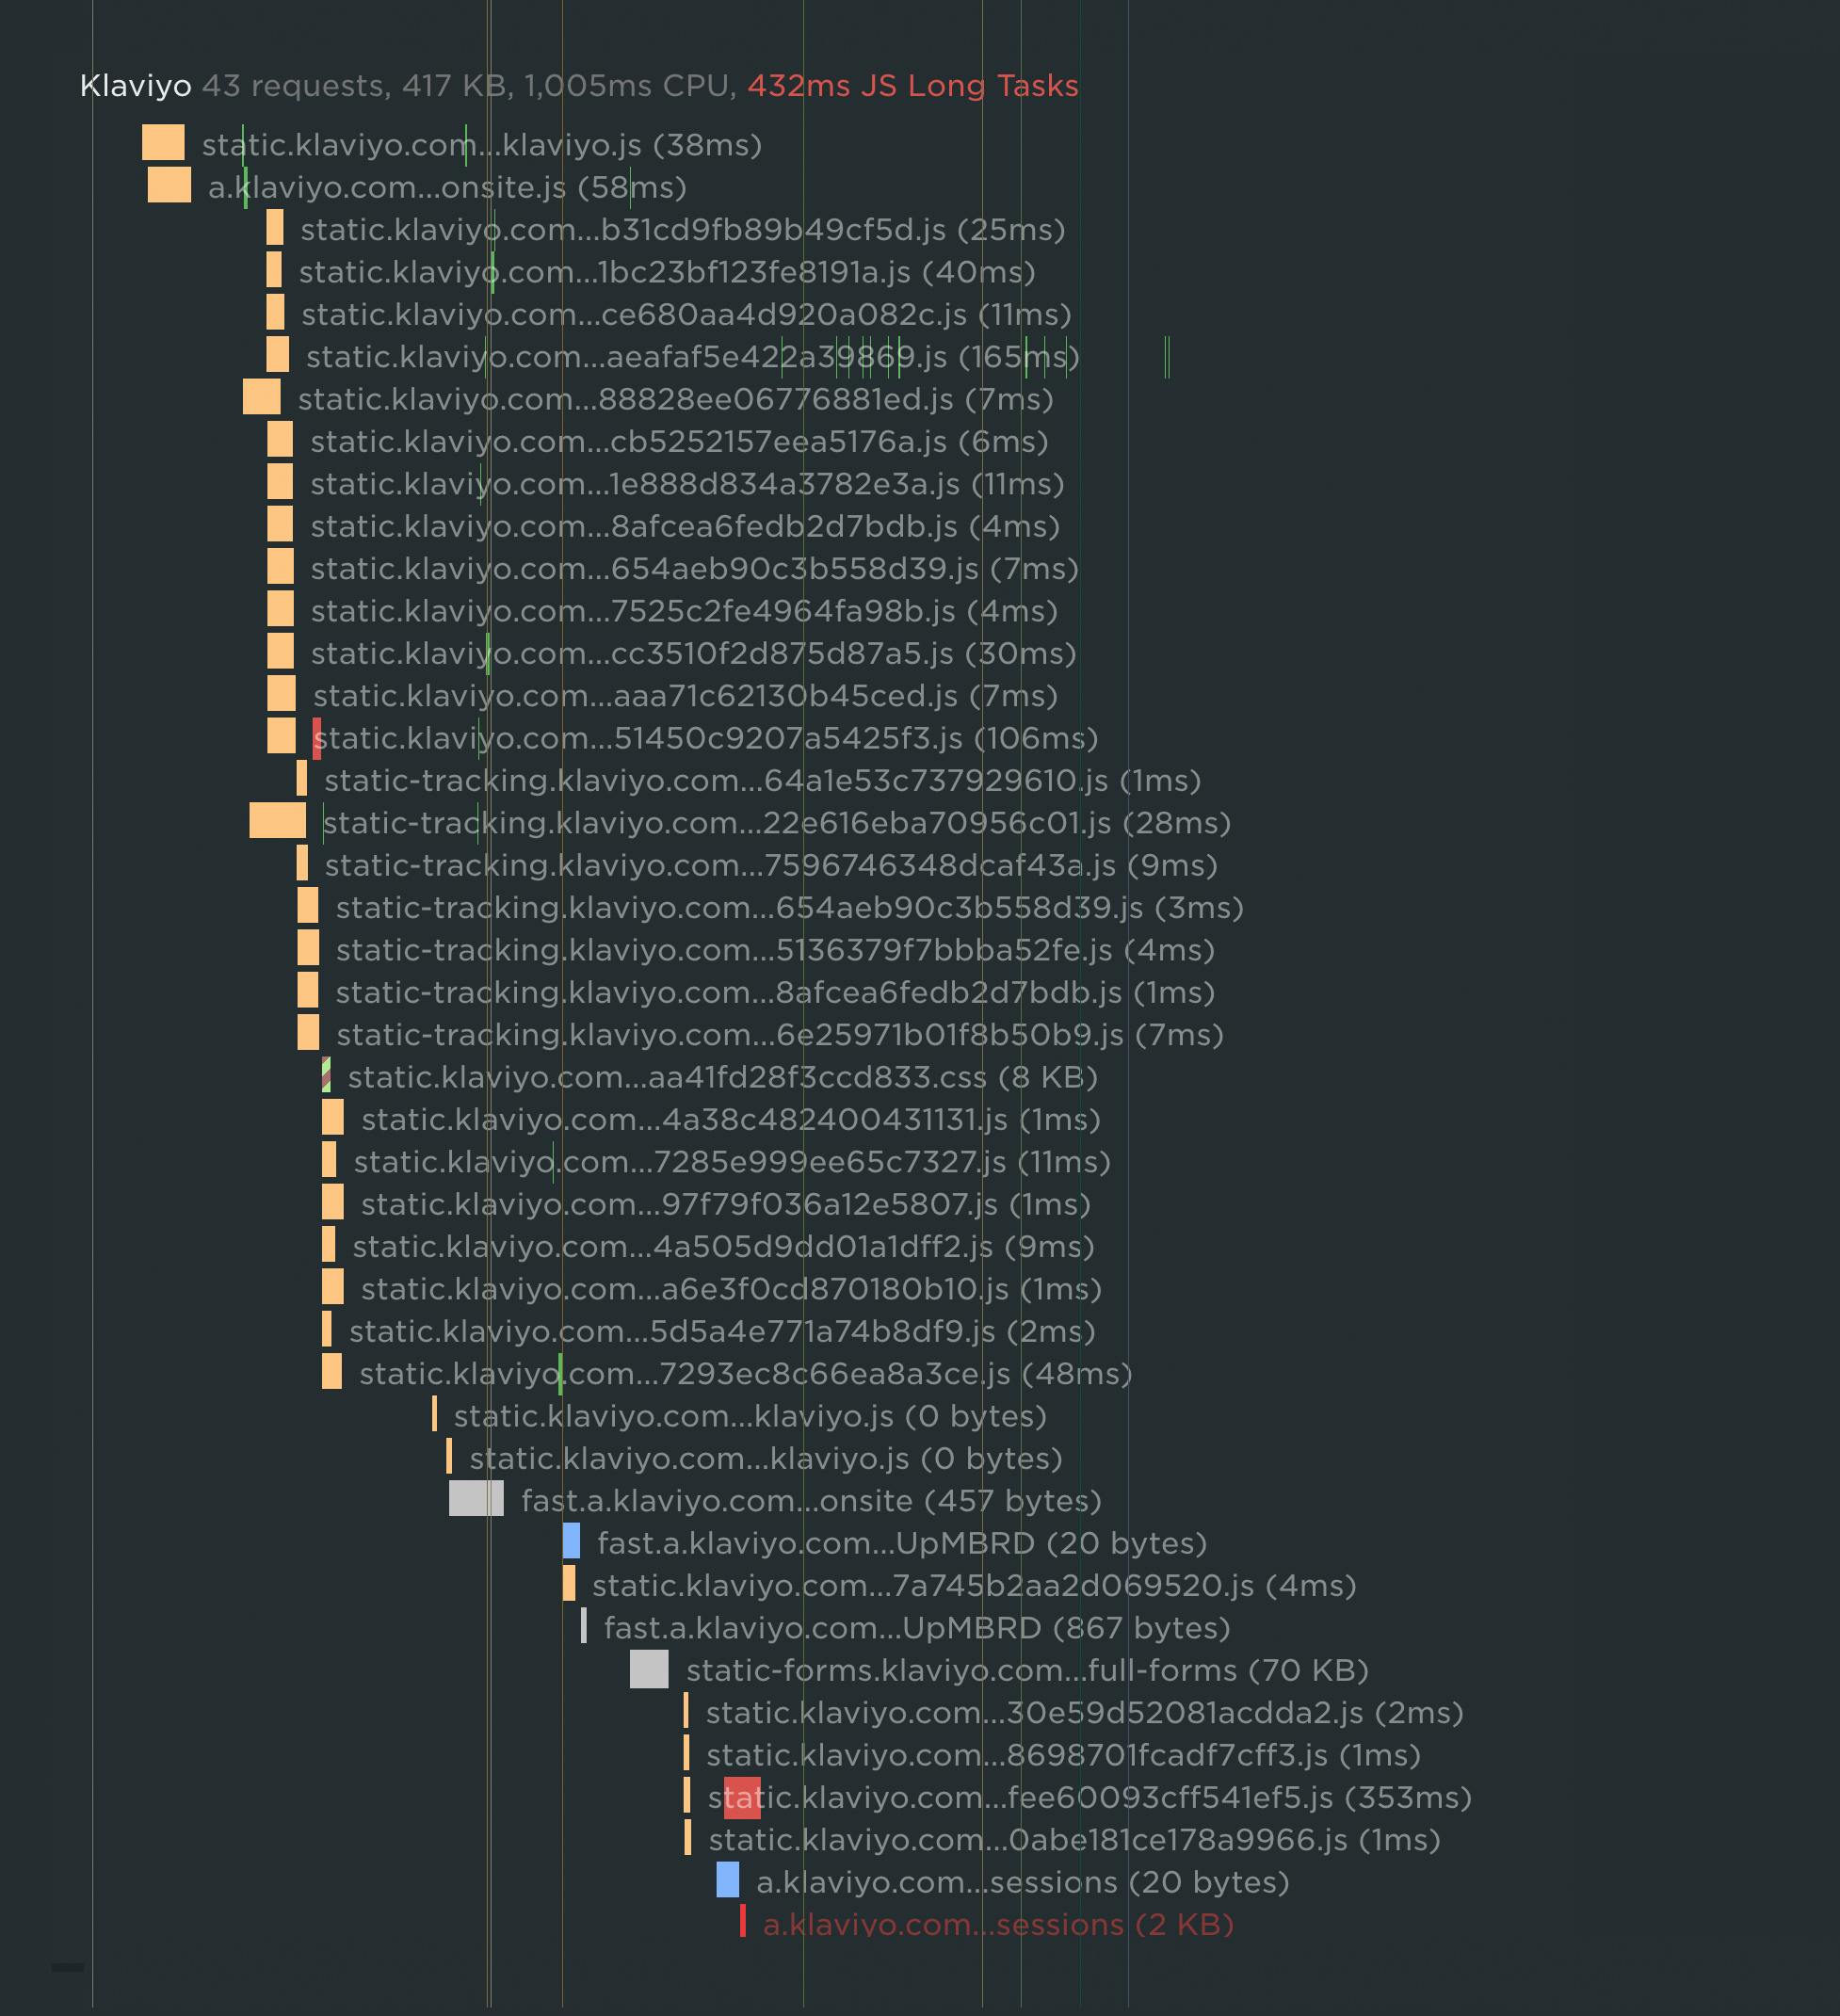
- Klaviyo — 43 requests, and a total Long Tasks time of 432ms (see below)
- Swish — 20 requests
- Intelligems — 12 requests
- Gladly — 9 requests
- Friendbuy — 2 requests
The irony is that many of these plugins are intended to increase conversions. To be clear, the issue isn't necessarily with the plugins themselves: it's with their implementation. If a service isn't needed early in the page's life cycle, it shouldn't be part of the critical rendering path.
Sometimes when we look at a waterfall chart, it's easy to see the one thing that's slowing down a page. More often than not, though, we see scenarios like this, where's there's no one big problem — it's more like death by a thousand cuts.
As more and more sites are built using platforms or frameworks that make it easy for performance issues to creep in, this problem is only going to get worse.
(If you have a Shopify storefront and you want to monitor the speed and usability of your pages, you can easily enable SpeedCurve RUM in your Shopify store. Not only can you track page speed, you can also see how it correlates to business metrics like conversion rate!)
Who should be responsible for your landing pages?
At the top of this post, I mentioned performance culture, and why your company needs to have one. Simply put, everyone who touches a page should care about how that page performs in the wild.

If you're an executive — Here's what the most successful websites have in common: they all have a performance and usability champion in a corner office. While performance is a shared responsibility, YOU are responsible for building a culture of web performance throughout your company. (I did a talk about this at performance.now() a few years back. If you're interested, you can watch it here.)
If you're a marketer — When you're tasked with building campaign pages (or any pages) on platforms like Shopify, Wix, and Squarespace, it's important to know how easy it is to accidentally introduce issues that slow down your pages. You need to performance test your pages using tools like SpeedCurve or WebPageTest. Not sure how to use these tools? Get your dev or engineering team to show you. (If you're a SpeedCurve user, or even if you're just curious, send us a note at support@speedcurve.com and we'll show you how to test your pages and find your page speed bottlenecks!)
If you're a design agency — Keep in mind that page speed is a critical usability factor. When you build landing pages for clients, you need to test those pages for performance. (We have a number of agencies that use our tools to test their clients' sites. Contact us at support@speedcurve.com to find out how you can do the same!)
If you're a developer or engineer — If campaign pages are built outside your purview, you can still be a force for good. Teach your marketing team or agency how to use synthetic testing tools to test new pages after they go live. Remind them to communicate with you when new pages are live so you can monitor them using your real user monitoring tools.
Make sure your landing pages stay fast
A campaign landing page should be the most scrutinised page of your site during the holidays.
- Make sure everyone who touches the page understands the relationship between page speed, user experience, and conversion rate.
- Create a testing workflow before new pages are put into production.
- Monitor continuously to prevent third-party surprises. (It happens!)
Next?
Is there a page you'd like us to audit? Let us know at support@speedcurve.com!
If you'd like to analyze your own pages (including Core Web Vitals analysis) – or compare your site to your competitors – you can do that in SpeedCurve. If you're not using us yet, start your free trial.