SpeedCurve is now part of the Embrace family! There are no changes to how you use our products. Our founder Mark shares what this means...
Business Success
Core Web Vitals
- Getting Started With CWV
- Largest Contentful Paint (LCP)
- Interaction to Next Paint (INP)
- Cumulative Layout Shift (CLS)
- How to Use Core Web Vitals Subparts
Optimization Techniques
- Web Performance Budgets
- Diagnose Time to First Byte
- Optimizing Images
- Optimizing JavaScript
- Third-Party Web Performance
- Critical CSS for Faster Rendering
- Optimizing Single Page Apps
- Caching for Faster Load Times
Metrics & Charts
How to Use Core Web Vitals Subparts to Find and Fix Performance Problems
Have you ever stared at an LCP number and thought, "Great, now what?" You know your Largest Contentful Paint time is 3.2 seconds. You know that's not good. But a single number doesn't tell you why it's slow, or what to do about it. That's where subparts come in. When you know how to read them, they turn a vague "this page is slow" into a specific, fixable problem.
The general playbook, whether you're chasing LCP or INP:
- Start at the aggregate to find a page worth investigating
- Break it down by subpart to find the phase
- Segment further (by element, viewport, or interaction target) to find the specific cause
- Reproduce it in DevTools or synthetic testing to confirm and iterate on a fix
Below is a practical walkthrough of how to debug LCP and INP using their subparts, plus what to do about CLS (which, annoyingly, doesn't have subparts at all).
First, what are subparts?
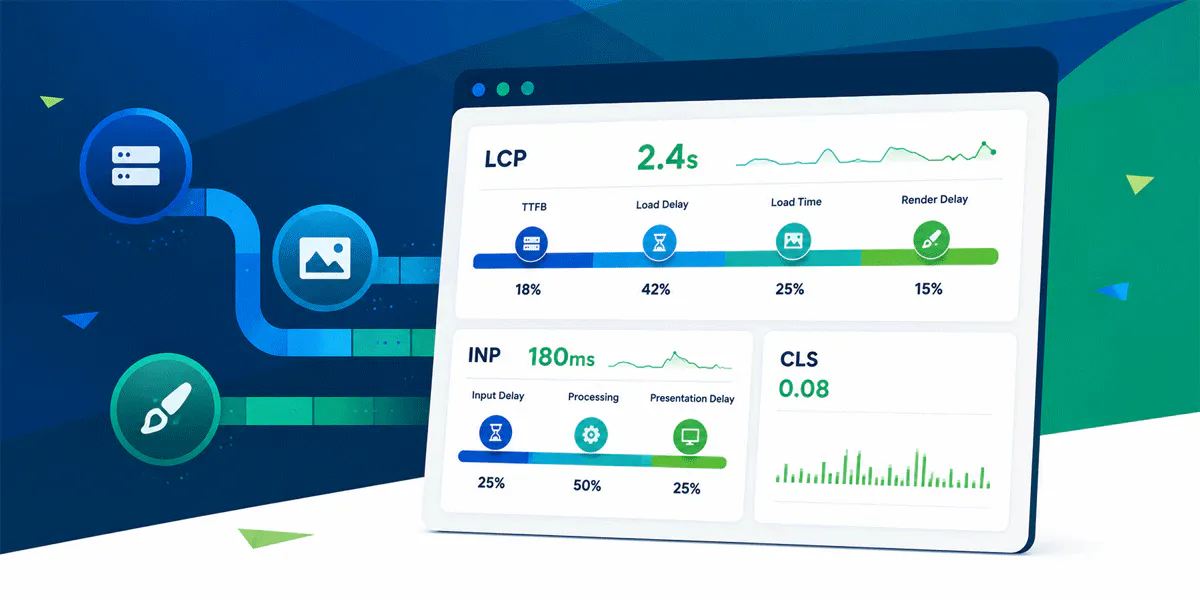
Subparts are the phases that make up a Core Web Vitals metric. Instead of one number, you get a breakdown of where the time actually went.
LCP has four subparts
They map to the lifecycle of how your largest content element gets onto the screen:
- Time to First Byte (TTFB) – how long it takes to get the initial HTML response back from the server
- Resource load delay – the time between getting that HTML and the browser actually starting to fetch the LCP resource (usually an image)
- Resource load duration – how long the image itself takes to download
- Render delay – the time between the resource finishing its download and it actually appearing on screen
One important caveat: subparts only apply to images and videos. If your LCP element is text, you'll see dashes instead of a breakdown, because we don't yet have a good way to measure how long something like a web font took to affect that text.
INP has three subparts
They map to what happens when a visitor interacts with your page:
- Input delay – the browser is busy doing something else, so your event handler can't run yet
- Processing duration – your event handler is actually executing
- Presentation delay – the work is done, but the browser still needs to paint the next frame
CLS has no subparts
It's not a time-based metric, so there's nothing to break into phases. We'll cover how to approach it separately, further down.
Debugging LCP: A step-by-step approach
Here's the process, roughly in the order you'd actually do it:
1. Look at the aggregate first
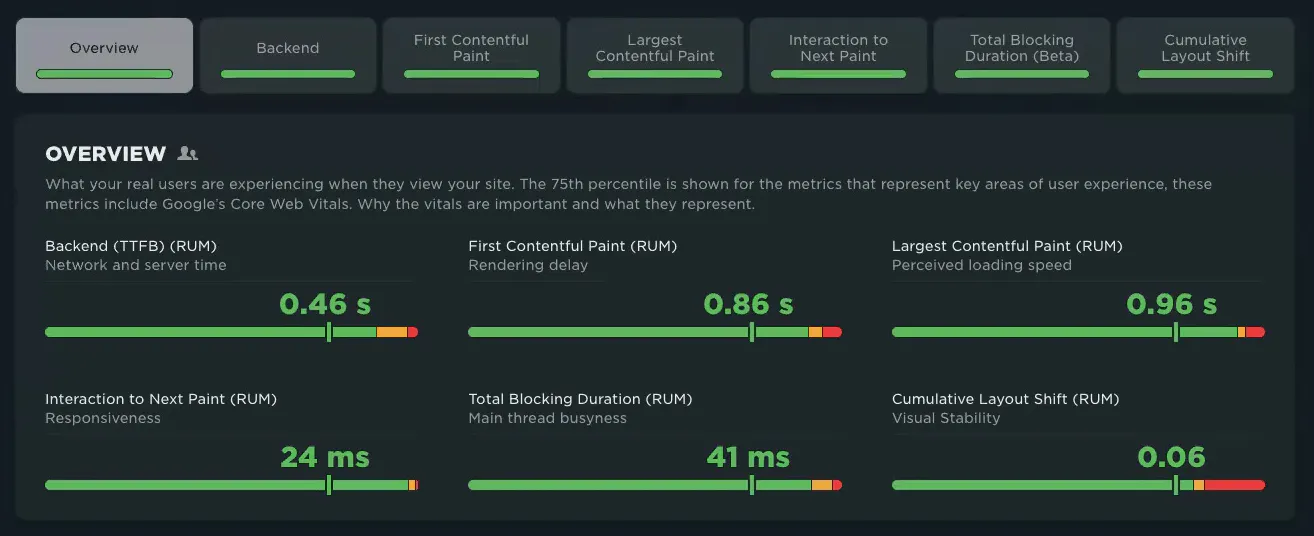
Start with your Web Vitals dashboard, filtered down to the page or section you care about.
Don't just glance at the topline LCP number – that 75th percentile figure can be deceptively fast-looking or slow-looking depending on what's hiding underneath it. A marketing site that feels fast when you click around can still have a 75th percentile LCP of nearly 3 seconds. Numbers lie by omission; distributions don't.
2. Break it down by subpart
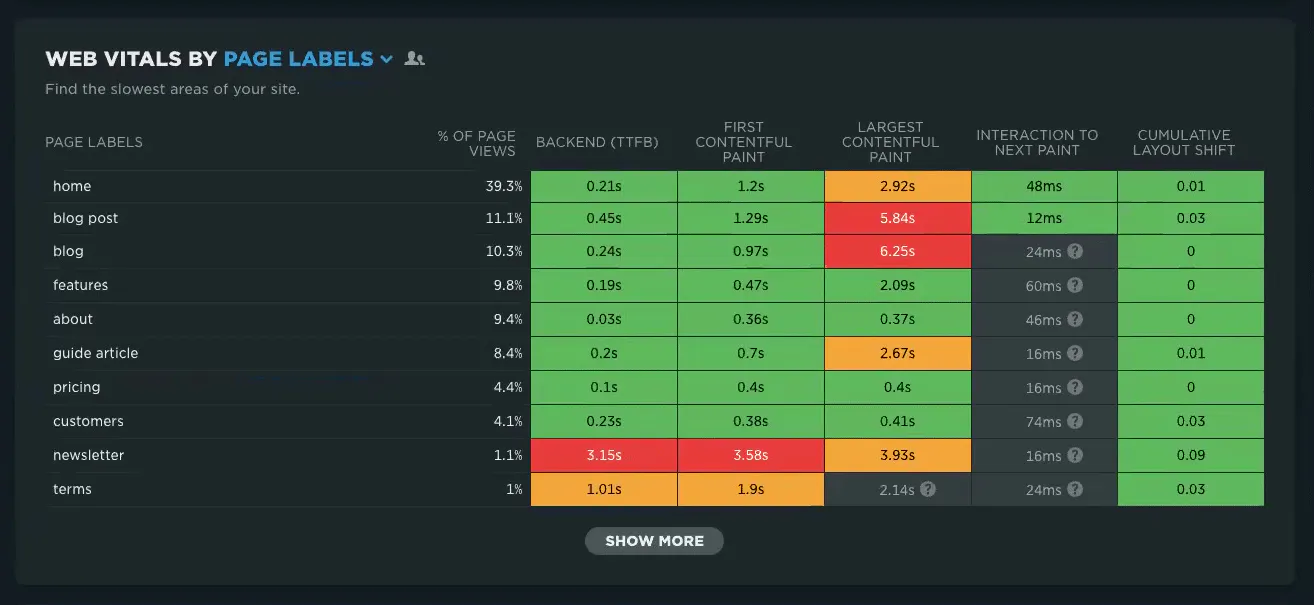
Once you've found a page worth investigating, drill into the LCP subpart breakdown. This tells you which phase is eating the time.
A common pattern: resource load delay is high, but download time and render time are both fast. That means the browser took a long time to even realize it needed the image – it downloaded quickly once asked.

3. Segment by LCP element
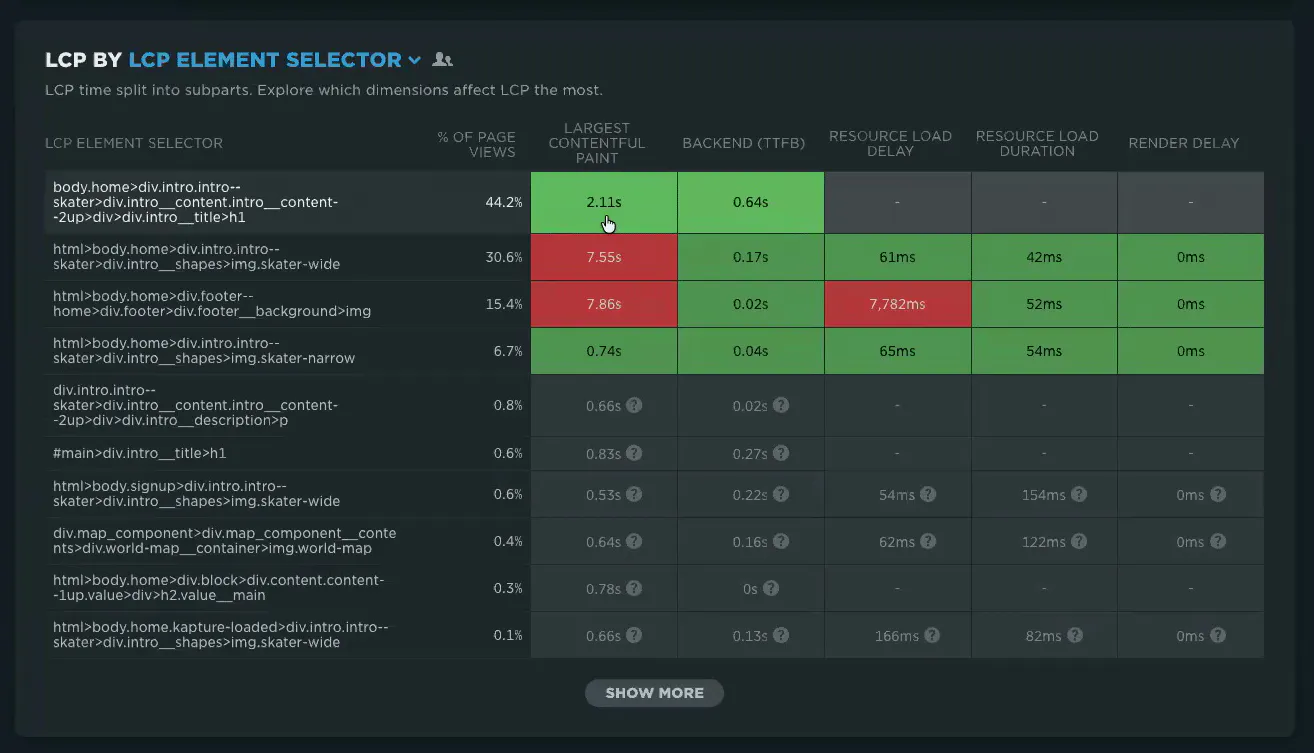
This is the step people skip, and it's often the most revealing one.
Look at what's actually being detected as your LCP element. You might find that 44% of the time it's a heading (no subparts, since it's text), and 15% of the time it's an unexpected image – like something in the footer. If a chunk of your sessions are landing on a completely different LCP element than you assumed, your aggregates are being pulled around by two (or more) different problems at once.
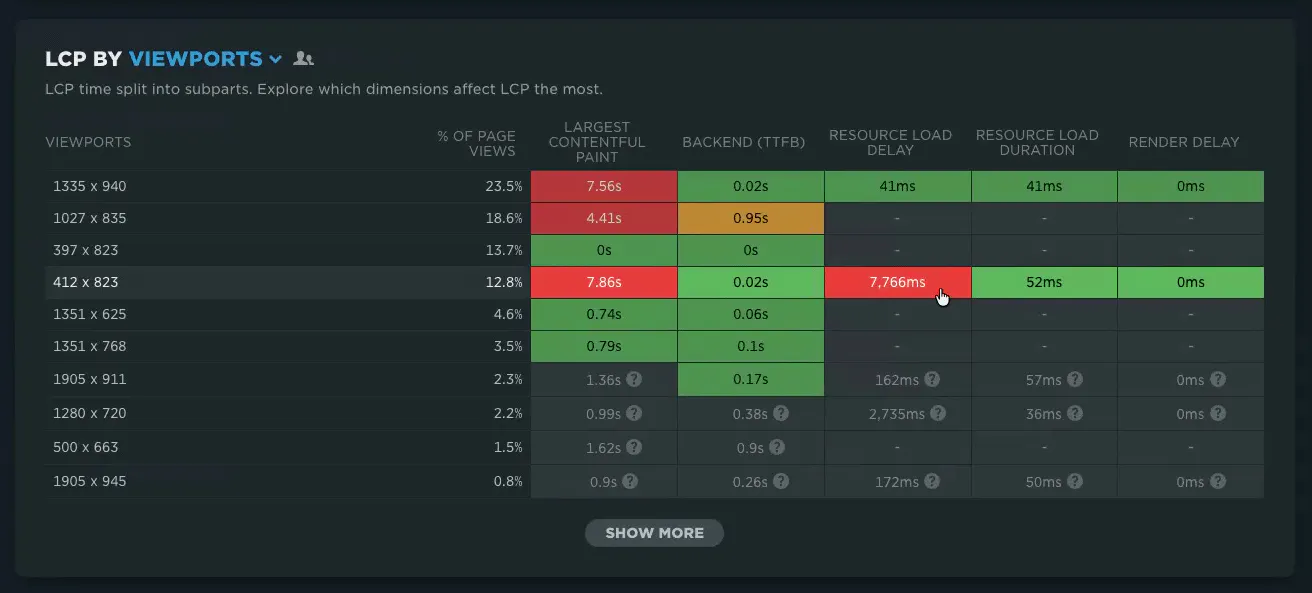
4. Segment by viewport
The same element can behave very differently on desktop vs. mobile. A footer image that's rarely LCP on desktop might be the dominant LCP culprit on mobile, simply because of how the layout stacks.
5. Reproduce it in DevTools
Once you know the element and the viewport, open DevTools, match the viewport size, throttle CPU and network to approximate what your real users are experiencing, and search for the specific element to confirm it's the one being flagged.
A couple of things to watch for:
- DevTools network throttling doesn't behave exactly like a real network. It throttles per-request rather than at the packet level, so it won't reproduce the congestion you get when several resources compete for the same real-world connection.
- If the issue isn't happening during initial page load – for example, a layout shift seven seconds in that creates a new LCP candidate – a normal "reload and profile" won't catch it. Start from about:blank, begin profiling, then navigate, and let the profile run longer than you think you need to.
Common fixes, by subpart
High TTFB? Get your HTML back faster. Good is under 800ms by CrUX standards, but honestly, if you're slower than 300ms, there's room to improve.
High resource load delay? This usually means the browser didn't know about your LCP resource soon enough:
- Put the image directly in the HTML — don't inject it with JavaScript (carousels built entirely in JS are a classic offender)
- Use
fetchpriority="high"on the image. One underrated benefit of usingfetchpriorityinstead of a separate<link rel="preload">: it keeps the priority hint in one place (the image tag itself) instead of two places that can drift out of sync — we've seen sites end up preloading an image that isn't even used on the page anymore. - Avoid lazy-loading your LCP image — this shows up far more often than you'd expect
- Watch out for CSS techniques that quietly download multiple images at once, competing with each other for bandwidth. Use
<picture>andsrcsetinstead.
High resource load duration? Pick the right format, compress it, and make sure it's not fighting other resources for bandwidth.
High render delay? This one's trickier, because it's often caused by the browser being busy with something else. Ironically, preloading your LCP image can shift time here rather than eliminate it — the image arrives sooner, but there's now a wait between "downloaded" and "displayed." That's not necessarily a red flag; it's usually still a net win. Just know where the trade-off shows up.
Debugging INP: Same idea, different phases
INP breaks down the same way conceptually – find the phase, then find the cause.
1. Check the overall trend and look for spikes
Same starting point as LCP: look at the distribution, not just the aggregate, and look for spikes over time.
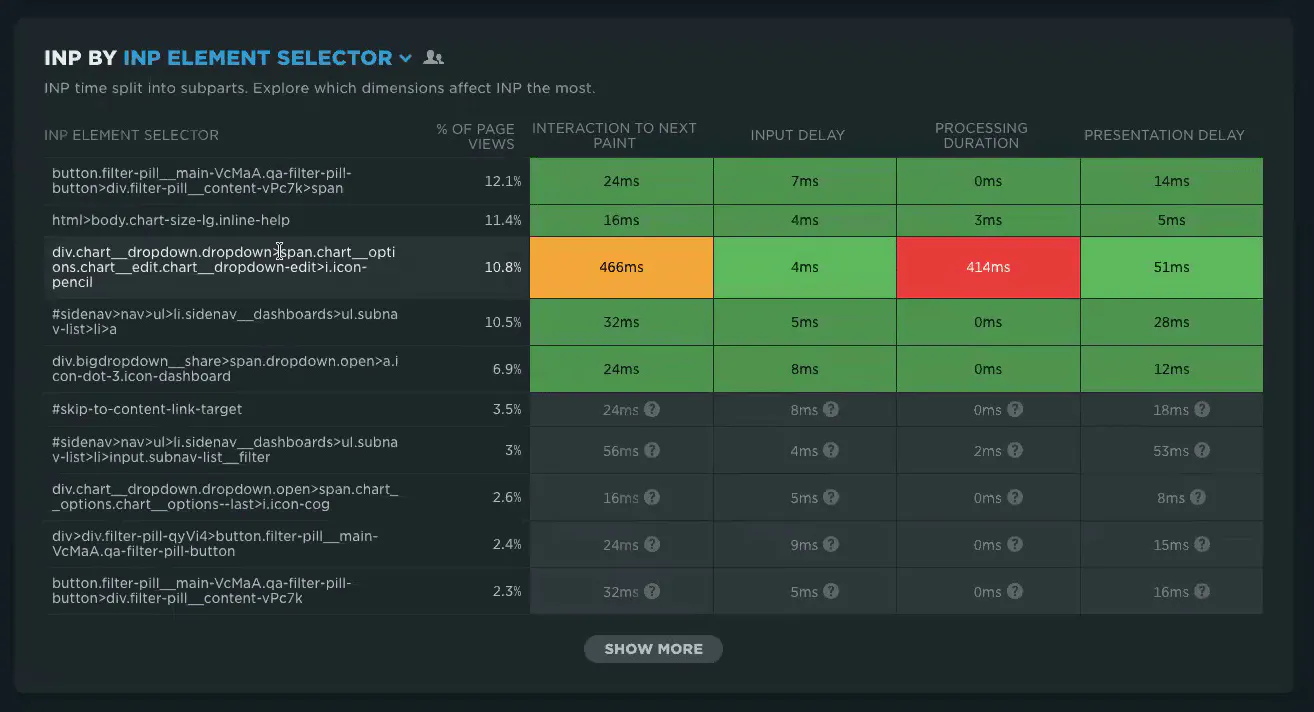
2. Segment by interaction element
Drill into which specific elements people are clicking on when INP is bad. This tells you where to focus rather than guessing.
3. Use Long Animation Frames (LoAF) to find the responsible scripts
This is the good part. LoAF data lets you see which scripts are contributing to slow interactions – both overall, and broken down by which phase they're affecting.
- High input delay? Look for scripts that are busy on the main thread when the interaction happens. Sometimes it's your own code (a charts library still rendering); sometimes it's a third-party script.
- High processing duration or presentation delay? These are harder to catch through aggregate script data alone. Find the actual interaction and profile it directly in DevTools.
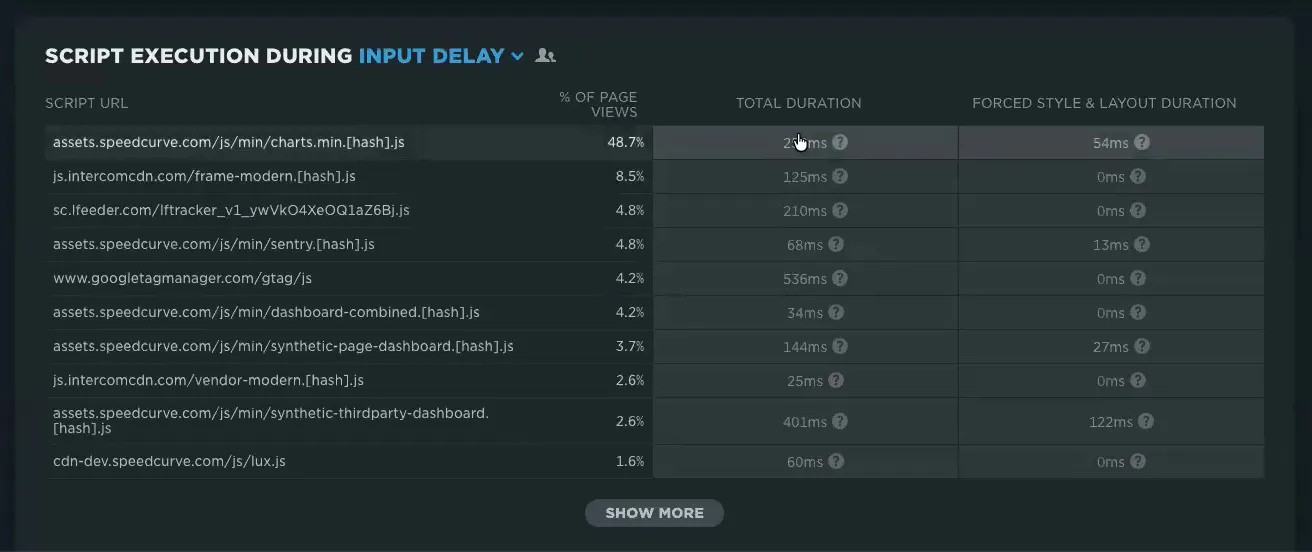
One note on reproducing input delay: it's hard to emulate in DevTools, because it depends entirely on when your visitor clicked and what else happened to be running on the page at that exact moment. That's a case where the real-user data is doing work synthetic testing can't easily replicate.
Common fixes, by subpart
High input delay? Can the competing script be broken up, run sooner, or deferred to run later? This tends to show up on pages that render content quickly and encourage people to interact immediately – while some background script is still finishing up.
High processing duration? Do less work in the handler, or break it into smaller chunks.
High presentation delay? Reduce style and layout work. Lean on CSS for styling rather than triggering reflows, avoid resizing elements, and check whether handlers like Intersection Observer are doing unnecessary work during the render phase.
What about CLS?
CLS doesn't have subparts, but layout shifts generally happen for one of three reasons:
- An element changes size – a common cause is a web font loading and changing text dimensions
- An element is added to the page, pushing other content
- An element is removed from the page, letting other content collapse into its space
Added and removed elements are the hardest to detect after the fact, since once something's removed, you can no longer query its original size. A few ways to actually dig in:
- Use the before/after rectangle data some tools capture for each layout shift to see whether an element moved or changed size
- If your tool supports it, hover over (or scrub through) the film strip or video around the shift to see it happen visually
- In Chrome DevTools' performance panel, hover over the CLS track to see an animated before/after
- Watch for late layout shifts specifically — a shift that happens well after initial load (say, seven seconds in) can create a brand new LCP candidate, which is a sneaky way for a CLS problem to disguise itself as an LCP problem
Dealing with low sample sizes
If you're drilling into a specific page, element, or segment and the data looks grayed out or noisy, you're running into a sample size problem. A few ways to work around it:
- Widen your time window. More data helps, but the further back you go, the more likely you are to be blending in a period where something else changed (a deploy, a redesign), so there's a real trade-off.
- Compare the noisy segment to your significant data, rather than trying to make the noisy segment significant on its own. Look at whether it skews toward mobile, a particular device class, a specific screen size, or specific pages.
- Go look at individual sessions. Aggregate views (distributions, histograms) are great for spotting trends, but sometimes the fastest way to understand a low-sample cohort is to open up a handful of real sessions and just look.
It's also worth checking how you're grouping your data in the first place. Two opposite problems show up a lot:
- Too granular: if every product page gets its own URL and none of them get grouped, you'll never have enough samples on any single page, even though they all share the same template and should behave similarly. The fix is grouping by page type or template (often called "page labels" or "page groups"), not by individual URL.
- Too broad: the flip side is a bucket like "homepage" that's secretly hiding multiple different experiences – for example, users who land on the homepage organically vs. users who get redirected there after checkout (which can be dramatically slower). If a single label is masking a bimodal distribution, split it further – by referrer, by whether the navigation was internal or external, or by whatever dimension is actually driving the difference.
Takeaway
A single Core Web Vitals number tells you that something's wrong. Subparts tell you where to look next. The general playbook, whether you're chasing LCP or INP:
- Start at the aggregate to find a page worth investigating
- Break it down by subpart to find the phase
- Segment further (by element, viewport, or interaction target) to find the specific cause
- Reproduce it in DevTools or synthetic testing to confirm and iterate on a fix
And if the data's too thin to draw conclusions from yet, that's useful information too. Just don't mistake "not statistically significant" for "not worth looking at."
Created by Andy Davies • Last updated 17 Aug 2026
Read Next

Everything you need to know about Core Web Vitals – from SEO and business impact to how to monitor and fix issues with each Vital.

Tim Kadlec shows how to quickly diagnose TTFB issues by looking at its supporting metrics, AKA subparts.