An Opinionated Guide to Performance Budgets
Performance budgets are one of those ideas that everyone gets behind conceptually, but then are challenged to put into practice – and for very good reason. Web pages are unbelievably complex, and there are hundreds of different metrics available to track. If you're just getting started with performance budgets – or if you've been using them for a while and want to validate your work – this post is for you.
What is a performance budget?
A performance budget is a threshold that you apply to the metrics you care about the most. You can then configure your monitoring tools to send you alerts – or even break the build, if you're testing in your staging environment – when your budgets are violated.
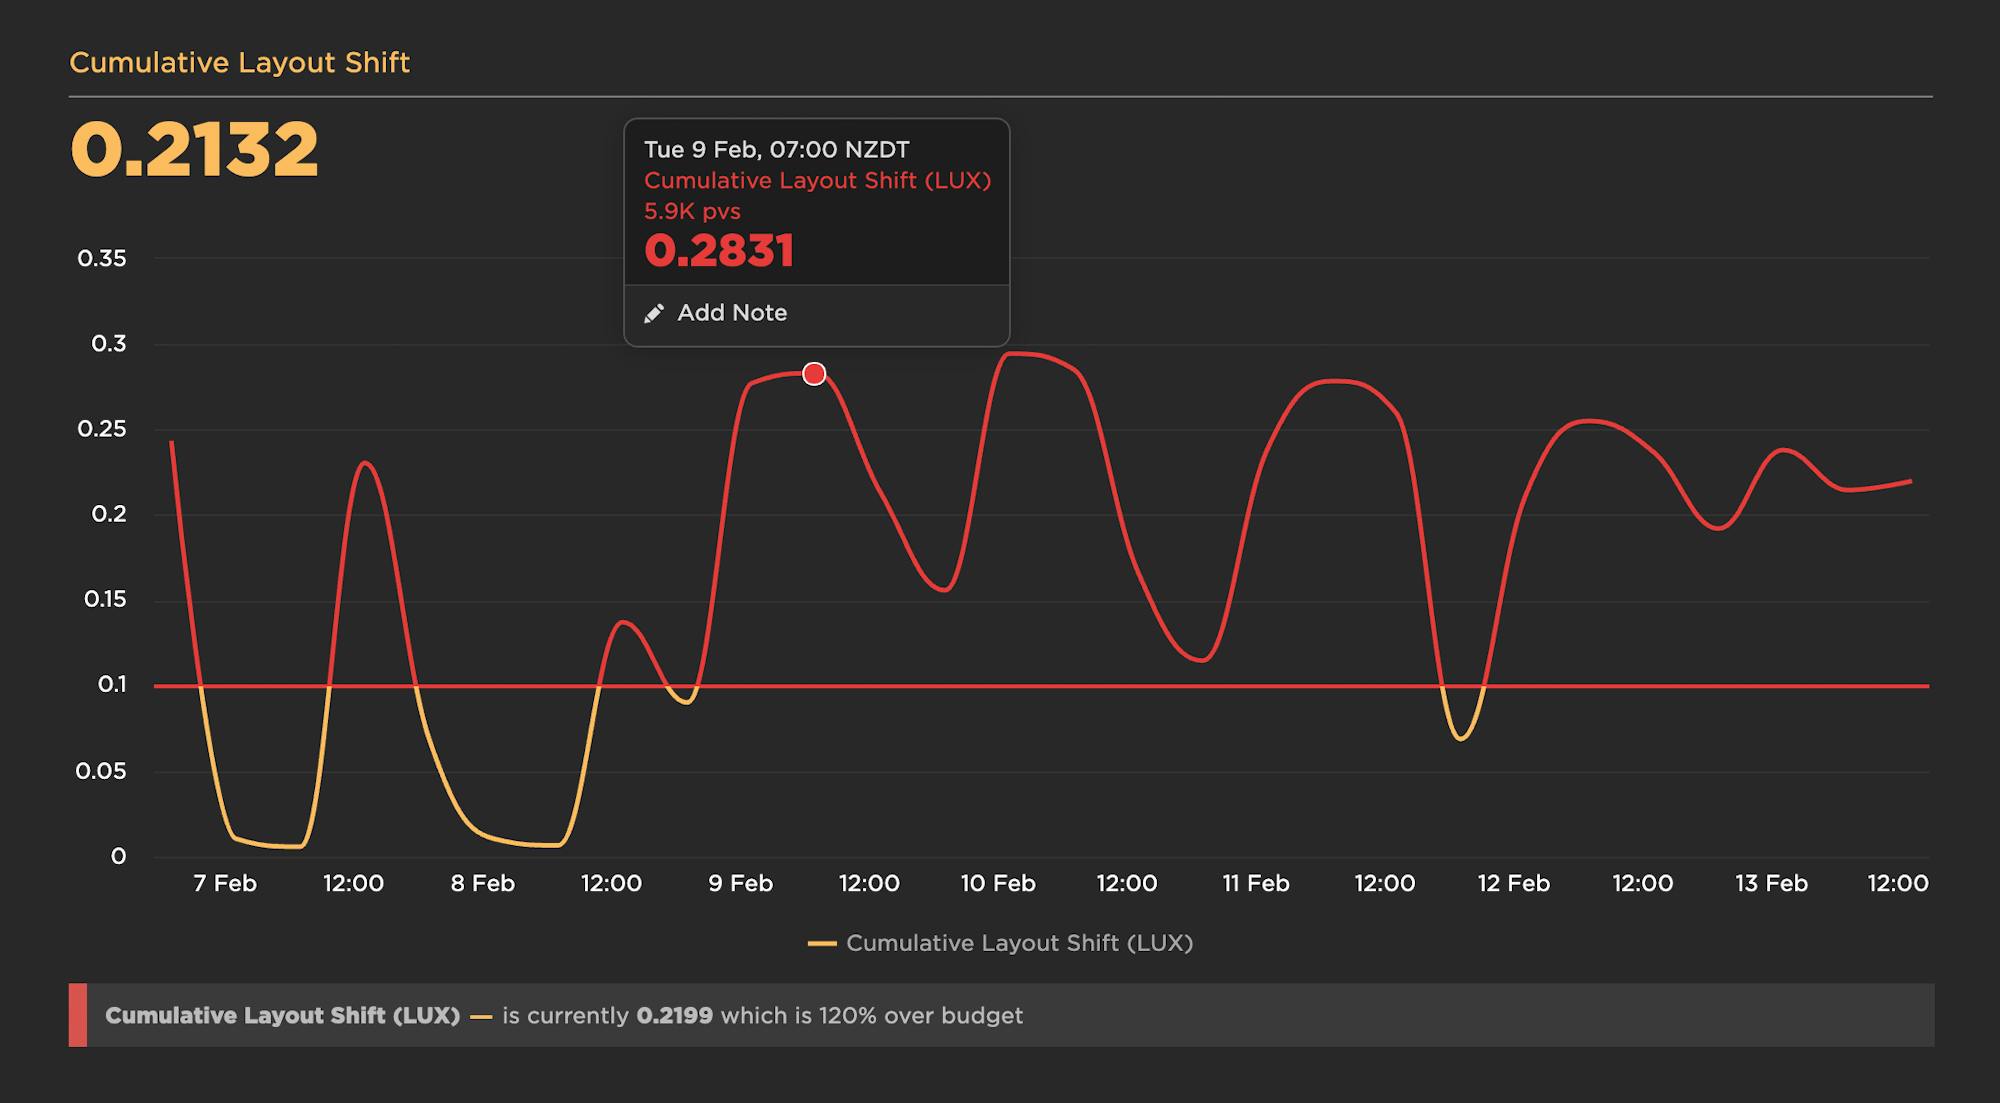
Understanding the basic premise of performance budgets is pretty easy. The tricky part comes when you try to put them into practice. This is when you run into three important questions:
- Which metrics should you focus on?
- What should your budget thresholds be?
- How do you stay on top of your budgets?
Depending on whom you ask, you could get very different answers to these questions. Here are mine.
1. Which metrics should you focus on?
There are dozens and dozens of performance metrics. Before we start listing them all, let's slow down and consider the questions that all those metrics are trying to answer for us.
Most people agree that performance affects user experience. But what does that actually mean? For me, it comes down to these questions:
- Is it loading? When do I feel like the page actually works?
- Can I use it? When do I feel like I'm seeing enough content to meaningfully interact with the page?
- How does it feel? How easy/annoying is the experience of interacting with the page?
Knowing the questions you're trying to answer will help you home in on the best metric(s) for each question.
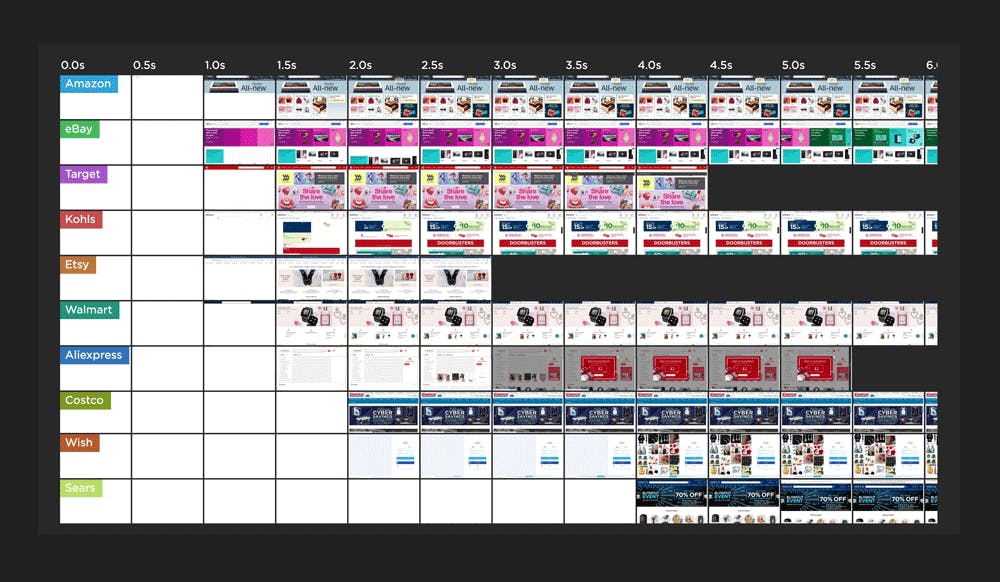
IMPORTANT: Before you overly invest in setting up performance budgets for any of these metrics, first take a good look at how these metrics align with your own data. The easiest way to do this is to look at rendering filmstrips in your synthetic test data. Throughout this post I've used examples from our public Industry Benchmarks dashboard, which I'd encourage you to check out so that you can explore these metrics on your own.
Is it loading?
Users want to feel like the page is actually working. Here are some metrics to consider. For each of these metrics, I've included what type of tool you can use to track them: synthetic and/or real user monitoring (RUM).
> Backend (Synthetic and RUM)
Backend time (aka Time to First Byte / TTFB) is the time from the start of the initial navigation until the first byte is received by the browser (after following redirects). Even if you're not responsible for backend time (e.g., you're a front-end developer), it's a good idea to track it because it can delay all your other metrics.
> Start Render (Synthetic and RUM)
Start Render time is measured as the time from the start of the initial navigation until the first non-white content is painted to the browser display. Even if that first visible paint isn't a meaningful amount of content, it's still a useful signal that the page is working, and it can help stop users from bouncing.

People don't talk much about Start Render these days, perhaps because newer, shinier metrics have emerged. But I've participated in many usability studies that have found a strong, consistent correlation between Start Render time, user engagement, and business metrics. With real user monitoring you can even generate charts, like the one below, that show you these correlations using your own data.

Can I use it?
Most users won't begin to interact with a page until a meaningful amount of content has rendered. Tracking critical content such as images and videos is a good place to start.
> Largest Contentful Paint (Synthetic and RUM)
Largest Contentful Paint (LCP) is one of Google's Core Web Vitals, so it's been getting a lot of attention lately. LCP is the time at which the largest element in the viewport is rendered. It's only tracked on certain elements, e.g., IMG and VIDEO (learn more here).

LCP is only available in Chrome, so if you have a significant number of users that come in via other browsers, you should consider tracking Last Painted Hero, below...
> Last Painted Hero (Synthetic)
Last Painted Hero (LPH) is a synthetic metric that's measurable in any browser. (Fun fact: Largest Contentful Paint was partially inspired by Last Painted Hero.) LPH shows you when the last piece of critical content is painted in the browser. It's a handy metric for knowing when all your important content has rendered.
How does it feel?
You don't just want people to visit your site – you want them to enjoy visiting your site. That means having links and buttons that respond seamlessly when clicked. It means your content – including headlines, images, and ads – flows in smoothly and stays put.
> Cumulative Layout Shift (Synthetic and RUM)
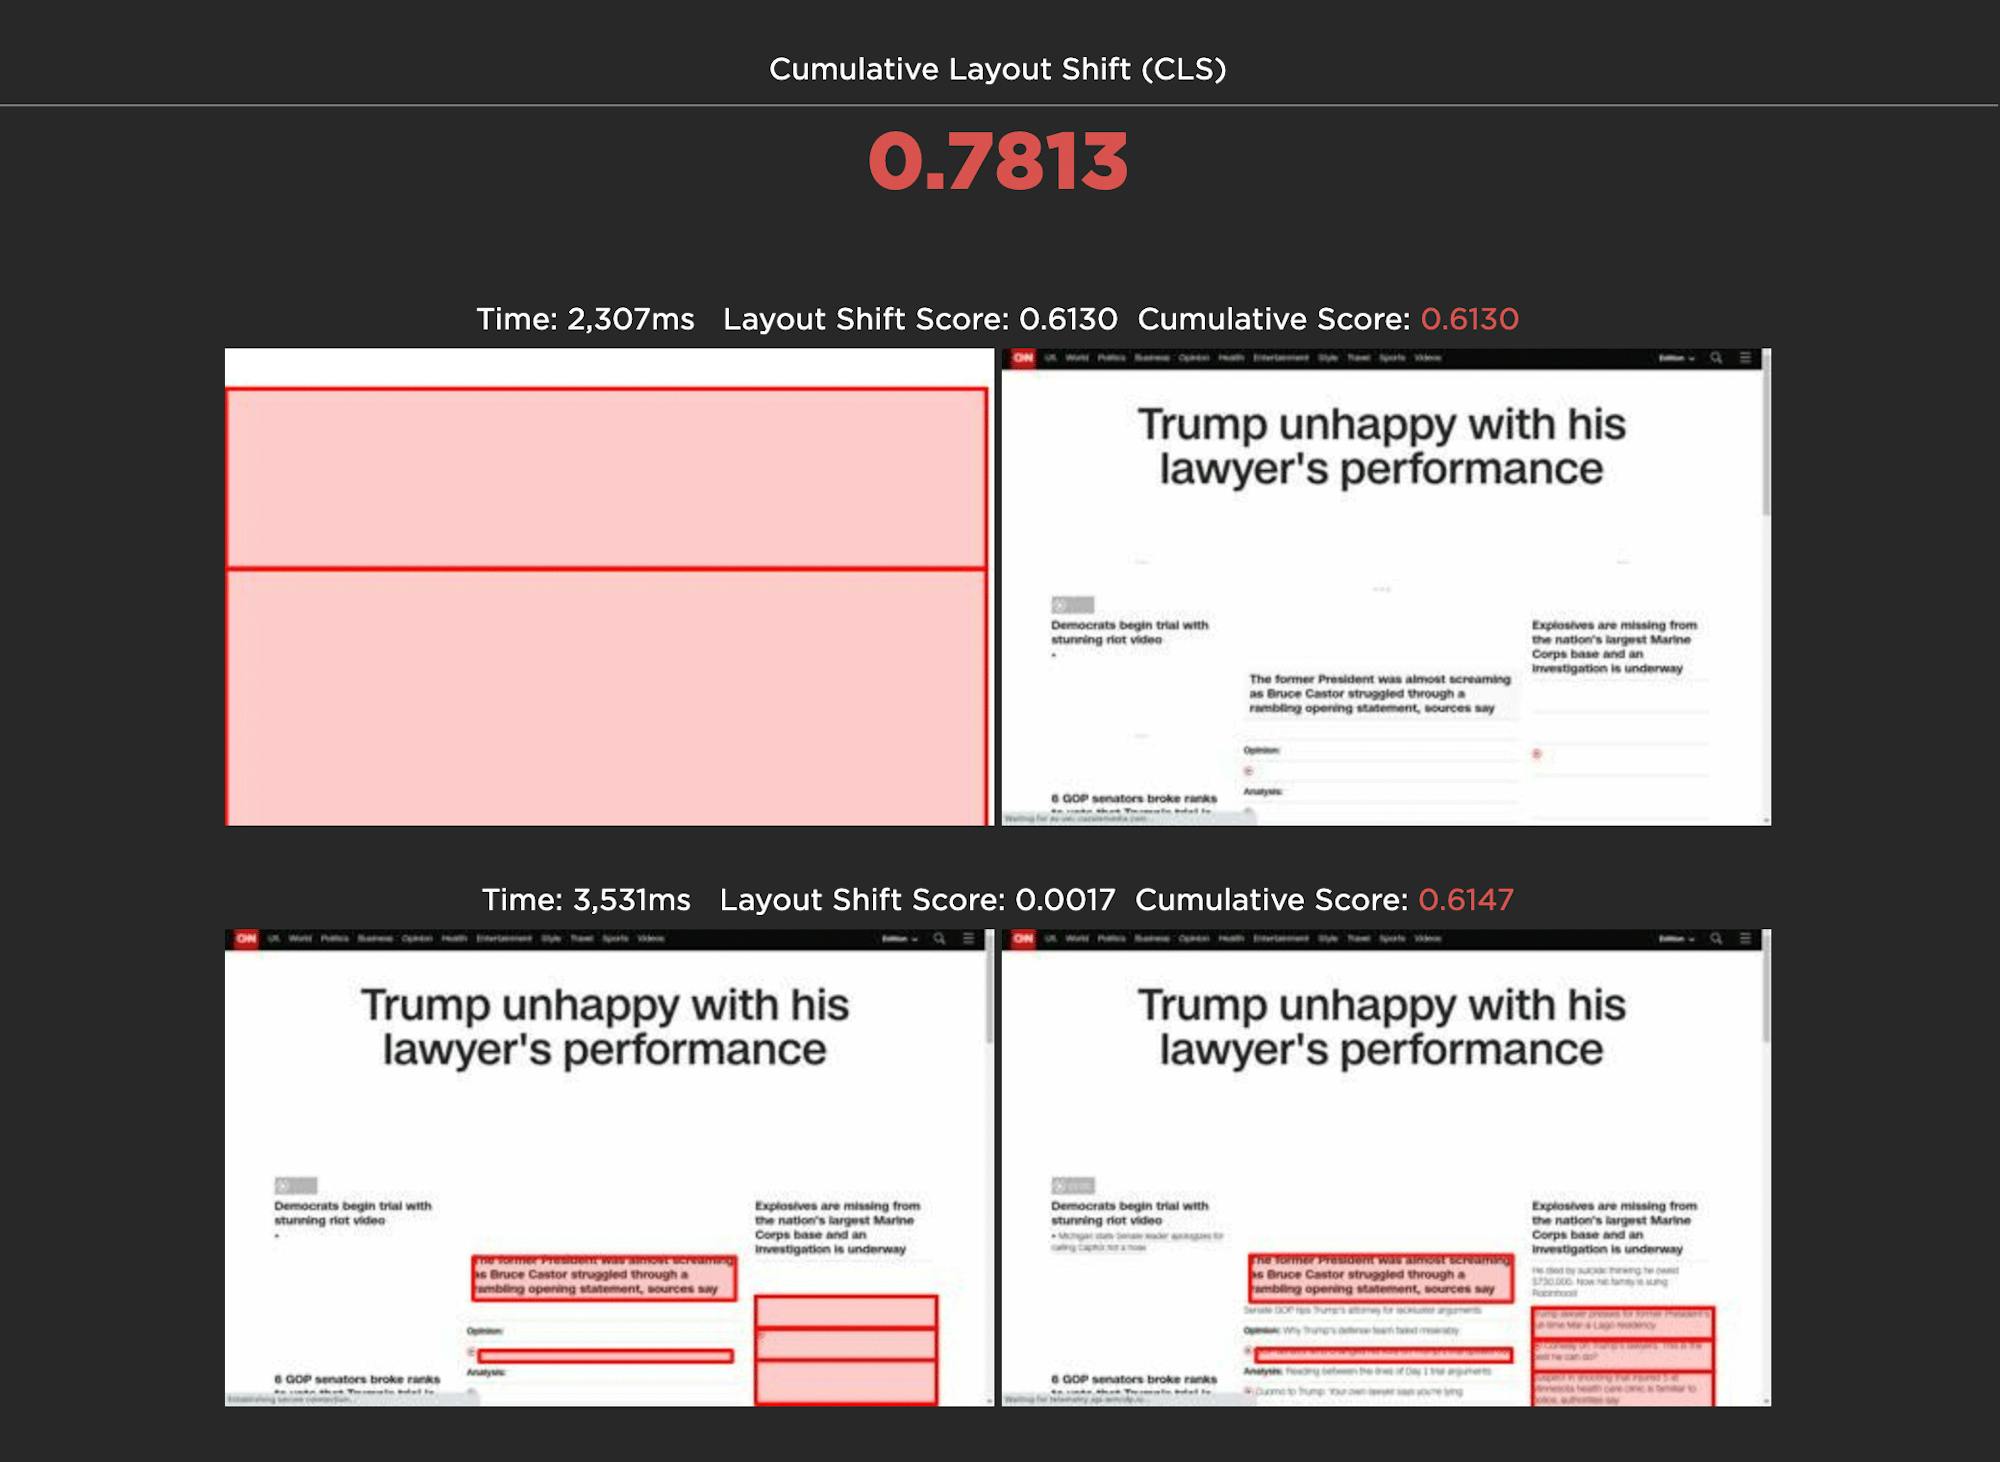
Cumulative Layout Shift (CLS) is another one of Google's Core Web vitals. CLS is a score that captures how often a user experiences unexpected layout shifts as the page loads. Elements like ads and custom fonts can push important content around while a user is already reading it. A poor CLS score could be a sign that page feels janky to your users.
> First Input Delay (RUM)
First Input Delay (FID) is another Core Web Vital. It's the amount of time it takes for the page to respond to a user input (e.g. click, key, tap). While this can be a helpful metric to track, it's important to understand that FID doesn't paint a complete picture of user interaction, as described in this post. This is why you should consider augmenting it with Total Blocking Time...
> Total Blocking Time (Synthetic)
Total Blocking Time (TBT) is the total time between First Contentful Paint and Time to Interactive (more on both of those metrics later in this post) when the browser's main thread is blocked long enough to prevent responsiveness. TBT is one of Google's recommended Core Web Vitals metrics for lab/synthetic testing, as it's considered a decent synthetic proxy for First Input Delay, which is only measurable with RUM.
While it's great that Web Vitals includes a CPU metric like TBT, there are some caveats you should be aware of if you're tracking Total Blocking Time. This leads us to Long Tasks...
> Long Tasks (Synthetic and RUM)
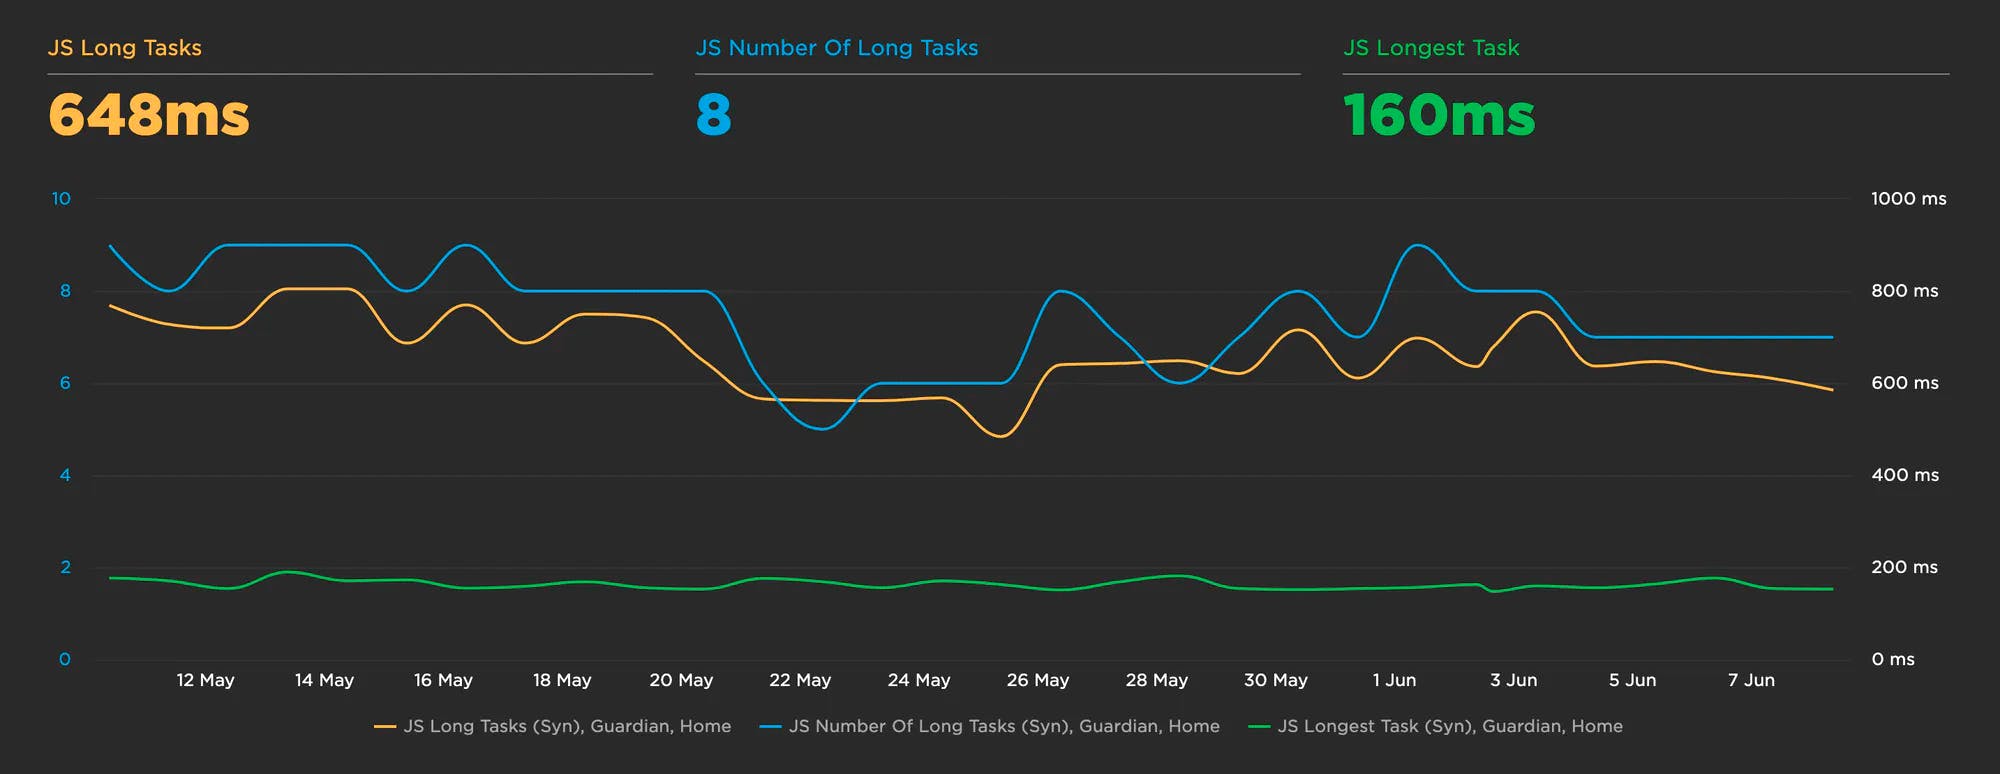
The three metrics above – CLS, FID, and TBT – are all part of Google's Core Web Vitals. This is great if you want to focus on performance for Chrome users or you're (rightfully) concerned about SEO for Google. But if you need to investigate performance for other browsers – or if you want to avoid the FID and TBT caveats mentioned above – then you should look at Long Tasks time. This is the total time of all your JavaScript tasks over 50ms, from navigation start until the page is fully loaded. Tracking Long Tasks will give you a better understanding of the impact that long tasks have on the entire page load and your users.
Other metrics to consider...
The metrics above are a good starting point. After you've identified the best ones for your pages, here are some others to consider.
> Custom metrics (Synthetic + RUM)
Custom metrics are the gold standard. Using the W3C User Timing spec, you can add timestamps around the specific page elements that matter most to you. (Here's how to add custom timers in SpeedCurve.) You can create custom metrics to track everything from headlines to call-to-action buttons. Twitter has used custom timers to create a Time to First Tweet metric. Pinterest has created a Pinner Wait Time metric.
Custom timers are great, but they do require some expertise to identify what you want to track and then add the timestamps to your pages, as well as ongoing maintenance. Still, they're worth investigating if you have the resources and the need.
> Lighthouse scores (Synthetic)
Google Lighthouse is an open-source tool that checks your page against rules for Performance, PWA, Accessibility, Best Practice, and SEO. For each of those categories, you get a score out of 100 and recommendations on what to fix.

While it's possible to game Lighthouse and get high scores for poorly built pages, for the most part Lighthouse scores and audits are a good thing. It's not a bad idea to track your scores to make sure you're not regressing, and then if you do experience a regression, drill down into your audits to identify the cause.
> Third parties (Synthetic)
If you have a lot of third parties – or even just a few potentially problematic ones (I'm looking at you, render-blocking scripts) – you should consider setting performance budgets for them. I like to track Long Tasks time alongside total size and total number of requests for unique third parties.
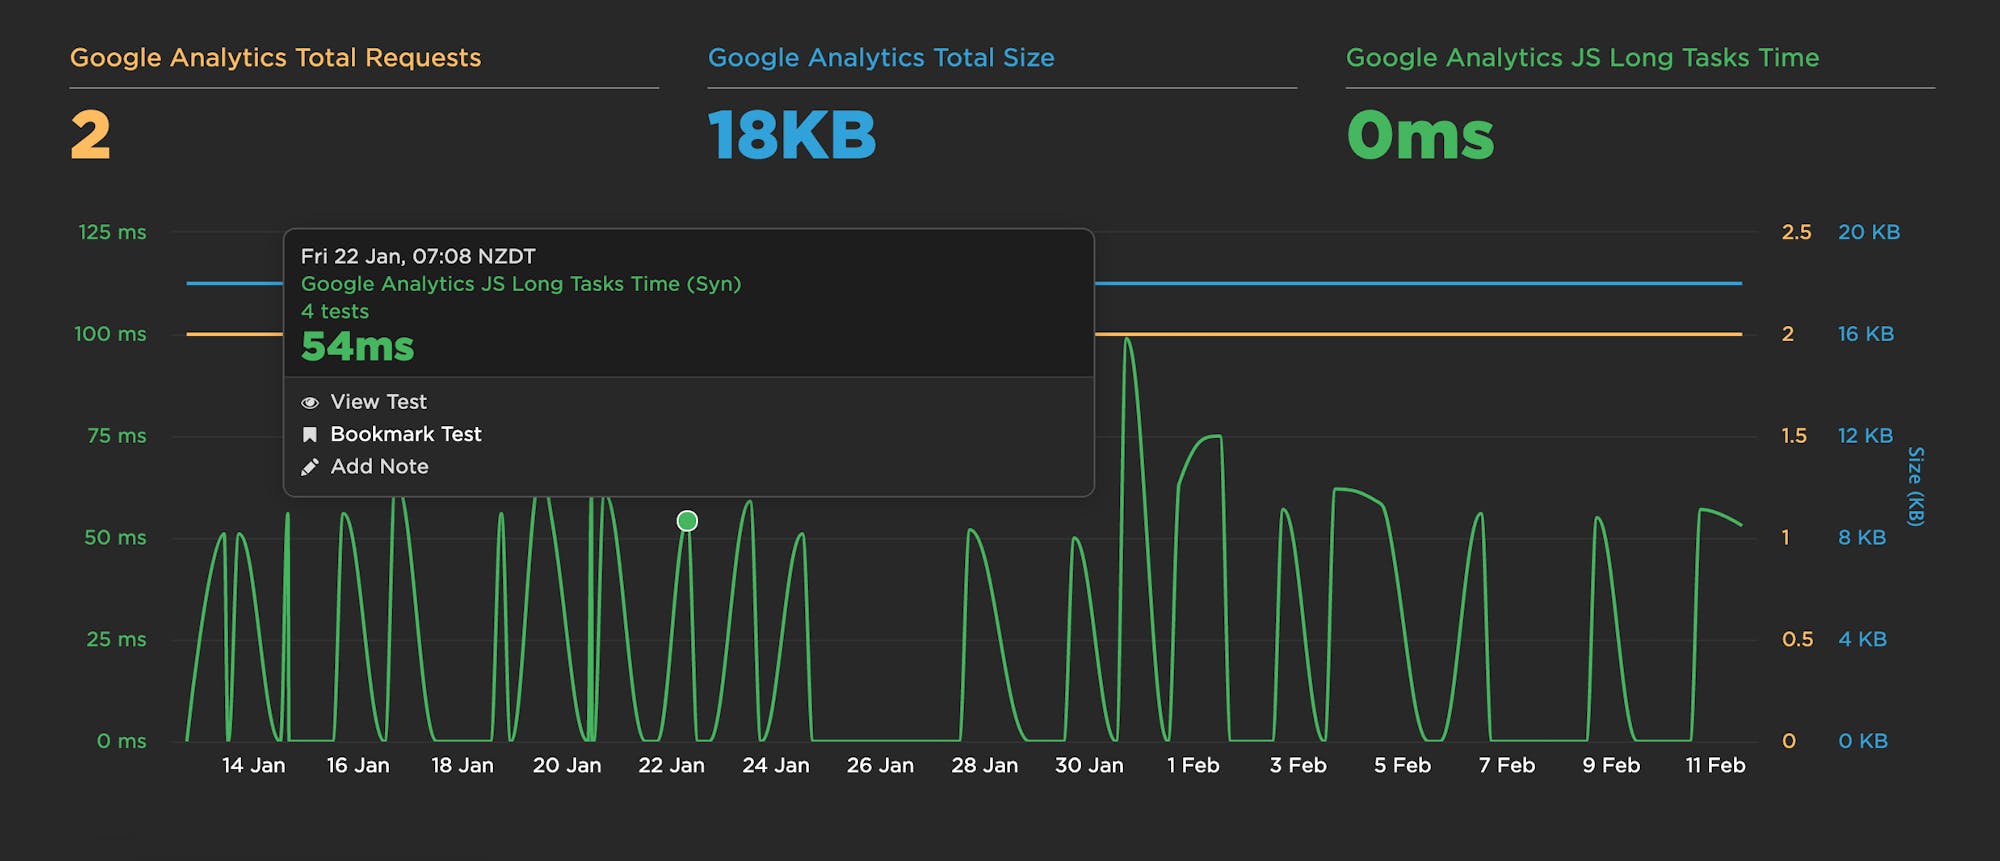
The example above gives a really eye-opening look at how much variability happens with Long Tasks, which would otherwise be hidden if all you look at are size and requests.
> Page Size & Requests (Synthetic)
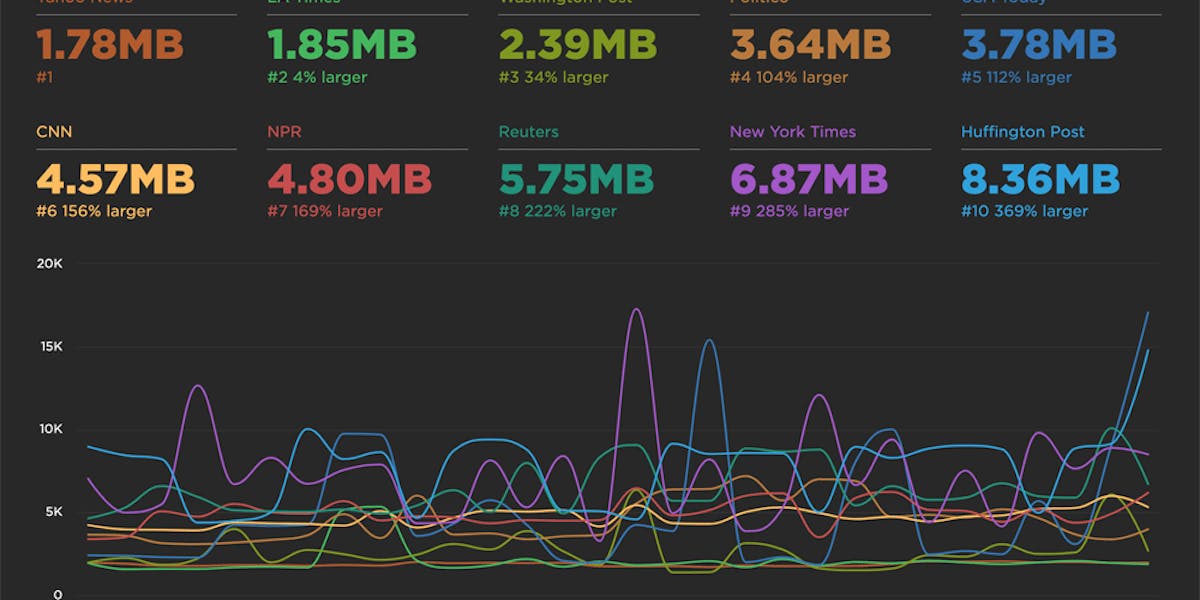
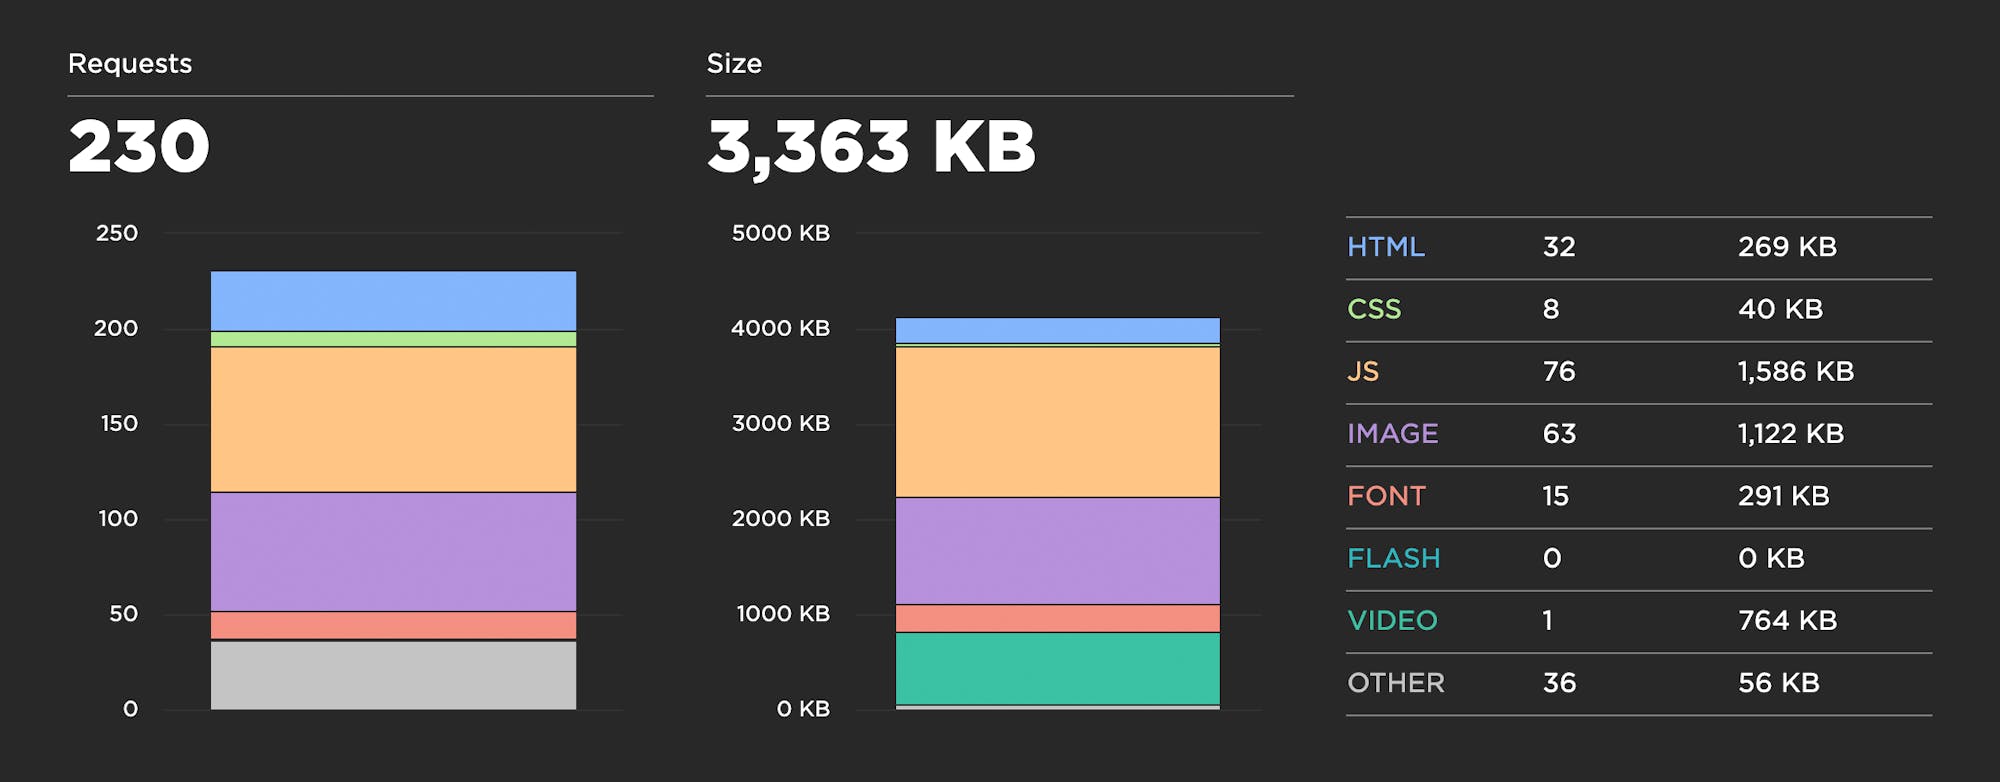
If you're concerned about serving huge pages to your mobile users (which I would argue you should be), then you should consider tracking metrics like page size and number of resources. In an ideal world, pages served to mobile devices should be under 1 MB – and definitely not more than 2 MB – but I often see pages in excess of 5 MB. Media sites are particularly guilty of this.
Without naming names, here's an example of mobile home page metrics for a mainstream news site, which I was able to find without much searching. Looking at the resource breakdown, you might want to set specific performance budgets on JS, image, and video sizes.
Metrics you might not need to track
This is where things get controversial. ¯\_(ツ)_/¯
When performance metrics are deprecated, they tend to slip away quietly, so it's completely understandable that you might still be tracking metrics that aren't as helpful as they could be. There very well might be good reasons why you should still continue tracking the metrics below. But if you don't know those reasons – or if you're just tracking them because you've heard that everyone else does – you should investigate why. Otherwise, it might be time to say goodbye to these...
> Speed Index (Synthetic)
Speed Index was an important metric when it first came out several years ago. It uses an algorithm to identify when the visible parts of a page are displayed. This was a huge evolutionary leap in that it represented the first time any tool attempted to tackle the issue of measuring what users actually see. However, because Speed Index is dependent on how the page is built, it's not a one-size-fits-all metric. To illustrate:
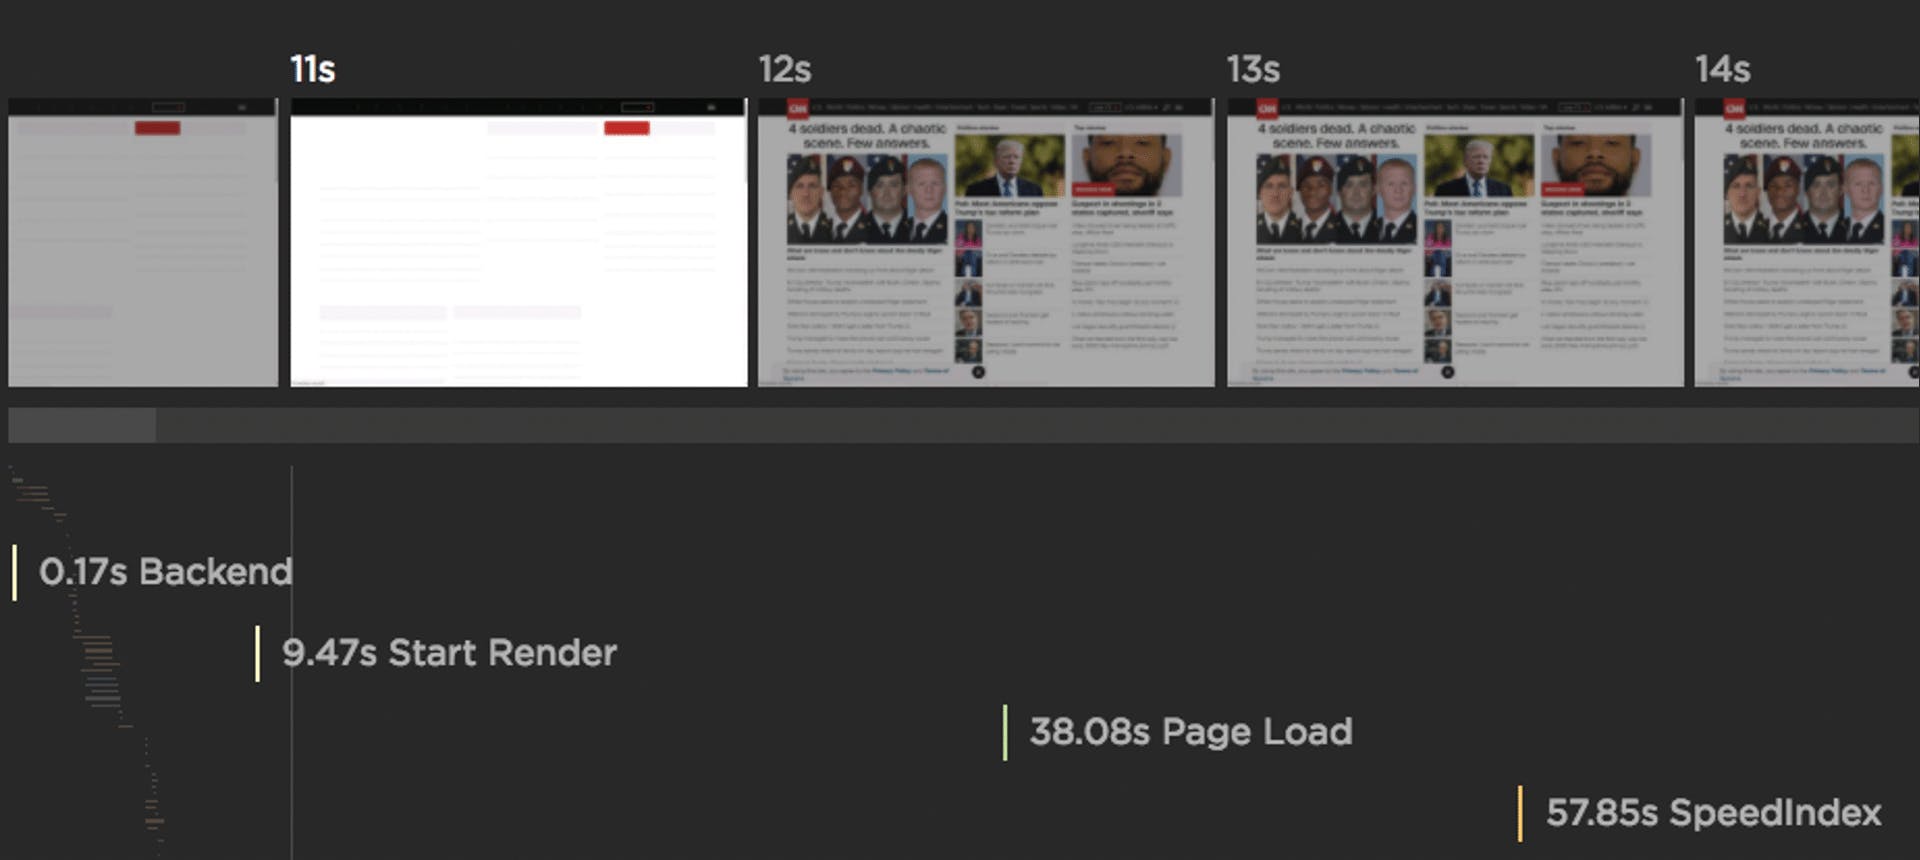
These days, it's not so much that Speed Index is a bad metric – it's that we've simply found better ways to measure when important content has rendered and stabilized in the page.
Use instead: Largest Contentful Paint, Cumulative Layout Shift
> Load Time / Fully Loaded (Synthetic and RUM)
I've been doing performance things long enough to remember when Load Time / Fully Loaded used to be helpful user experience metrics. That was before pages filled up with dozens (and sometimes hundreds) of analytics tags, tracking beacons, and other third parties that silently push out your total load time.
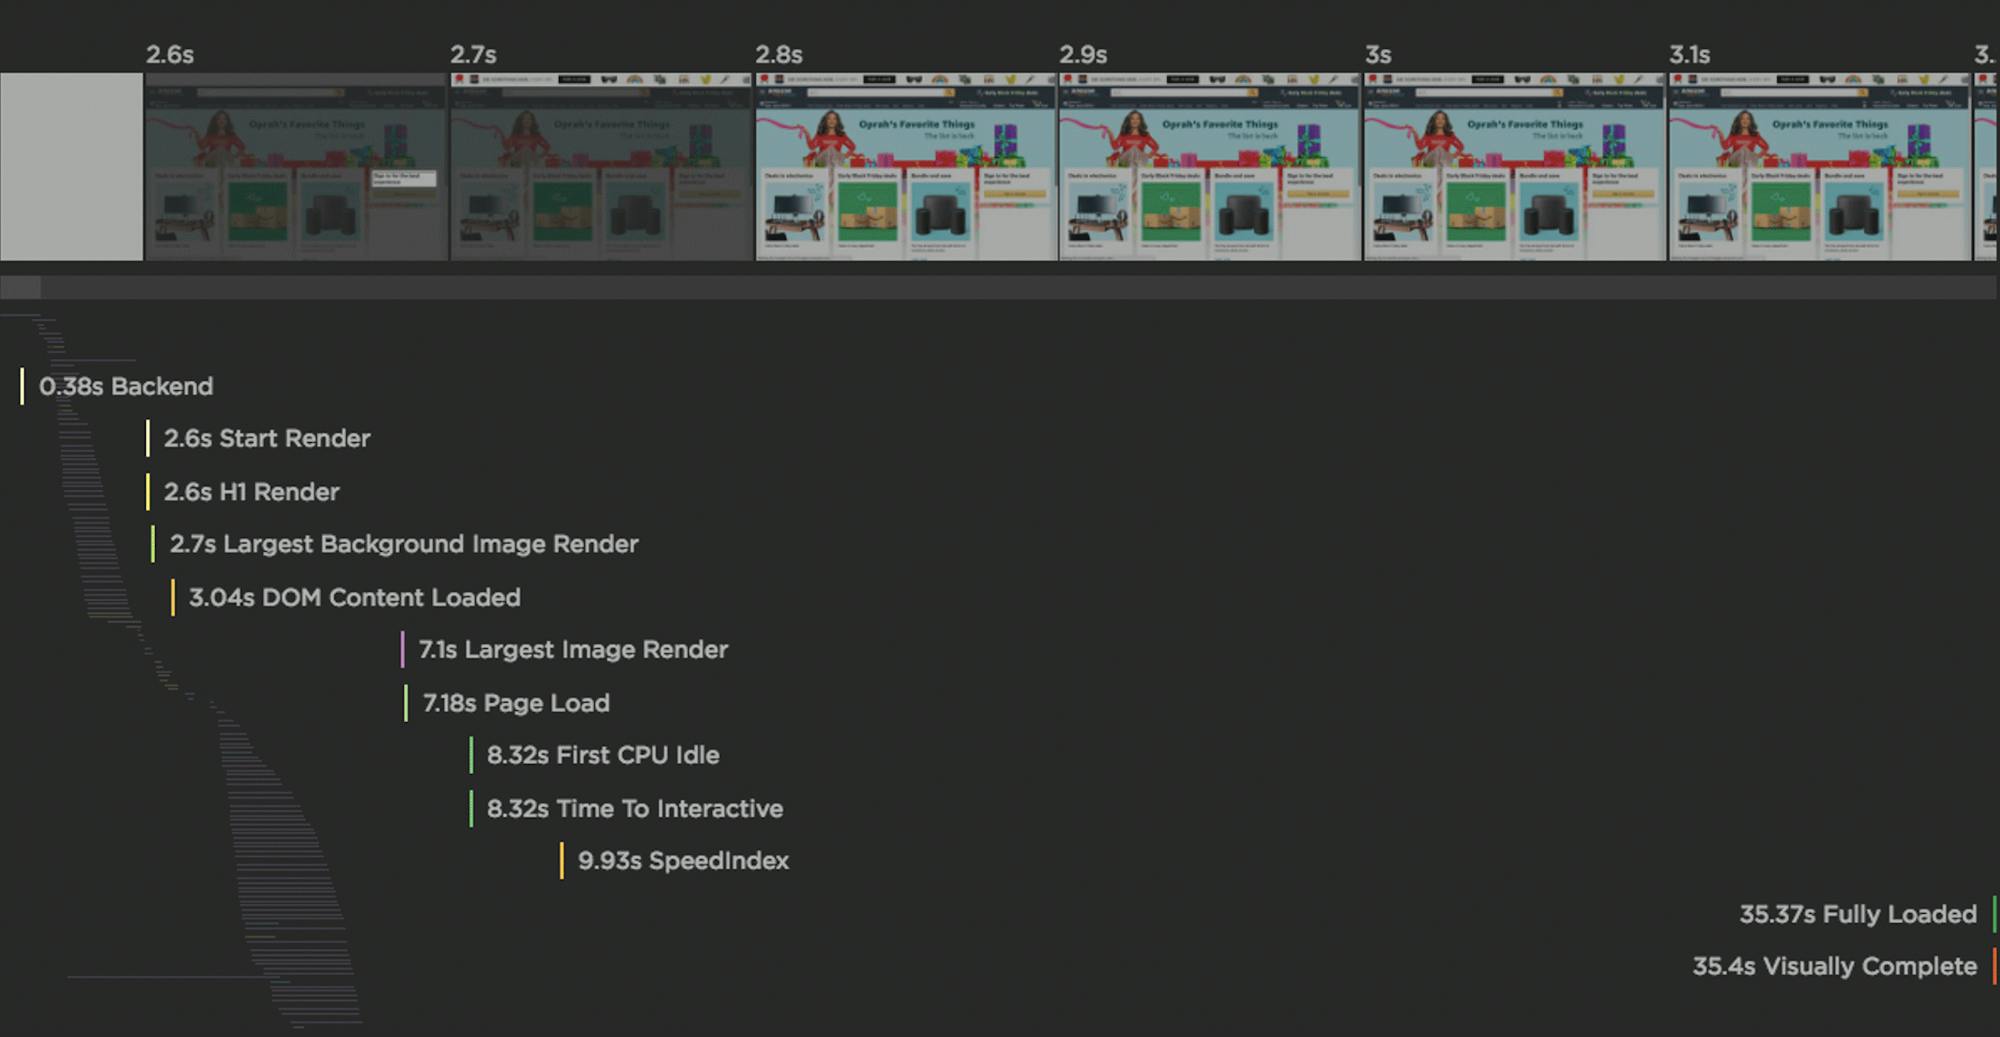
Nowadays, I don't recommend using Load Time (or Fully Loaded) as a metric for user-perceived performance. At best, what it can tell you is when all those aforementioned third parties are egregiously pushing out your page rendering.
> Visually Complete (Synthetic)
Visually Complete is the time at which all the content in the viewport has finished rendering and nothing changes in the viewport after that point as the page continues to load. Like Speed Index, Visually Complete was another helpful metric for its time, but it came with its fair share of gotchas – such as the fact that it sometimes didn't fire until after the page had fully rendered (see above) – and has now been deprecated in favour of more accurate metrics.
Use instead: Last Painted Hero
> First Contentful Paint & First Meaningful Paint (Synthetic)
There was a lot of excitement a few years ago when these metrics were released. They seemed like promising indicators of user-perceived performance, but over time we've found that they're not consistent enough across all pages to be universally recommended. In one analysis of 40 top-ranked sites, my colleague Joseph found that 50% of FMP events and 85% of FCP events occurred before Start Render – meaning the viewport was empty.
Use instead: Largest Contentful Paint or set up your own custom timers on important page elements
> Time to Interactive (Synthetic)
One of the biggest issues with Time to Interactive (TTI) is that it doesn't mean what many people think it means. A page can be interactive well before TTI is fired. Specifically, TTI is the first span of 5 seconds where the browser main thread remains unblocked for more than 50ms after the First Contentful Paint is fired, with no more than 2 in-flight requests.
(Just FYI, I had to look up that definition. That's another issue with TTI: it's pretty much impossible for most people to explain off the cuff. In my opinion, a hallmark of a good metric is that it should be easy to define.)
Use instead: Long Tasks time and the other metrics in the "How does it feel?" section above
–––––––––––––––––––
2. What should your budget thresholds be?
This is a huge question. After you've identified which metrics to track, you want to know what the budgets for those metrics should be. It's super important to remember one thing:
Performance budgets are NOT the same as performance goals.
- Your performance goals are aspirational. They answer the question: How fast do I want to be eventually?
- Your performance budgets are practical. They answer the question: How can I keep my site from getting slower while I work toward my performance goals?
Priority 1: Create performance budgets to fight regression
A good practice is to look at your last 2-4 weeks of data for a given metric, identify the worst number, and then set your performance budget for that number. (Hat tip to Harry Roberts for this best practice.) In this example, the worst Start Render time over the past month was 3.5 seconds, so that's the performance budget (represented by the red line):
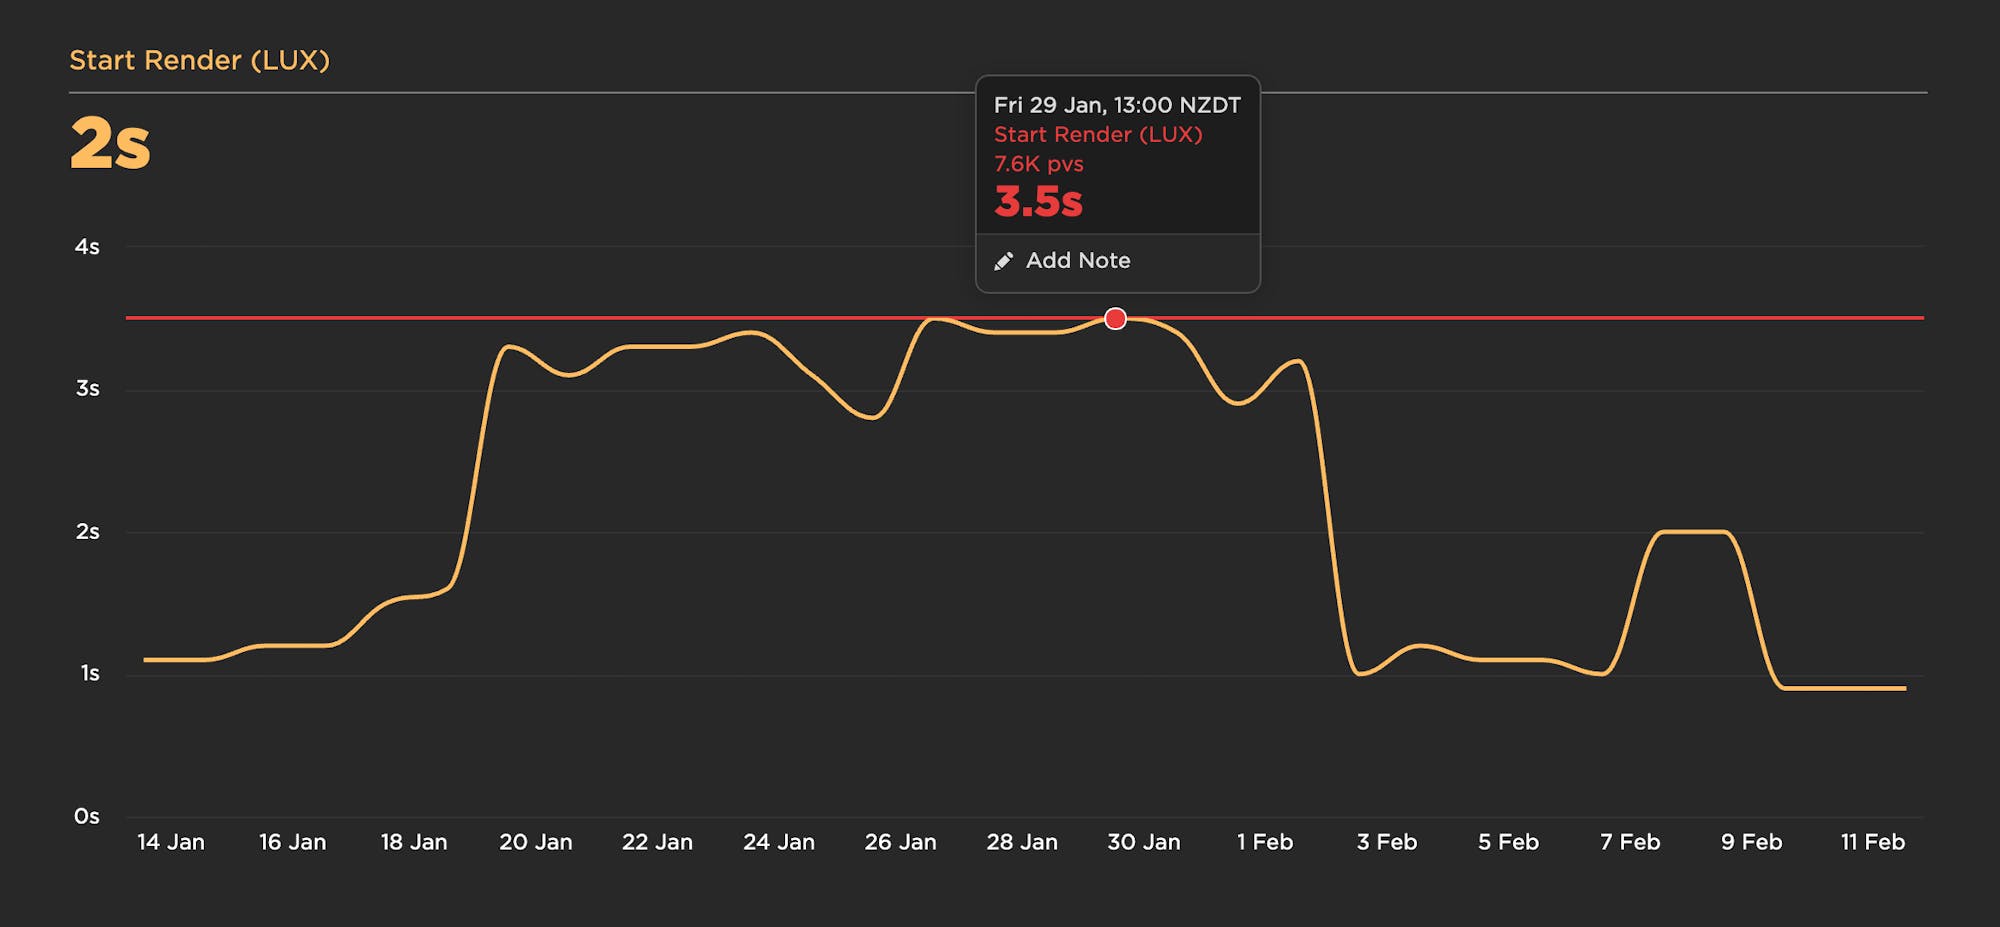
You can also set your budgets to send alerts when you go out of bounds. As you work on optimizing your pages and improving your numbers, you should revisit your budgets every 2-4 weeks and update them. Ideally, your performance budgets will keep getting smaller as you move toward meeting your goals for each metric.
Priority 2: Set long-term goals
Your performance goals could be driven by a number of factors, including...
How fast are your competitors?
A good rule of thumb: Aim to be at least 20% faster than the competition. To find out how fast your competitors are, you can:
- use synthetic testing tools (like ours), which let you measure any URLs,
- look up industry benchmarks for media, retail, and travel, and
- read industry case studies, like those gathered on WPOstats.com.
How fast should you be to improve your business metrics?
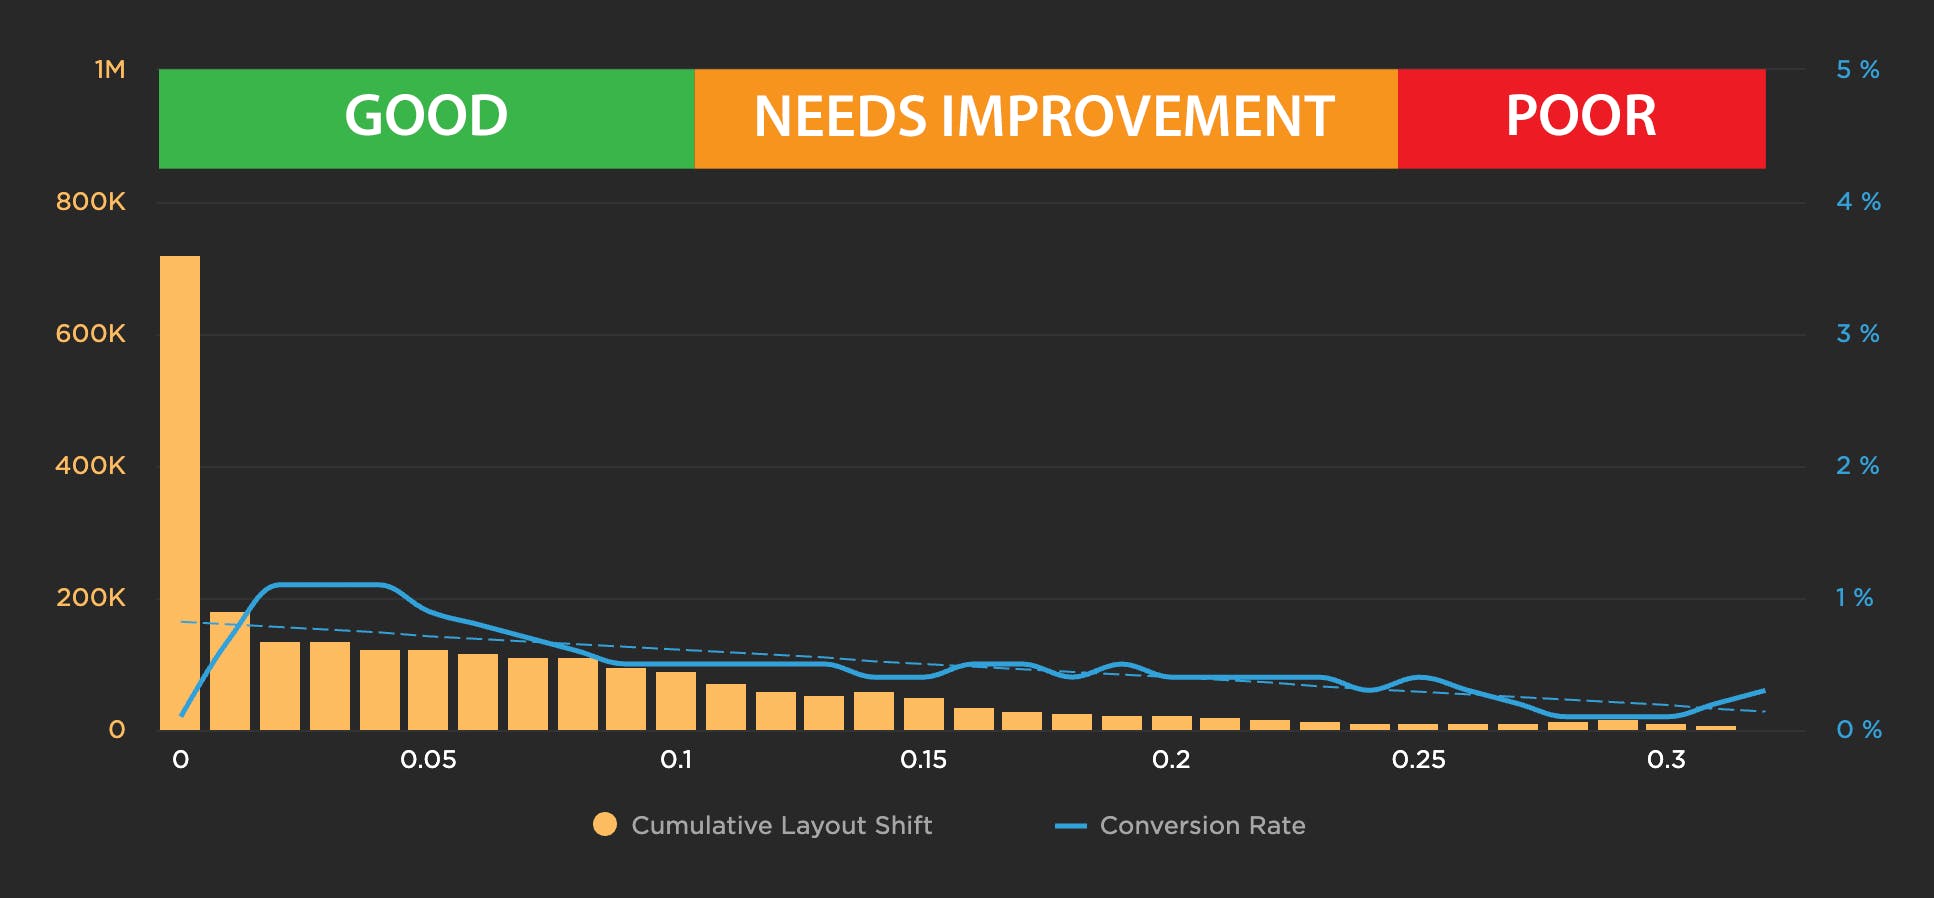
This is where you need to track your own real user data. You can map your performance metrics to your business metrics and generate correlation charts, such as the one below, which illustrates how conversion rate decreases as the CLS score worsens.
How fast do you need to be for SEO?
Google's Core Web Vitals will be a search ranking signal in May 2021. Luckily, Google has been very open about the thresholds you should aim for.
What should your performance goals ultimately be?
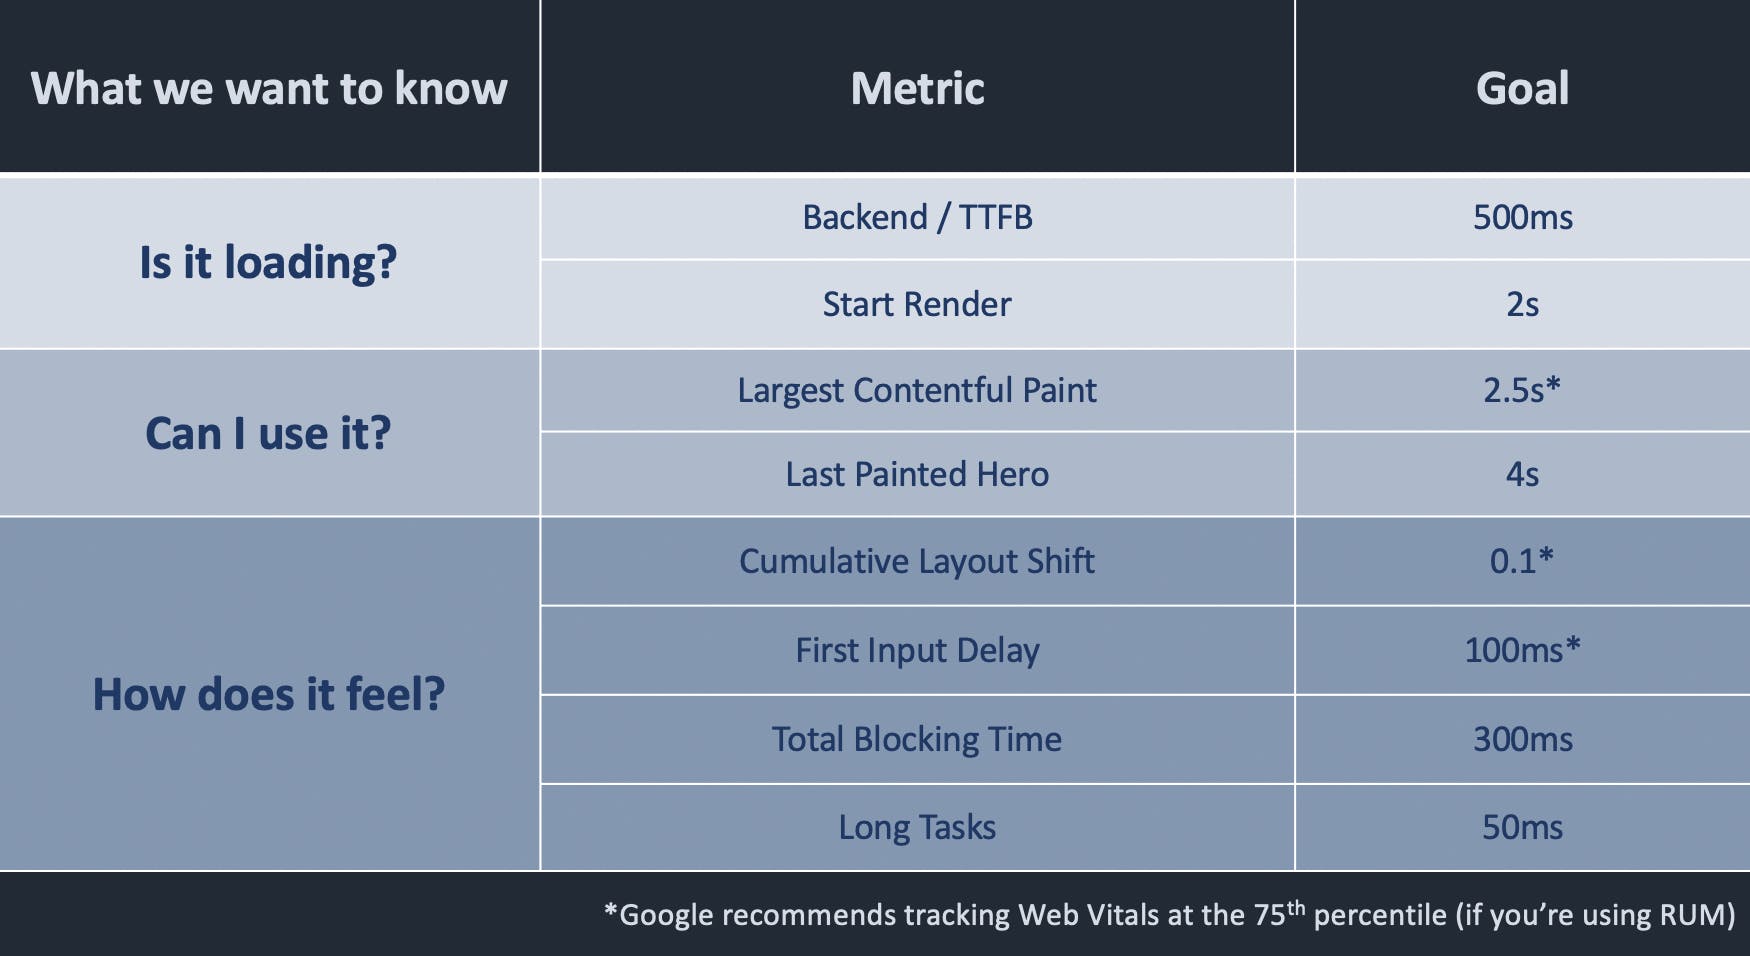
Here's a cheat sheet of metrics and goals (NOT performance budgets), based on broad benchmarks and Google's recommendations. Note that these are intended as a starting point only. Look at your own industry/competitor benchmarks and your own data!
–––––––––––––––––––
3. How to manage your performance budgets
So you have a shortlist of metrics to track and some numbers to work with. Great! Here are some other FAQs:
Should you set up performance budgets in synthetic or real user monitoring – or both?
In an ideal world, you're using both synthetic and real user monitoring (RUM). You can create performance budgets in both, depending on what you want to get out of your budgets.
For example:
- Set up performance budgets and alerts on RUM, and drill down via synthetic – I love to create charts where I track the same metric – such as Start Render or Largest Contentful Paint – in both RUM and synthetic. I create the budget for the RUM version of the metric and get an alert when the budget is violated. Because I'm tracking synthetic data in the same chart, I can easily drill down and get detailed test results and diagnostics.
- Set up performance budgets in synthetic, and integrate with your CI/CD process – You can integrate your performance budgets and alerts with your CI/CD processes so that you run tests every time you do a deploy and get alerts if any changes you've introduced have caused budget violations. You can even opt to break the build if any of your budgets are violated.
Do you need to create performance budgets for all your metrics?
Start small, with a manageable number of metrics. If you're just starting out, it's absolutely fine to focus on just a handful of metrics. You can create performance budgets for all of them, but if you're setting up alerting, maybe focus on just setting up alerts on critical metrics like Backend time, Start Render, and Largest Contentful Paint.
How often should you revisit your budgets?
If you're taking the practical, iterative approach recommended above, then you should revisit your budgets every 2-4 weeks and adjust them (hopefully downward) accordingly.
–––––––––––––––––––
Takeaways
As you (hopefully) go away and start exploring performance metrics and budgets for your site, remember:
- Start small. With so many performance metrics out there, it's easy to become overwhelmed.
- Tailor metrics to different audiences. Who is looking at this data? Marketing? SEO team? Engineers/devs? Business folks? Each of those groups care about different things. Each group should know why they're tracking their metrics, and what the rationale is behind their budgets.
- These recommendations are a jumping-off point, not a hard-and-fast set of rules. Some of these metrics might not be appropriate to your pages. Other metrics that are not listed here might be better for you. As you go further into your performance journey, the metrics you want to track could become more nuanced. Make sure to validate any metrics – e.g., visually, via synthetic rendering filmstrips – that you're considering tracking.
- Metrics are always evolving. The metrics you track now may not be the metrics you'll be tracking in a year. That's a good thing! We've come a long way since page load, friends!
–––––––––––––––––––
More reading
- Performance Budgets, Pragmatically – Harry Roberts
- Can You Afford It? Real-World Performance Budgets – Alex Russell
- Performance Budgets That Stick – Tim Kadlec
- How Performance Budgets Help Wehkemp Keep Its Website Highly Performant – Berry de Witte
- How Shopify Used Performance Budgets to Craft Faster Themes – Thomas Kelly


