A retailer's guide to web performance

I’m at Shop.org this week, having really interesting conversations with online retailers. What I love about talking with this crowd is that – like me – they're super focused on user-perceived performance. Not surprisingly, we have a lot to talk about.
Making customers happy is the not-so-secret secret to retail success. Delivering a fast, consistent online experience has been proven to measurably increase every metric retailers care about – from conversions and revenue to retention and brand perception. (In fact, there's so much research in this area, I dedicated an entire chapter in my book to it. You can also find a number of great studies on WPO Stats.)
Delivering great, fast online experiences starts with asking two questions:
- What’s making my pages seem slower for my users?
- What can I do about it?
The good news is that most of the issues that are making pages slow for your shoppers are right on your pages, which means you have control over them. Here's an overview of the most common performance issues on retail sites, and how you can track them down and fix them.
What's making my pages seem slower?
I’ve analyzed hundreds (and possibly thousands) of retail web pages over the past several years. In my experience, the vast majority of performance issues are caused by four things:
- Third parties, such as trackers and analytics
- Stylesheets
- Custom fonts
- Page size, particularly image size
Third parties
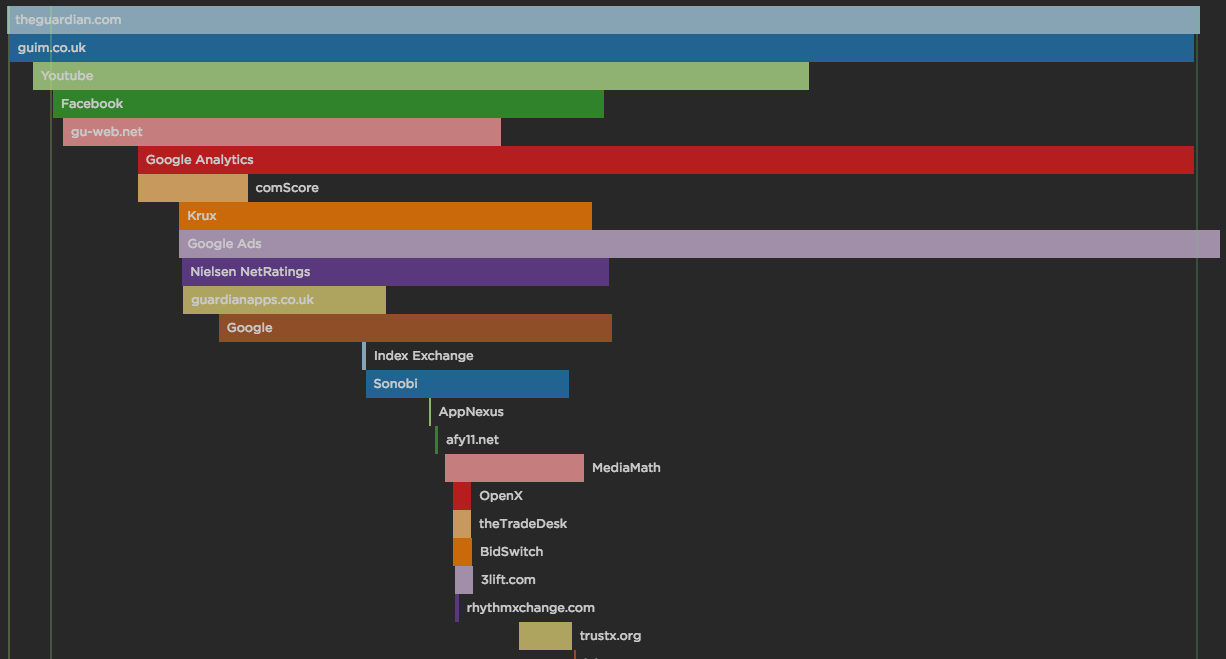
A typical retail web page these days can contain upwards of 75 third-party scripts, such as trackers and analytics beacons. Third parties add tons of value by increasing conversions (via targeting beacons) and helping you understand your users in unprecedented ways (via analytics tags), so they’re not going away any time soon. But as pretty much everyone knows by now, they can really affect how your page renders.
What you can do: Monitor the speed of your third parties
Start by taking a proactive approach to understanding any potential performance damage your third parties can cause. You can't fix what you're not measuring, which is why we built a third-party waterfall chart into SpeedCurve, so you can see at a glance how your third parties are performing.
Read > UX focus for third parties
Case study > Marks & Spencer revolutionized performance by focusing on third party content
Stylesheets
Stylesheets are an incredible boon for modern webpages. They solve a myriad of design problems, from browser compatibility to design maintenance and updating. Without stylesheets, we wouldn’t have great things like responsive design. However, poorly executed stylesheets can create a host of performance problems. These range from CSS that takes too long to download and parse, to improperly placed stylesheets that blocks the rest of the page from rendering.
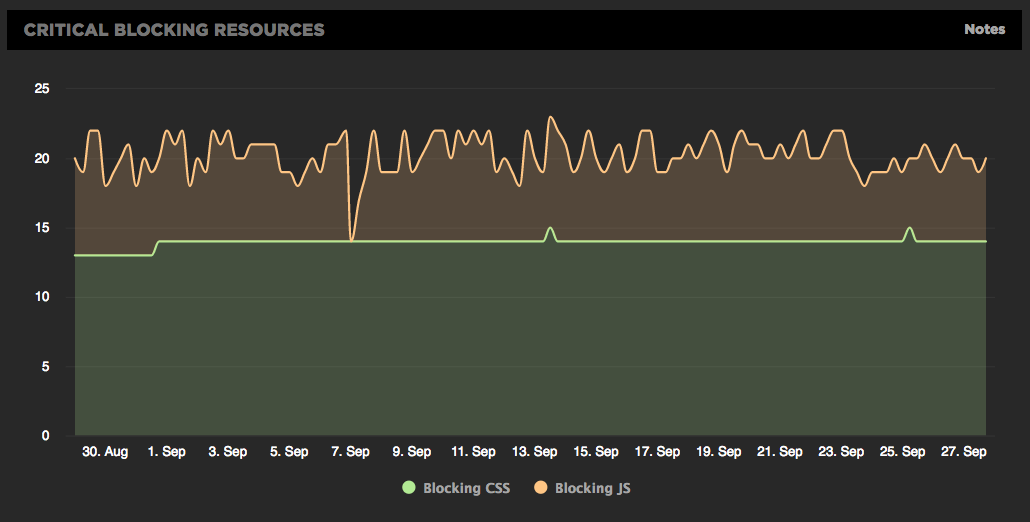
What you can do: Know which of your stylesheets can block your pages from rendering
Again, you can't fix what you don't measure. We've made it easy for you to find out if your pages have critical blocking resources, such as CSS and JavaScript. This chart is available on your Site dashboard and lets you quickly spot any issues.
Read > Measuring blocking resources
Custom fonts
Custom fonts allow designers unprecedented control over the typefaces used in their designs. This desire for control accounts for the surge in popularity for custom fonts. In 2010, only 1% of the top 1,000 websites used custom fonts. Today, that number has grown to 65%.
This popularity comes with a performance price tag. Some fonts require huge amounts of CSS code, while others have heavy JavaScript or are hosted externally – all of which can dramatically slow down page rendering.
What you can do: Track how quickly your fonts render
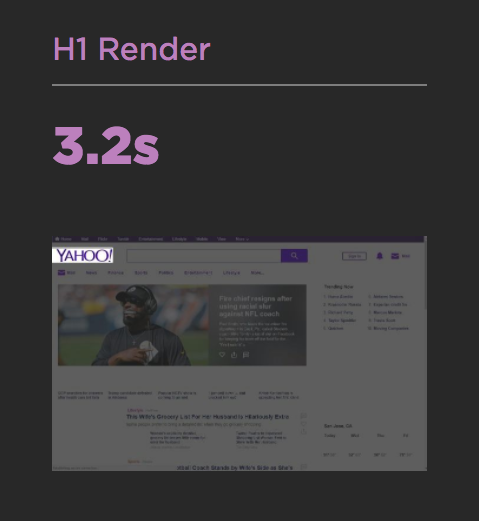
SpeedCurve’s new Hero Rendering Times are a set of metrics that measure when a page's most important content finishes rendering in the browser. H1 Render is one of these metrics. (I'll be talking about the other metrics later in this post.) It measures when your first H1 element finishes rendering. If a site uses custom fonts, it's quite likely that those fonts will be applied to H1 copy, which makes this metric a great way to measure how quickly your custom fonts are rendering.
Read > Hero Rendering Times: New metrics for measuring UX
Case study > NerdWallet used the H1 Render metric to help improve font loading by up to 30%
Images and page size
I’ve written about page bloat a lot over the years (most recently in this post). While page size doesn’t always correlate to a slower user experience, it often does. Huge unoptimized images are a frequent culprit. I’ve seen retail pages that contained hero images that were up to 5MB in size. That’s a lot of bytes, folks.
What you can do: Create performance budgets
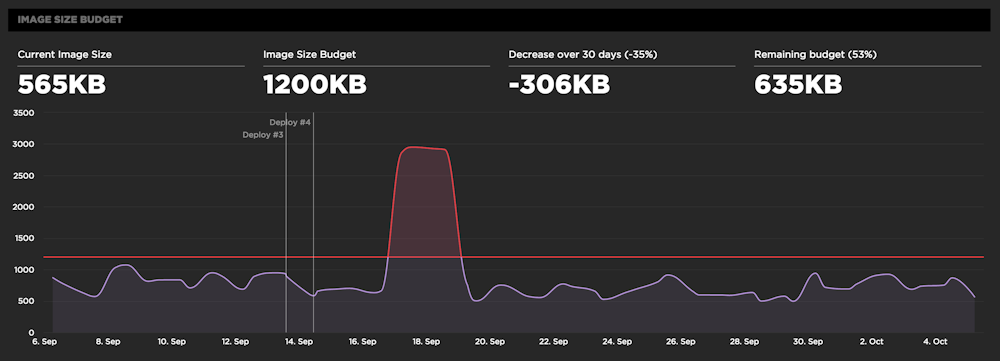
Performance budgets are a great way to manage page bloat. A performance budget starts with your team (everybody: marketing, designers and developers) agreeing on the principles around the user experience and how fast your website should feel.
You define a budget for each metric, such as the total size of your JavaScript, how many images should be on the page, and how quickly the page should start rendering. Once you define your budget, SpeedCurve starts monitoring and alerts you if the target budget is exceeded.
Read > Performance budgets in action
Case study > How Zillow became bigger, faster, and more engaging while on a budget
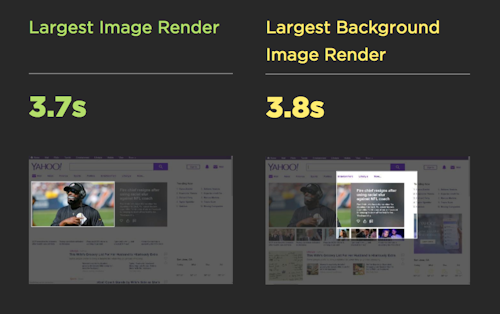
What you can do (part deux): Track the speed of your hero images
We’ve also made it easy for you to see at a glance how quickly your hero images render. For example, the Largest Image Render metric identifies when the largest image in the viewport finishes rendering. This metric is especially relevant to retail sites, where hero images on home, product, and campaign landing pages are critical elements.
Read > Hero Rendering Times: New metrics for measuring UX
Get started
Delivering fast, joyous experiences to online shoppers has never been as important as it is now. If you're already a SpeedCurve user, you can take advantage of the many ways to make your site feel faster for your users. If you're not already a SpeedCurve user, sign up for your free trial so you can explore these features and get to know your site better – the way your users see it.