2025 was a big year! Here are some highlights...

I say this every year, and every year I mean it: this has been a big year, for both SpeedCurve and the web performance community!

Some highlights:
- Broad browser support for important metrics like Largest Contentful Paint and Interaction to Next Paint
- Exciting new metrics and visualizations for measuring user happiness — as well as identifying the root causes of issues that lead to user UNhappiness
- Nuanced metrics for deeper diagnostics (especially digging into JavaScript issues that were previously elusive)
- Better performance budgets
- Easier for Shopify and Magento stores — as well as SPAs — to enjoy all the benefits of real user monitoring
Let's go!
Largest Contentful Paint is now supported by all major browsers!
Largest Contentful Paint (LCP) has had a long and winding journey. What some folks may not know is that LCP had its genesis way back in 2018, when Mark Zeman and Steve Souders (our chief SpeedCurvers) came up with the idea of a web performance metric that better represented a user's visual experience. They used JavaScript to find the largest element on the page, saved that rectangle to JSON, and then scanned through the video frames of a page loading to work out when that element was visible to the user.
This spawned a family of Hero Rendering metrics: Largest Image Render, Largest Background Image, Largest Text, First Painted Hero, and Last Painted Hero.
This then inspired Paul Irish on the Chrome team to add Largest Contentful Paint (LCP), which uses the same principles to calculate the paint time of an element. From its launch, LCP has became one of the most important Core Web Vital metrics used today by anyone curious about web performance.
But the missing piece of the puzzle was that LCP originally was only supported in Chrome. Firefox added LCP support last year, and most recently the Safari team has brought LCP (as well as Interaction to Next Paint) to Webkit.

What does this mean for folks who care about web performance? You can finally get visibility into the breadth of your users' experiences. No more blind spots!
Read: Understanding and Improving Largest Contentful Paint
New Vitals Overview dashboard
In October, we were excited to announce the launch of the Vitals Overview dashboard in SpeedCurve — an even faster way to find performance issues on your site. This dashboard has quickly become on of my favourites (and given how much I love all our dashboards, that's saying a lot!).
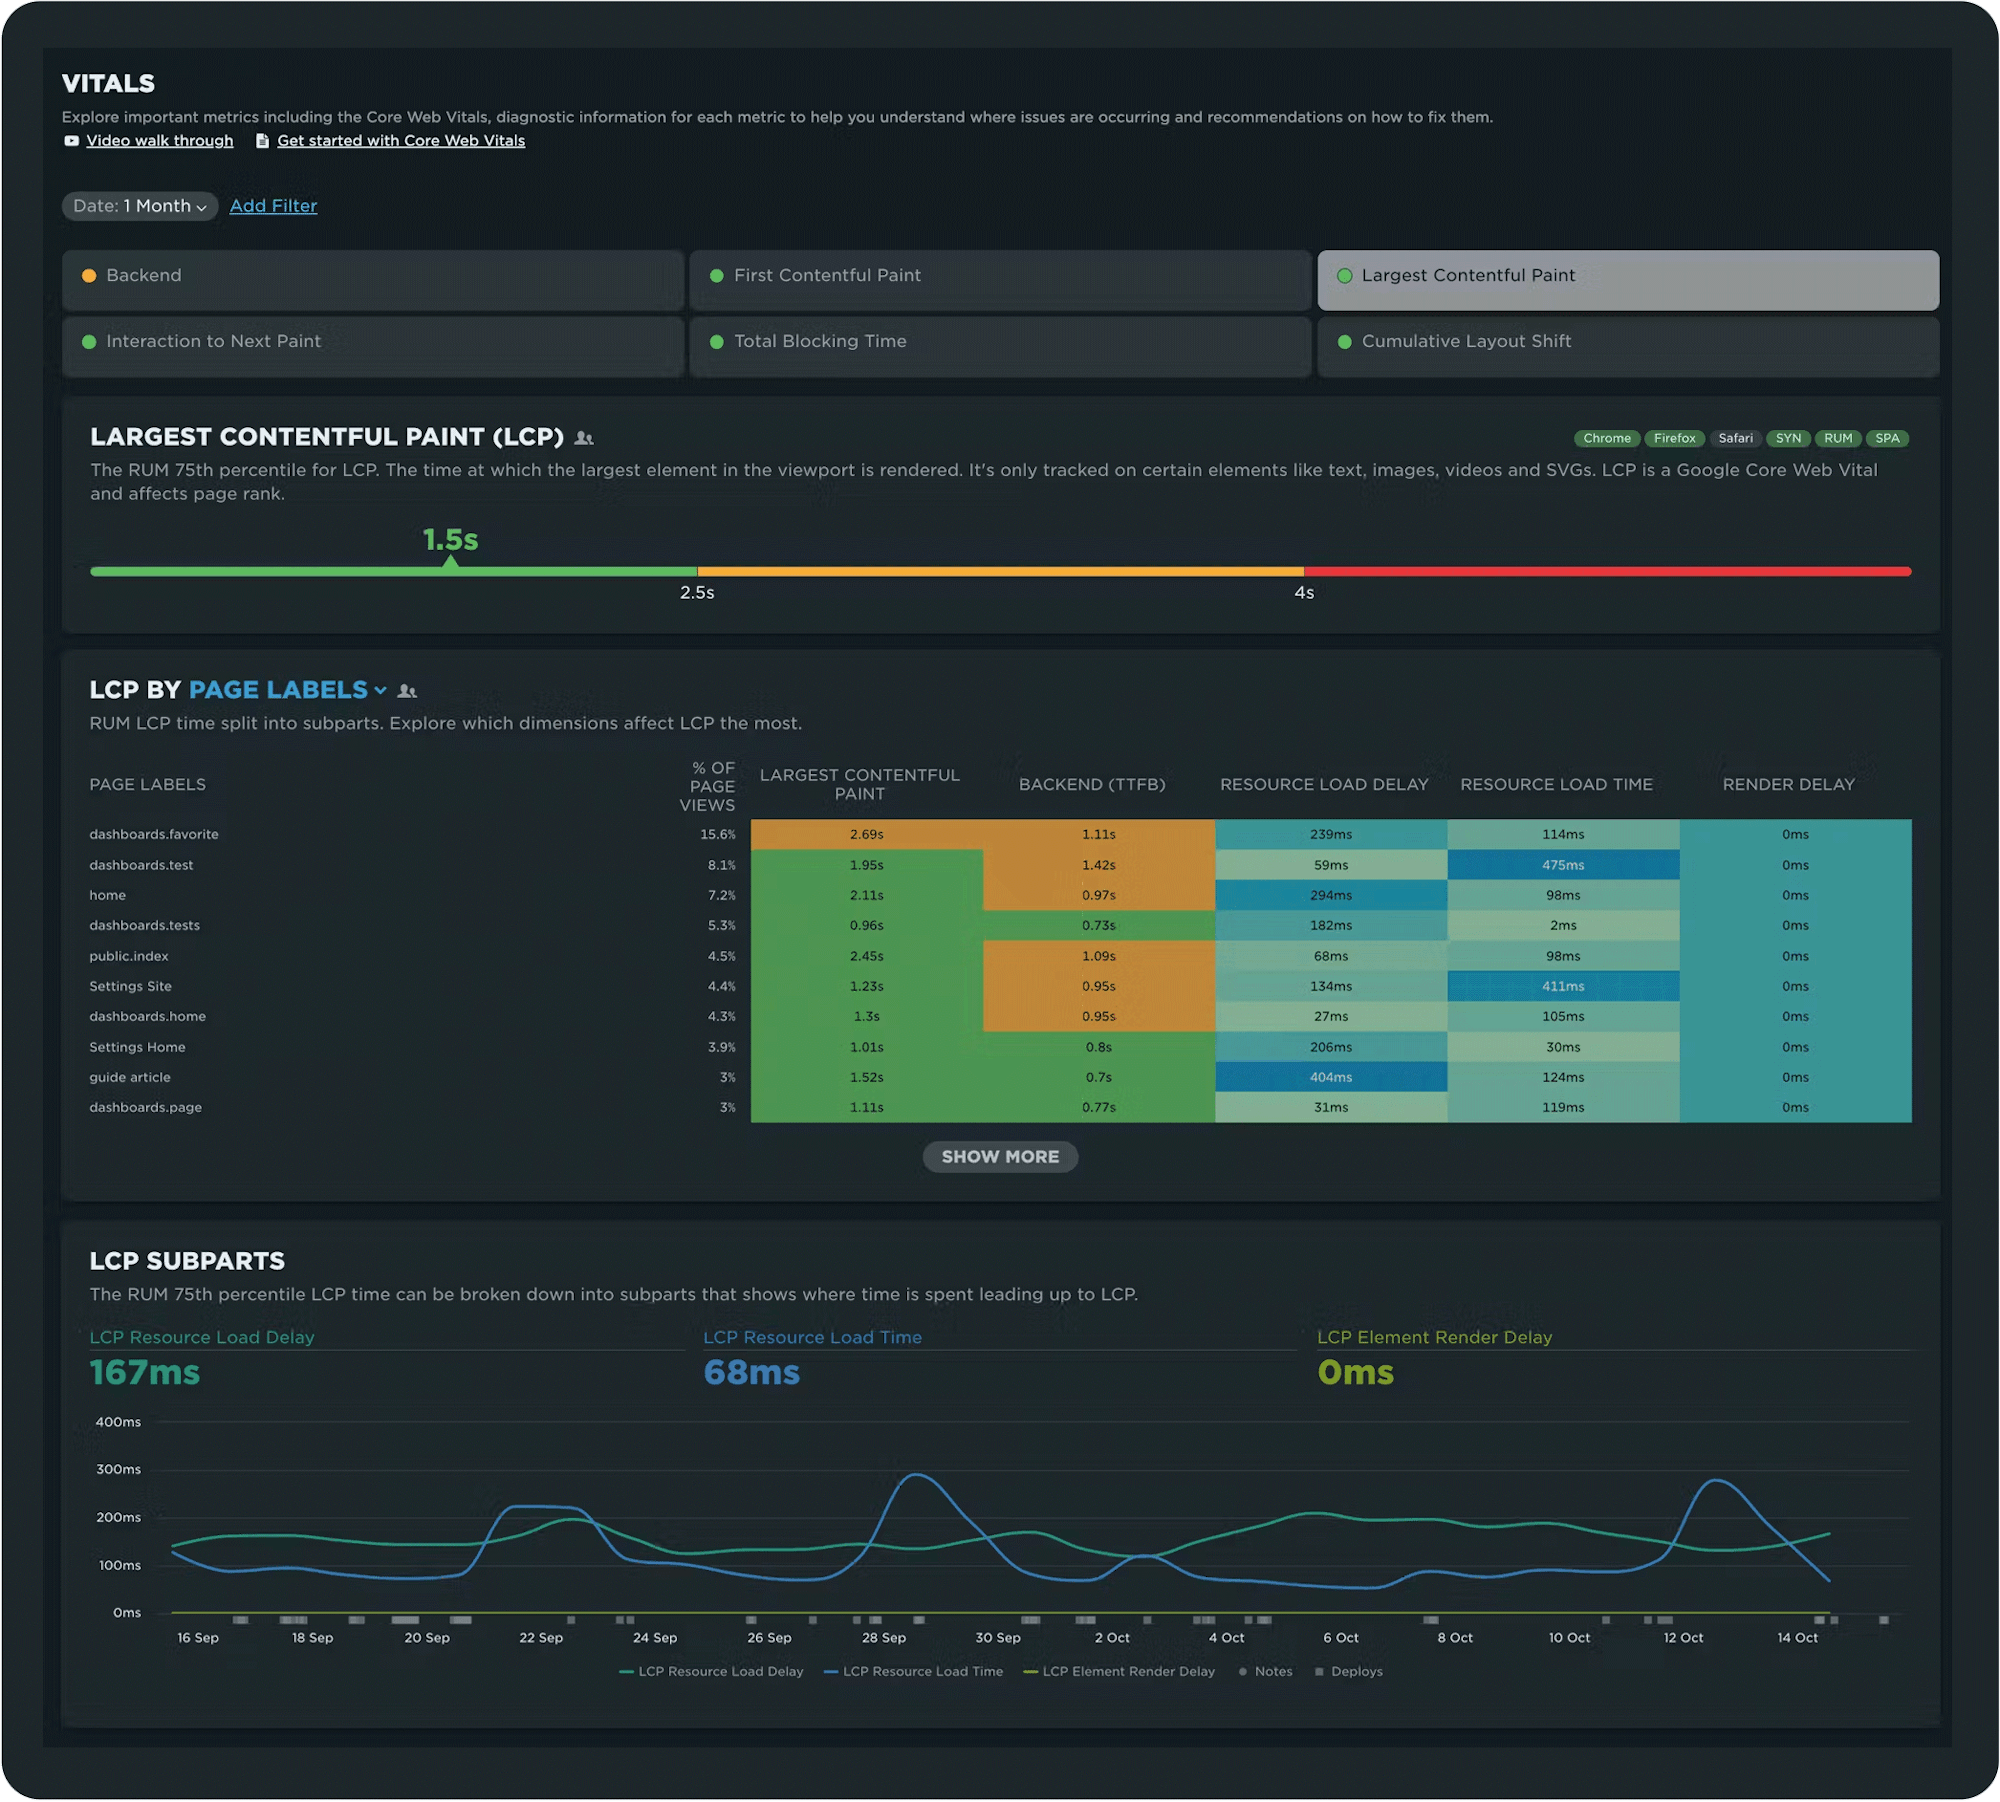
Your Vitals dashboard gives you:
- A quick snapshot of how your entire site performs across Google's Core Web Vitals (LCP, INP, and CLS) as well as other important metrics, like Backend Time, First Contentful Paint, and Total Blocking Duration
- Spot issues faster with heatmaps that can be filtered by page, browser, location, and device type
- Quickly drill down into performance hot spots and get deeper session- and page-level diagnostics, including subparts for INP and LCP
- See warnings when data samples are too small to be meaningful, so you can focus on real issues, not red herrings
Read: Get Started with Core Web Vitals
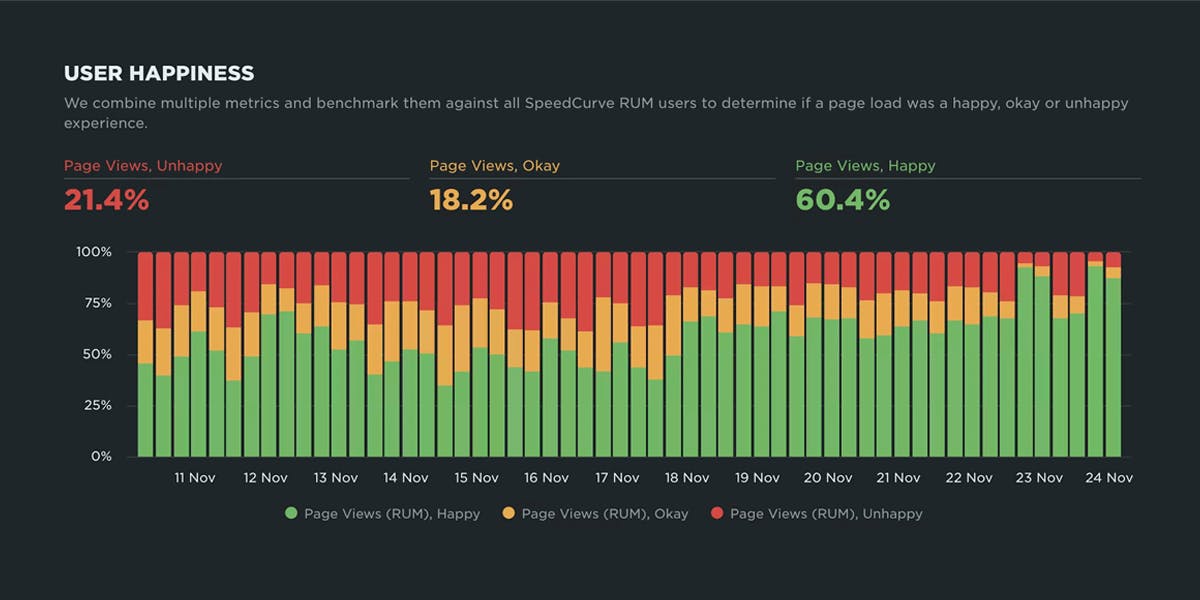
User Happiness update
We pioneered User Happiness six years ago, when a number of our customers asked us if there was a RUM equivalent to the synthetic Lighthouse score. In other words, what they wanted was a single *non-technical* UX metric that everyone in their company could rally around.
With that in mind, our own Steve Souders developed an algorithm that took into account a number of key user-focused metrics, and the User Happiness metric was born.
Six years later, User Happiness was in need of a refresh, to reflect new metrics (including changes to Core Web Vitals) and browser evolution. SpeedCurve engineer extraordinaire Joseph Wynn led this project, and earlier this month we were excited to announce our new User Happiness metric to the world!
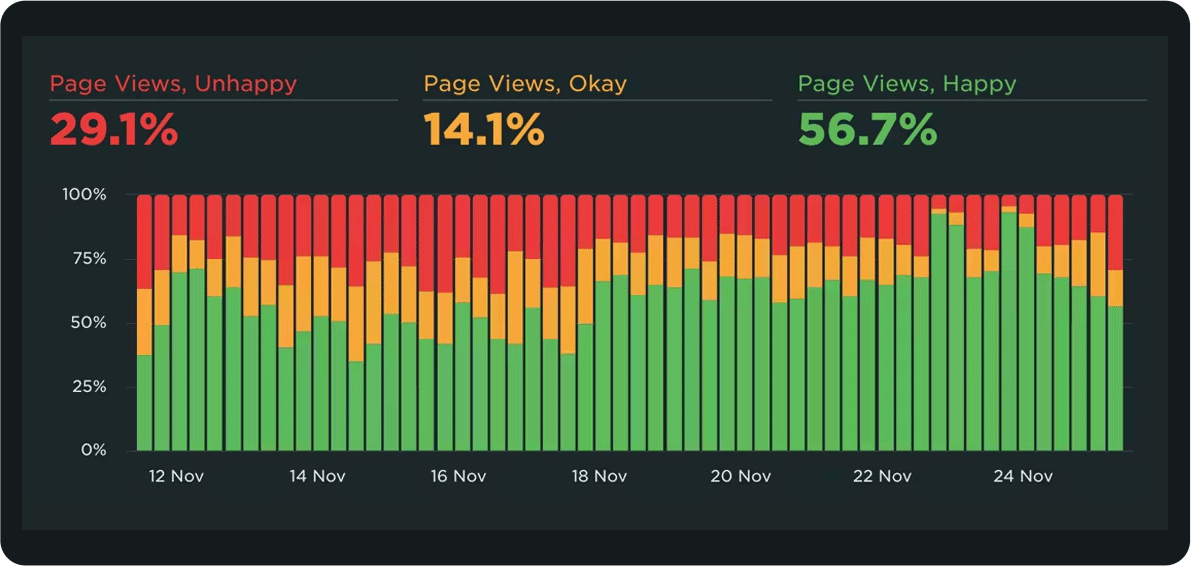
Benefits of tracking User Happiness:
- Easy to see how many of your page views at any given time are happy, okay, or unhappy
- Easier to communicate about performance with non-technical stakeholders
- Set up performance budgets and alerts, so you know if more of your users are suddenly unhappy
- See how User Happiness changes over time
- Drill down into underlying causes of user unhappiness (so you can fix them!)
Heat maps in your Favorites
This is one of the most-requested features we've ever had, and we were so excited to deliver! We added the ability to create heat maps to your Favorites (custom) dashboards.
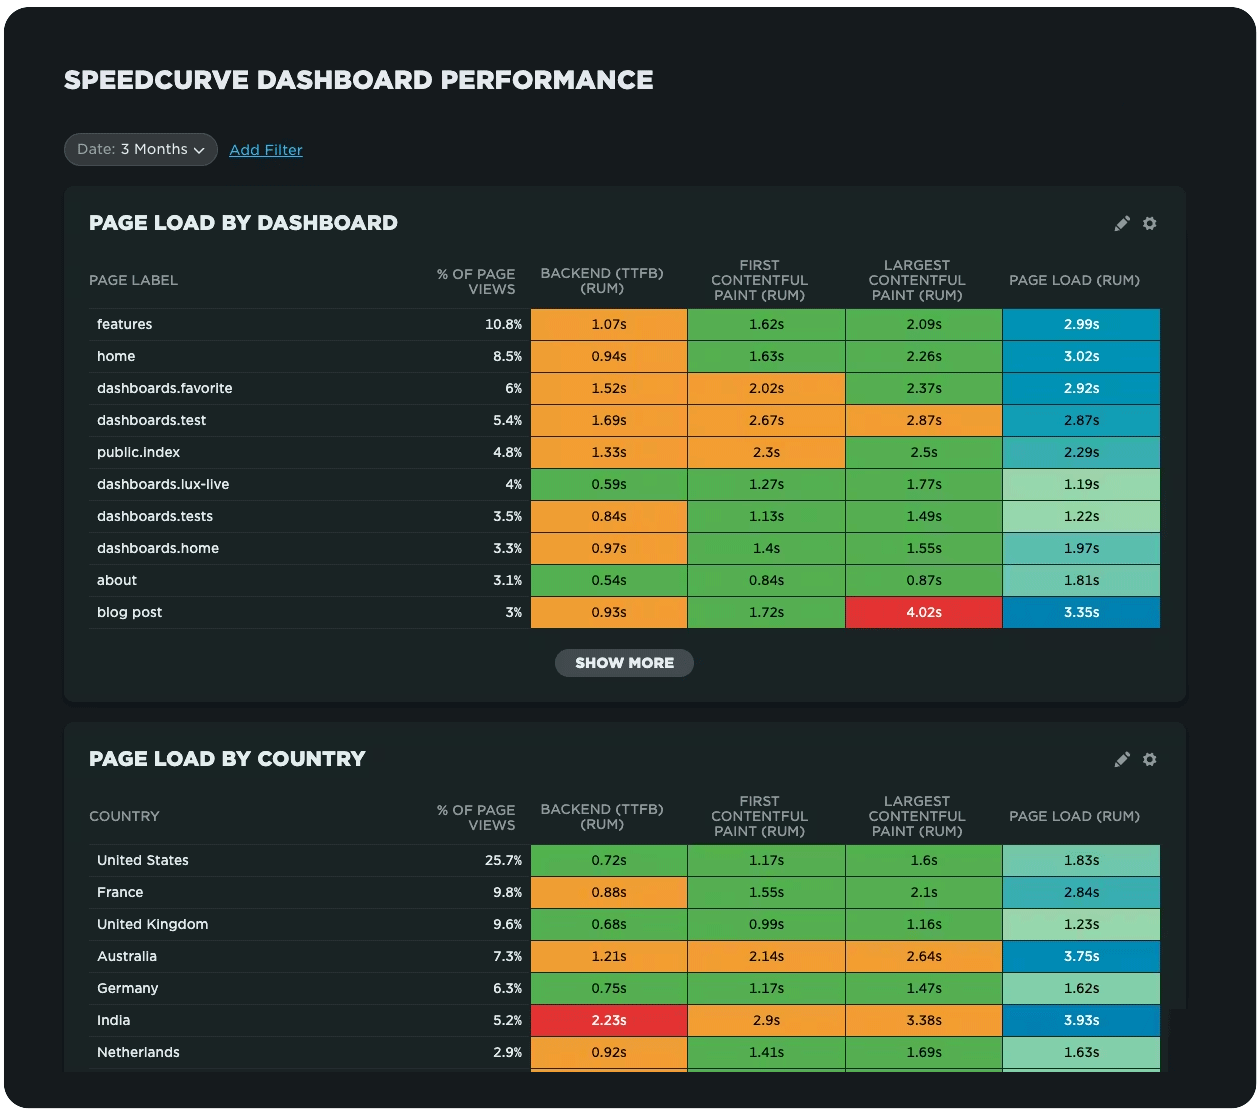
Heat maps are a powerful way to get an instant overview of where performance issues are hiding across your site. They let you break down your performance metrics (including custom metrics) by different dimensions — including page label, browser, location, and device type — so you can easily spot anomalies and patterns in your web performance data.
Easier RUM for your Shopify store
We have our friend Sia Karamalegos to thank for this awesome integration. If you have a Shopify storefront and you're already using SpeedCurve Synthetic, now you can add SpeedCurve RUM to your Shopify store in minutes, right from the Shopify App Store. No coding or theme editing required!
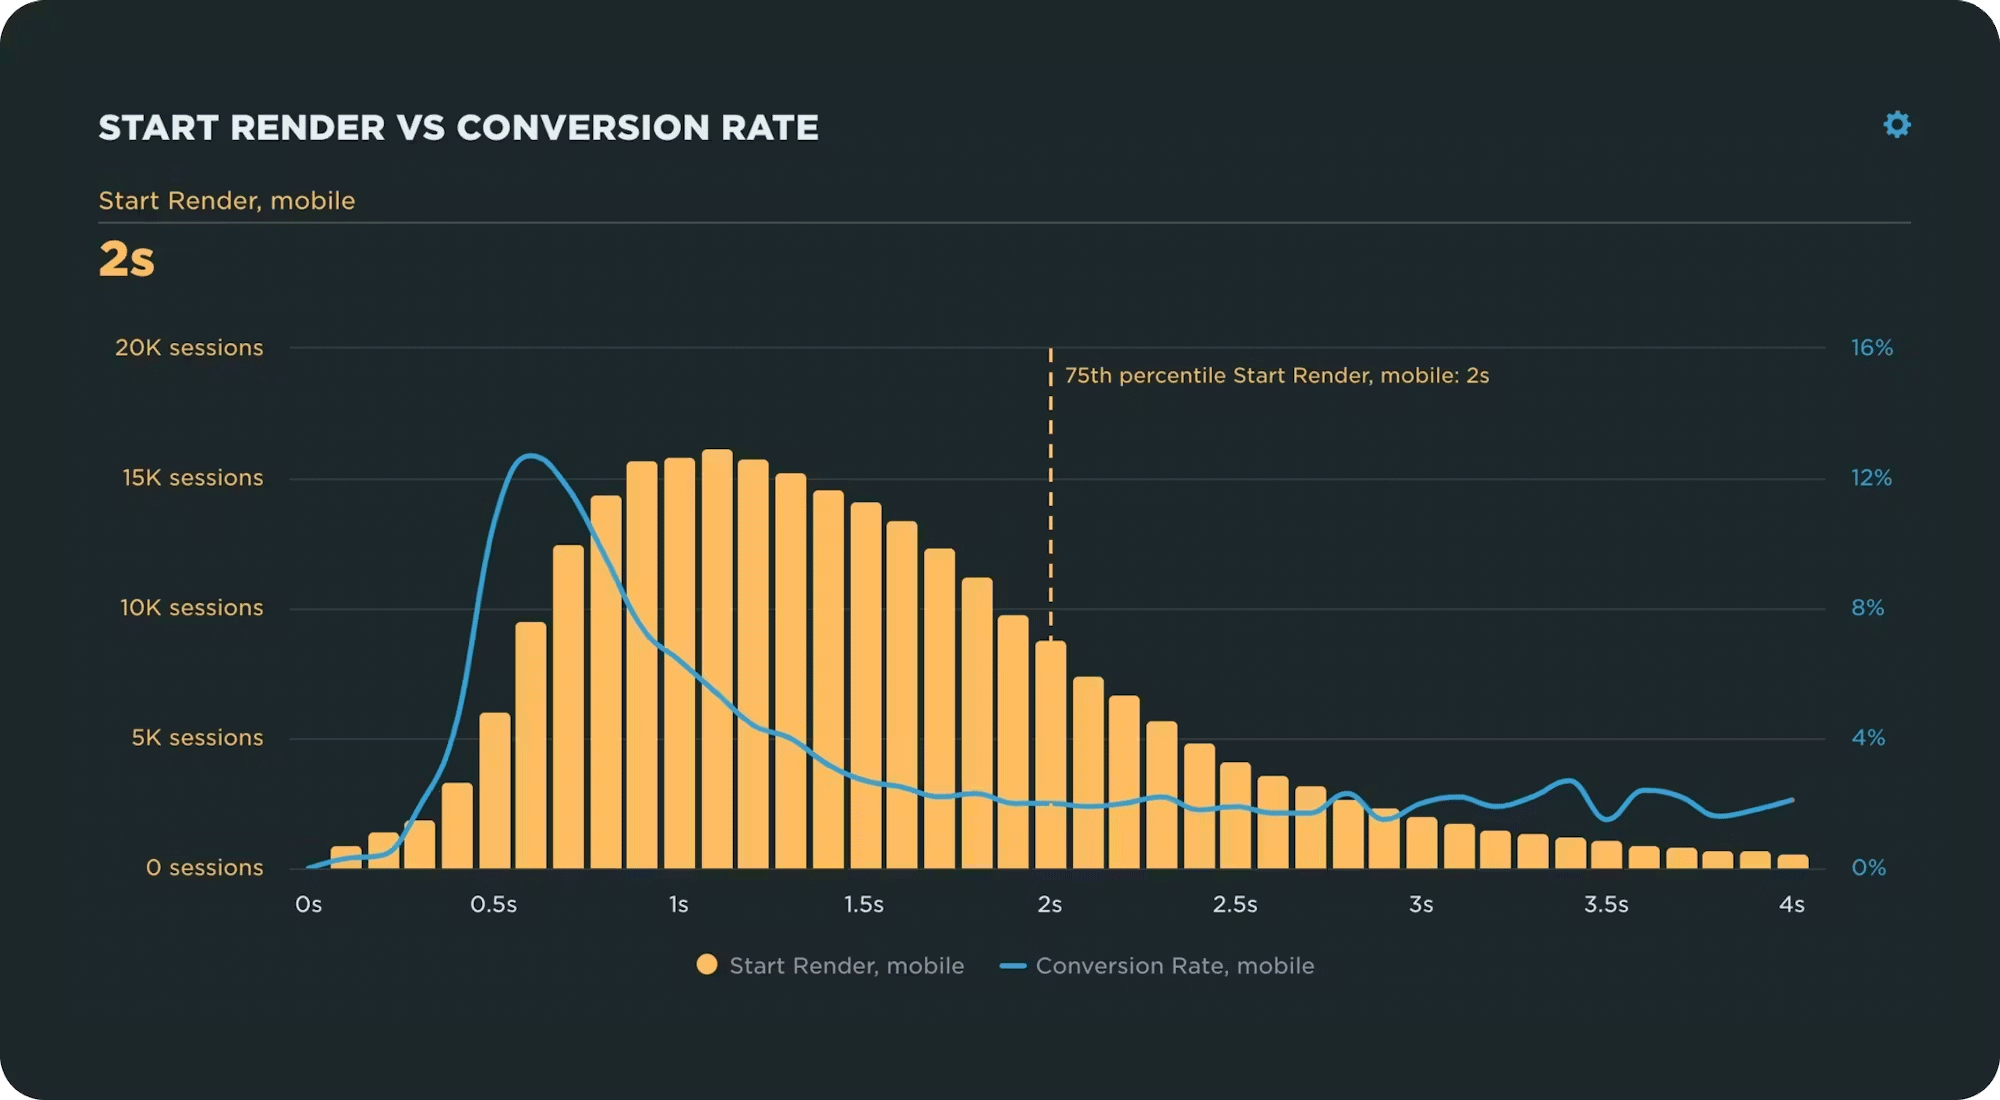
With RUM, you can do things like:
- Monitor Core Web Vitals
- Measure the impact of slow pages on your business (such as the correlation chart pictured above, which shows how conversion rate gets worse as pages get slower)
- Investigate RUM sessions to find anomalies
- Fight regressions with performance budgets and alerts
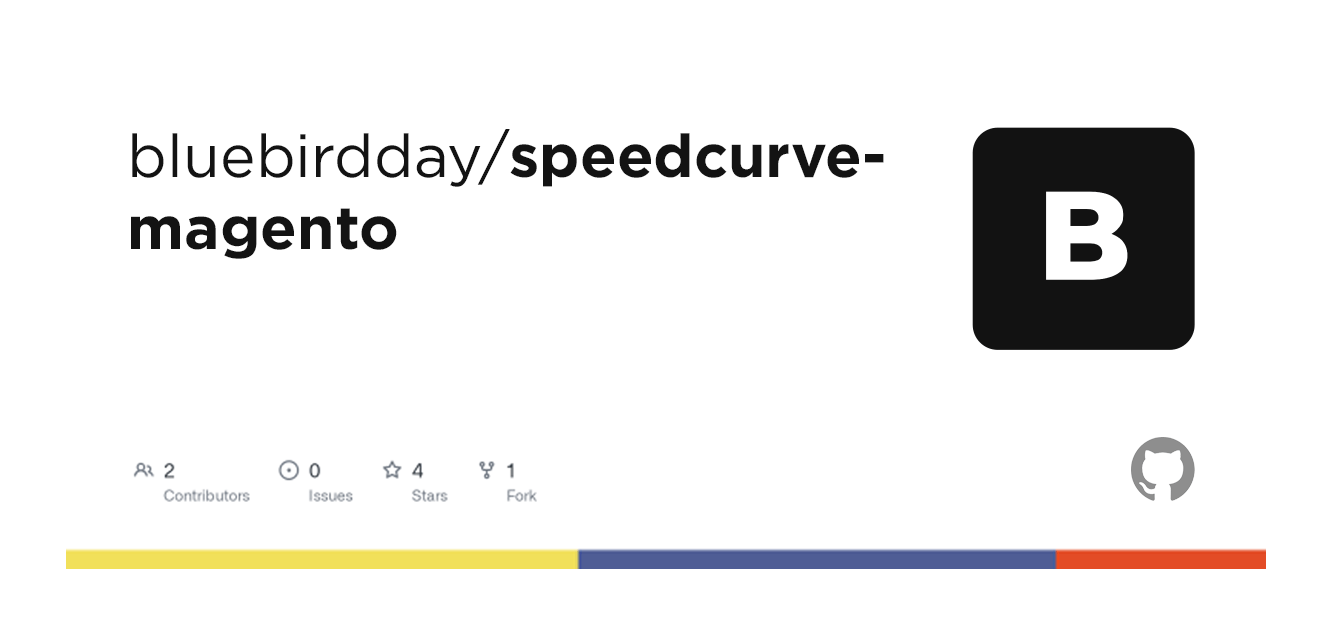
Easier RUM for your Magento project, too!
There are few things more flattering than having our users build apps that empower other folks to use our tools. The credit for building this much-appreciated module goes to Jesper Ingels and the rest of the team at Bluebird Day. With their SpeedCurve RUM module for Magento, you can integrate real user monitoring into your Magento project in minutes.
With this module, you can:
- Enter your SpeedCurve RUM ID (available on your Settings page) and the RUM script loads automatically on your pages
- Configure all settings via the Magento Admin Panel, including RUM ID, page labels, and cookie consent handling
- Manage page labels for product and category pages
- Insert the RUM script only after the visitor accepts cookies (privacy-proof!)
- Immediately start tracking Core Web Vitals and other critical RUM metrics
- Measure the impact of page slowdowns on your business
- Fight regressions with performance budgets and alerts
- Get detailed recommendations for fixing performance issues
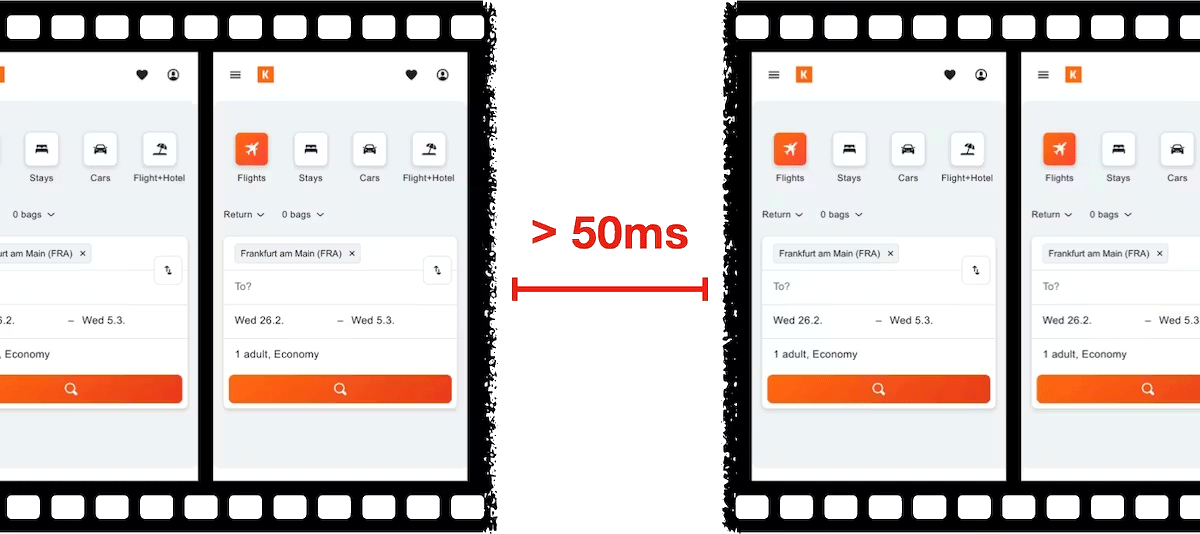
Monitor LoAFs and get to the bottom of JS issues
With Long Animation Frames (LoAFs), we finally have a way to understand the impact of code on the user experience. Earlier this year, we added the ability to monitor Long Animation Frames and get diagnostics to fix the third parties and other scripts that are hurting your page speed and user experience.
Despite the complexity that comes with measuring script-related performance in the field, our LoAF monitoring is straightforward:
- New metrics, including Total Blocking Duration, available throughout your dashboards
- Helpful new data visualizations in three of your dashboards
- Extremely valuable new visualization in your RUM waterfall
Read: The Definitive Guide to Long Animation Frames
Simplified performance budgets
Last summer we made a major update to how you create, manage, and monitor performance budgets.
Our new Budgets dashboard gives you:
- Centralized budget management
- Easier navigation and filtering
- Custom labels and descriptions to give more context at a glance
- Improved budget types
- Visualizations for rate of change budgets
- Alert history and audit history
Read: A Complete Guide to Web Performance Budgets
Waterfalls and the critical rendering path
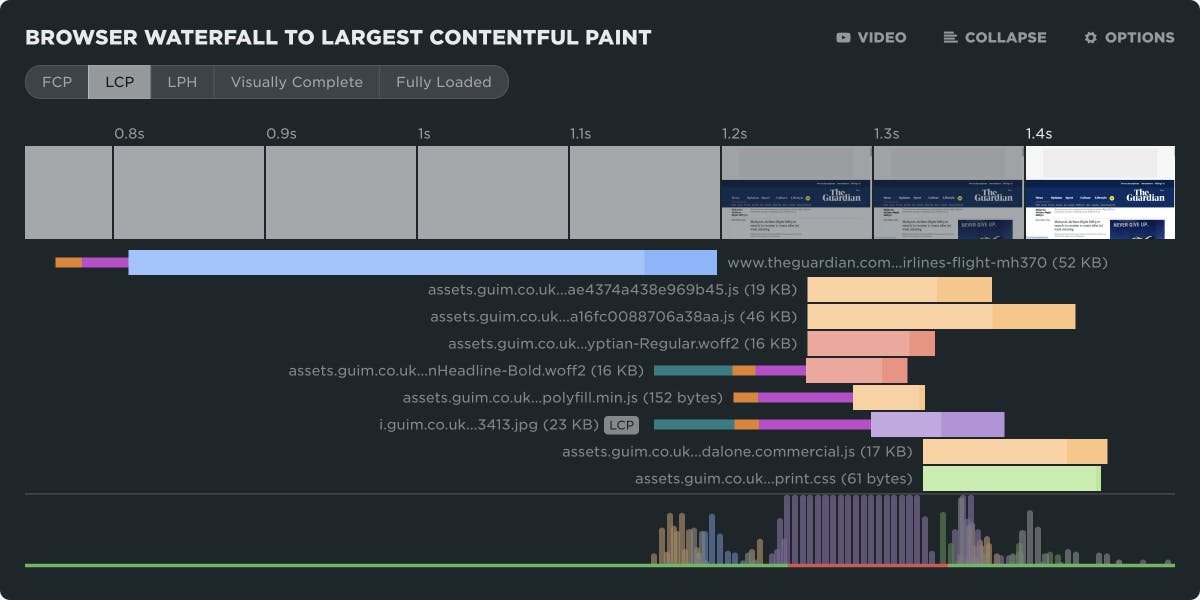
When I talk with folks about performance, I stress the importance of focusing on what matters. (In fact, I did an entire talk about this at the performance.now conference a couple of years ago.) The first step is identifying the critical rendering path for your pages. Our revamped waterfall chart lets you do exactly that.
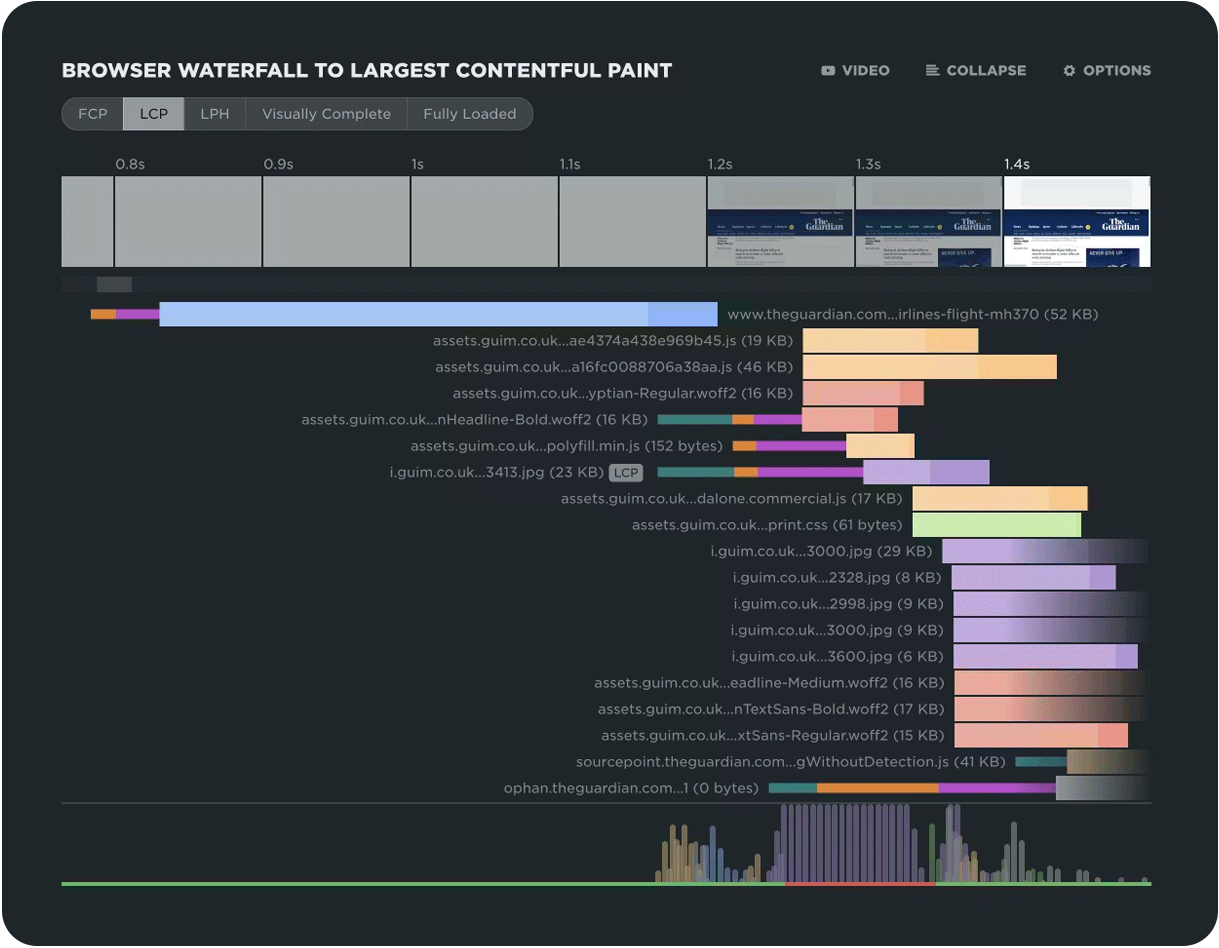
Waterfall charts are an essential tool in your diagnostics kit. They let you see at a glance the number of resources on a page, the size and type of each resource, when each resource is called, whether or not it's a blocking resource, how long it takes to render, plus a wealth of deeper metrics around CDN, caching, and more!
Our newly updated waterfall has been in the works for a while, and it's a culmination of wish lists from our team. Now it's easier for you to:
- Focus on seeing and optimizing the critical rendering path, to deliver a better experience to your users
- Spot the Largest Contentful Paint (LCP) element, so you can see if it's rendering too late
- Differentiate between connection state and rendering state for each resource
- Go deep into each resource request to diagnose the root cause of a performance issue
As someone who uses waterfalls every day to diagnose issues for SpeedCurve customers, I'm so excited to have this feature at my fingertips!
Real user monitoring for SPAs
Measuring pages in a single-page application (SPA) requires a little extra work, because the start and end time of a page vary depending on the SPA's implementation. In September, we made that implementation a lot easier. New LUX.spaMode greatly simplifies implementing lux.js in a SPA.
Easier user permissions
I love it when new SpeedCurve customers ask me how many end users they're allowed to add to their account, because I get to say "As many as you'd like!" We don't charge per seat and we don't limit account users.
While that's great news for our customers, over time — as you add more and more teams and users to your account (we have some customers with hundreds of end-users!) — managing everyone's permissions can get unwieldy. So we made it easier. You can now manage individual user permissions across multiple teams on the same page.
 (Credit to Elena Kay for this awesome screenshot!)
To change user access across multiple teams at once:
- Go to Admin > Users (requires Org Admin permissions)
- Click on the username
- Choose team permissions for this user
- Click 'Save permissions'
Read: How to add and edit users, admins, and teams
SpeedCurve is now part of Embrace!
If you missed the news, SpeedCurve was acquired by Embrace in November! Embrace is a leader in user-focused observability, so we’re combining forces to connect performance, reliability, and user experience across both web and mobile apps.

One of the many things I've loved about joining forces with Embrace has been learning how the observability space dovetails with front-end web performance, and how we approach the idea of user-focused monitoring. It's super-interesting seeing how other folks interpret this. I've already learned a lot, and I know it's just the tip of the iceberg.
Big love to our extended web performance community
Whew, that was a lot... and those were just the highlights!
I'm so proud of everyone in our community — not just SpeedCurve, but also our customers, the hard-working browser teams, and the other vendors in our space — who collectively work together to make the web better, faster, and more reliable.
I truly believe that our community is driven by a shared desire to serve users. It's what keeps me inspired year after year. I'm already looking forward to what we'll achieve together in 2026!