Understanding the performance impact of anti-flicker snippets

Experimentation tools that use asynchronous scripts – such as Google Optimize, Adobe Target, and Visual Web Optimizer – recommend using an anti-flicker snippet to hide the page until they've finished executing. But this practice comes with some performance measurement pitfalls:
- Hiding the contents of the page can have a dramatic effect on the Web Vitals that measure visual experience, such as First Contentful Paint (FCP) and Largest Contentful Paint (LCP)
- Anti-flicker snippets can also affect Cumulative Layout Shift (CLS) and the synthetic equivalent of First Input Delay (FID), Total Blocking Time (TBT).
In this post we'll look at how anti-flicker snippets work, their impact on Web Vitals, and how to measure the delay they add to visitors' experience.

Hiding the page contents
Normally web pages are rendered progressively. As browsers start to receive content, they can layout and render page elements and display the content bit by bit.
Anti-flicker snippets hide the contents of a page until the the experimentation tool (e.g. Google Optimize) has finished applying its experiments. The hypothesis is that if a visitor sees the page changing, it may influence how they behave – either because they had an unpleasant experience or simply because they became aware that they're in an experiment.
But as you can see in these filmstrips of Wiggle, a UK cycling retailer, hiding the page can have a dramatic impact on a visitor's experience:

Comparison of a site loading with (top) and without (bottom) the anti-flicker snippet enabled
The test in top row has the anti-flicker snippet in place. The content is displayed 'all at once' when the anti-flicker snippet reveals the page.
The test in the bottom row has the anti-flicker snippet removed. The page loads progressively, with the menu and logo appearing about 1.5s before the hero image. The anti-flicker snippet delayed showing the content for two seconds.
These tests were over a fast network connection, so First Contentful Paint and Last Contentful Paint happened simultaneously. On slower connections, however, there is a gap between FCP and LCP – and some progressive rendering – but FCP still won't start until the anti-flicker snippet finishes.
(I chose Wiggle semi-randomly after searching the HTTP Archive for sites that use Google Optimize.)
Effects on other Web Vitals
Anti-flicker snippets can affect other Web Vitals, too:
- Decrease in Total Blocking Time – TBT is a synthetic monitoring metric that measures how long JavaScript and others tasks prevent the page from handling user interaction. It starts measuring at First Contentful Paint (FCP) and stops at Time to Interactive (TTI). As anti-flicker snippets delay FCP, then the window for measuring the Long Tasks gets smaller, which means you may see a decrease in TBT.
- Lower Cumulative Layout Shift score – CLS measures how much content moves around on the page. If some of this movement happens while the page is hidden, then the CLS score will be lower.
To summarize: On one hand, anti-flicker snippets make metrics such as FCP (and possibly LCP) worse. On the other hand, they can appear to improve TBT and CLS.
My instinct is that showing content to the visitor sooner may be a higher priority than the incidental TBT or CLS boost. But rather than trust my instincts, we should measure the impact of hiding the page. To do that, we need to understand a little about how the snippets work.
How anti-flicker snippets work
Anti-flicker snippets typically add a style with opacity: 0 to the elements to be hidden. In Google Optimize's default case is the whole document.
The (un-minified) Optimize snippet below declares the .async-hide class in a style block, and then applies it to the document using a script. It also defines a function to remove the class and sets a timer to call this function after four seconds.
The .async-hide class will either be removed when Google Optimize finishes applying its variants or when the timeout value is reached. In the example below, FCP can be delayed by up to four seconds (the default in the snippet example).
<!-- anti-flicker snippet for Google Optimize (recommended) -->
<style>
.async-hide {
opacity: 0 !important
}
</style>
<script>
(function(a, s, y, n, c, h, I, d, e) {
s.className += ' ' + y;
h.start = 1 * new Date;
h.end = I = function() {
s.className = s.className.replace(RegExp(' ?' + y), '')
};
(a[n] = a[n] || []).hide = h;
setTimeout(function() {
I();
h.end = null
}, c);
h.timeout = c;
}
)(window, document.documentElement, 'async-hide', 'dataLayer', 4000, {
'GTM-XXXXXX': true
});
</script>
If you'd like to understand the snippet in more detail, there's an annotated version in this Optimize support article: Using the Optimize anti-flicker snippet | Google Developers
As a fallback, four seconds is a long time. Based on the Chrome UX Report thresholds, a page needs to display the Largest Contentful Paint element within 2.5s for it to be considered good.
Not every visitor may reach that timeout. For some visitors the experiments may complete soon enough to avoid it.
How often the snippet reaches the timeout will depend on factors like:
- the number of experiments,
- how long the experiments take to execute,
- what device the visitor is using, and
- the speed of the network the device is connected to.
If we measure how long the page is hidden, we can start to understand how Optimize affects our visitors experiences, the range of delays it adds, and how it influences visitor behaviour.
Measuring how long the page is hidden
Unfortunately, Google Optimize – like most third-party tags – doesn't expose any timing information for its key milestones (page hidden, page shown), but there are still ways we can measure them.
1. Update the Optimize anti-flicker snippet to include performance marks and measures
A start mark is recorded just before the hide class is added, and then when the class is remove an end mark, and duration measure are recorded.
<!-- anti-flicker snippet for Google Optimize (recommended) -->
<style>
    .async-hide {
        opacity: 0 !important
    }
</style>

<script>
    (function(a, s, y, n, c, h, I, d, e) {
        performance.mark('anti-flicker-start');

        s.className += ' ' + y;
        h.start = 1 * new Date;
        h.end = I = function() {
            s.className = s.className.replace(RegExp(' ?' + y), '')
            performance.mark('anti-flicker-end');
            performance.measure('anti-flicker-duration', 'anti-flicker-start', 'anti-flicker-end');
        };
        (a[n] = a[n] || []).hide = h;
        setTimeout(function() {
            I();
            h.end = null
        }, c);
        h.timeout = c;
    }
    )(window, document.documentElement, 'async-hide', 'dataLayer', 4000, {
        'GTM-XXXXXX': true
    });
</script>
Editing the predefined snippet might be a bit fragile, as in the future someone might not notice it's been customised and overwrite it with the default version.
2. Create a second snippet that uses a MutationObserver to detect when the async-hide class is removed from the document
This is probably more sustainable as it's less prone to being overwritten.
(function (node, selector, name) {

    performance.mark(name + '-start');

    const callback = function (mutationsList, observer) {

        // Use traditional 'for loops' for IE 11 support
        for (const mutation of mutationsList) {

            if (mutation.attributeName === 'class' &&
                !mutation.target.classList.contains(selector) &&
                mutation.oldValue.includes(selector)) {

                    performance.mark(name + '-end');
                    performance.measure(name + '-duration', name + '-start', name + '-end');

                    observer.disconnect();
                    break;
            }
        }
    }

    const observer = new MutationObserver(callback);
    observer.observe(node, { attributes: true, attributeOldValue: true });

})(document.documentElement, 'async-hide', 'anti-flicker');
This measurement snippet should be placed immediately after Google Optimize's anti-flicker snippet. It creates a mark when it runs, and then another when the class is removed from the document. It also creates a measure to record how long the page was hidden for.
The snippet takes three parameters:
- the element that's being hidden,
- the name of the class used to hide it, and
- a prefix for the name of the marks and measures.
The first two must match their equivalents in the anti-flicker snippet.
A similar measuring approach can be used for Adobe Target and VisualWebOptimizer. There are example snippets for these in our support docs: Custom metrics for anti-flicker snippets
Using the data
Once the snippet is installed on the page and the User Timing metrics configured in SpeedCurve, they can be included in dashboard charts. For example, you can create a correlation chart in RUM to plot how bounce rate is affected by the length of time page is hidden for.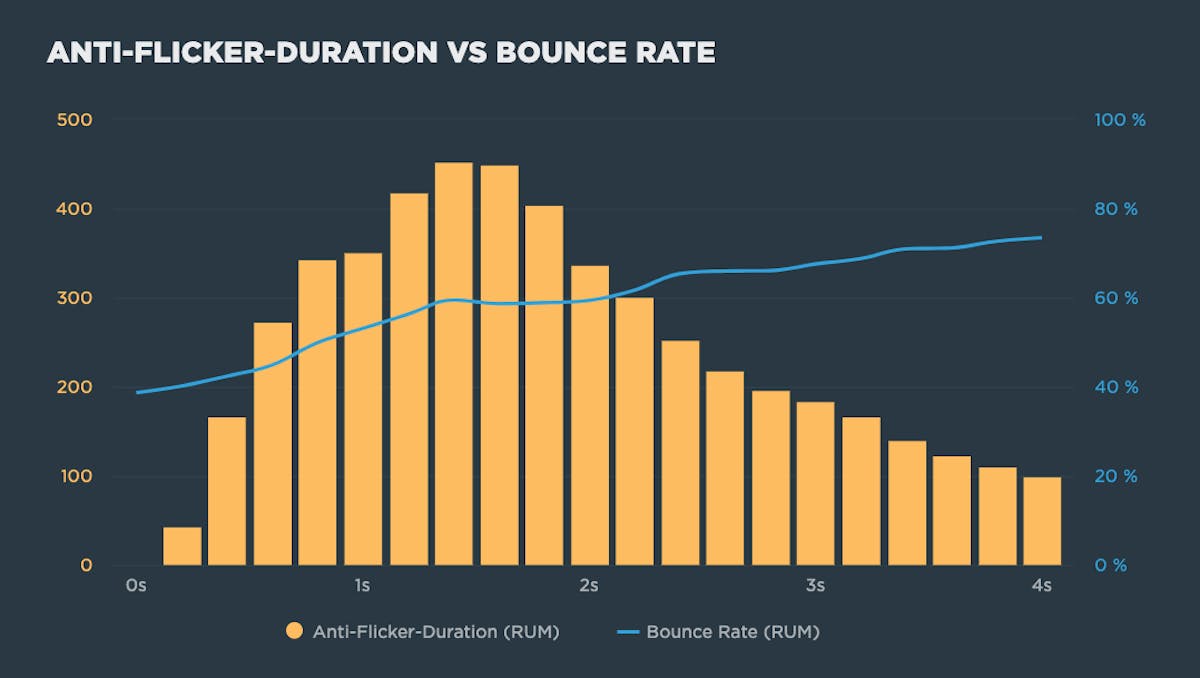
Correlation chart showing relationship between bounce rate and how long the page is hidden
In this example, the chart shows the bounce rate increasing when the page is hidden for longer durations. It also shows that some visitors are waiting four seconds before the see any content!
Measuring how long the page is hidden opens up opportunities to get a better understanding of how this wait time affects our visitors' experience. We can use the RUM Sessions dashboard to identify and explore which visitors are being affected by slow Optimize experiments. We can experiment with reducing the timeout so that visitors won't see a blank screen for as long. Or if we recorded which variant the visitor was seeing via RUM's custom data API, we could see which experiments took the longest to execute.
(While testing the snippet, I discovered a common third-party reviews service was corrupting the duration measure, so in some cases you may need to switch to using the anti-flicker end mark instead)
Summary
Managing the performance of third-party tags is a key aspect of delivering great web experiences. Unfortunately, the performance of third-party tags can be pretty opaque. In an ideal world, tag vendors would use marks and measures to help us understand how their tags behave in the field, but until they do, browser APIs such as MutationObserver and User Timing can help us to measure some aspects of them.
If you've got other third-party tags that you'd like help with measuring, or if you try out one of the snippets for measuring anti-flicker snippets, we'd love to hear from you.