NEW! SpeedCurve RUM for your Shopify store

If you run a Shopify store, you already know how critical it is to provide a seamless shopping experience. That's why I was so excited when the folks at SpeedCurve asked me to draw on my Shopify experience to build their new RUM app for Shopify storefronts. Now I'm here to let you know how it works and why it's an important part of your UX toolset.
In ecommerce, speed isn’t just nice to have – it’s a competitive advantage. Slow websites lead to frustrated users, lost sales, and damaged brand trust.
With the SpeedCurve RUM app, you can track metrics like Core Web Vitals, identify performance issues, measure the impact of site speed on conversion rates, and stay ahead of page slowdowns – no coding required.
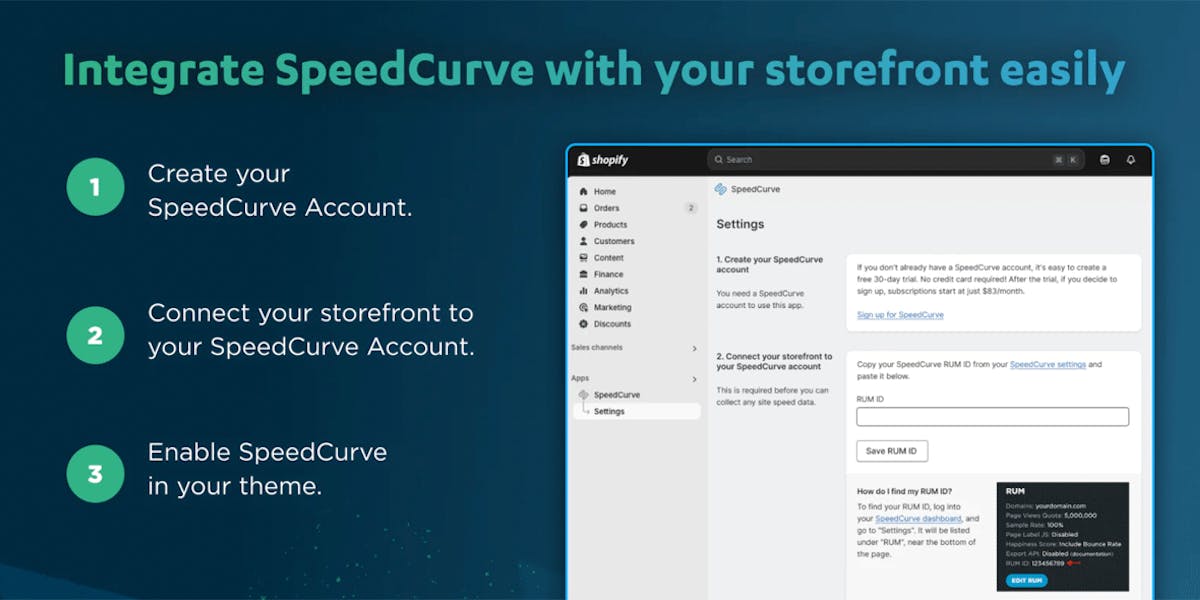
> How to enable SpeedCurve RUM in your Shopify store
Site speed is critical in ecommerce
Before we dig into the new SpeedCurve RUM details, let’s cover why front-end web performance is so important for online stores.
Poor performance increases bounce rate
Shoppers are impatient. A delay of just one or two seconds can cause potential customers to abandon your site.
In the SpeedCurve correlation chart below, we can see that when websites take longer to start showing content in the browser (AKA Start Render), users are more likely to bounce. Lower bounce rates mean more opportunities to convert.
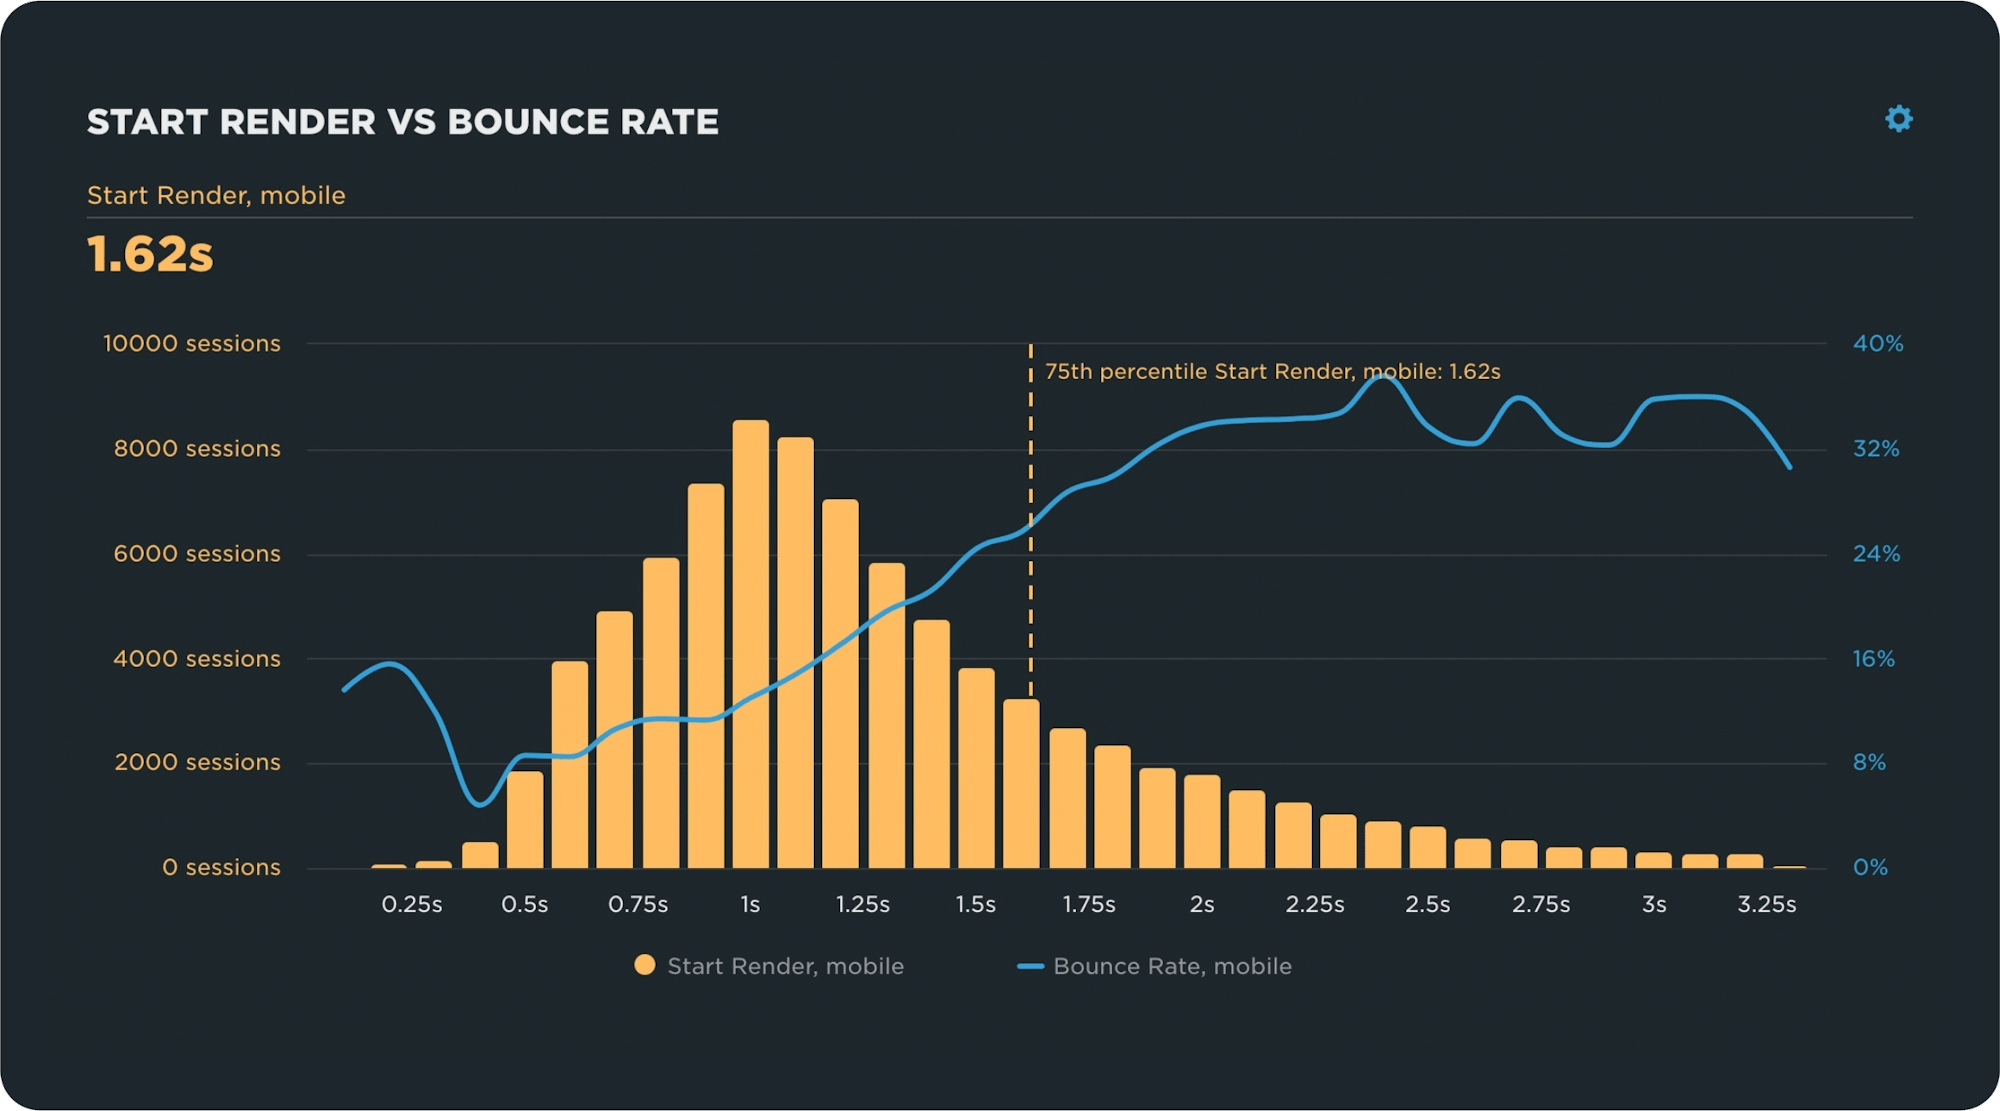
For this data set of visits from mobile users, bounce rate is lowest (5%) when render starts within 0.4 seconds. It climbs almost linearly until 2.5 seconds, which has a 38% bounce rate.
Poor performance decreases conversions
Performance improvements directly correlate with sales. For example:
“Carpe improved Largest Contentful Paint by 52% and Cumulative Layout Shift by 41% and saw a 10% increase in traffic, a 5% increase in online store conversion rate, and a 15% increase in revenue.”
~ Mateusz Krzeszowiak, Web Performance Technical Architect at Shopify (source)
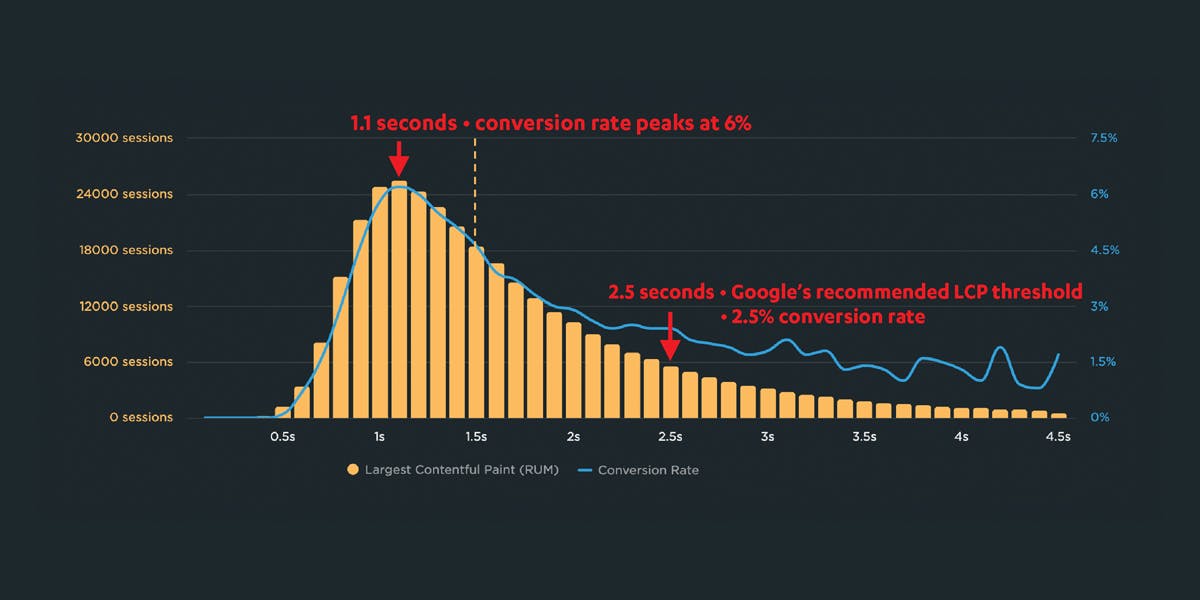
Speed isn’t just about improving user experience. It’s about increasing conversions, and ultimately revenue. This SpeedCurve correlation chart shows conversion rate peaking at a start render time of 0.6 seconds. As user sessions get slower, conversions decline.
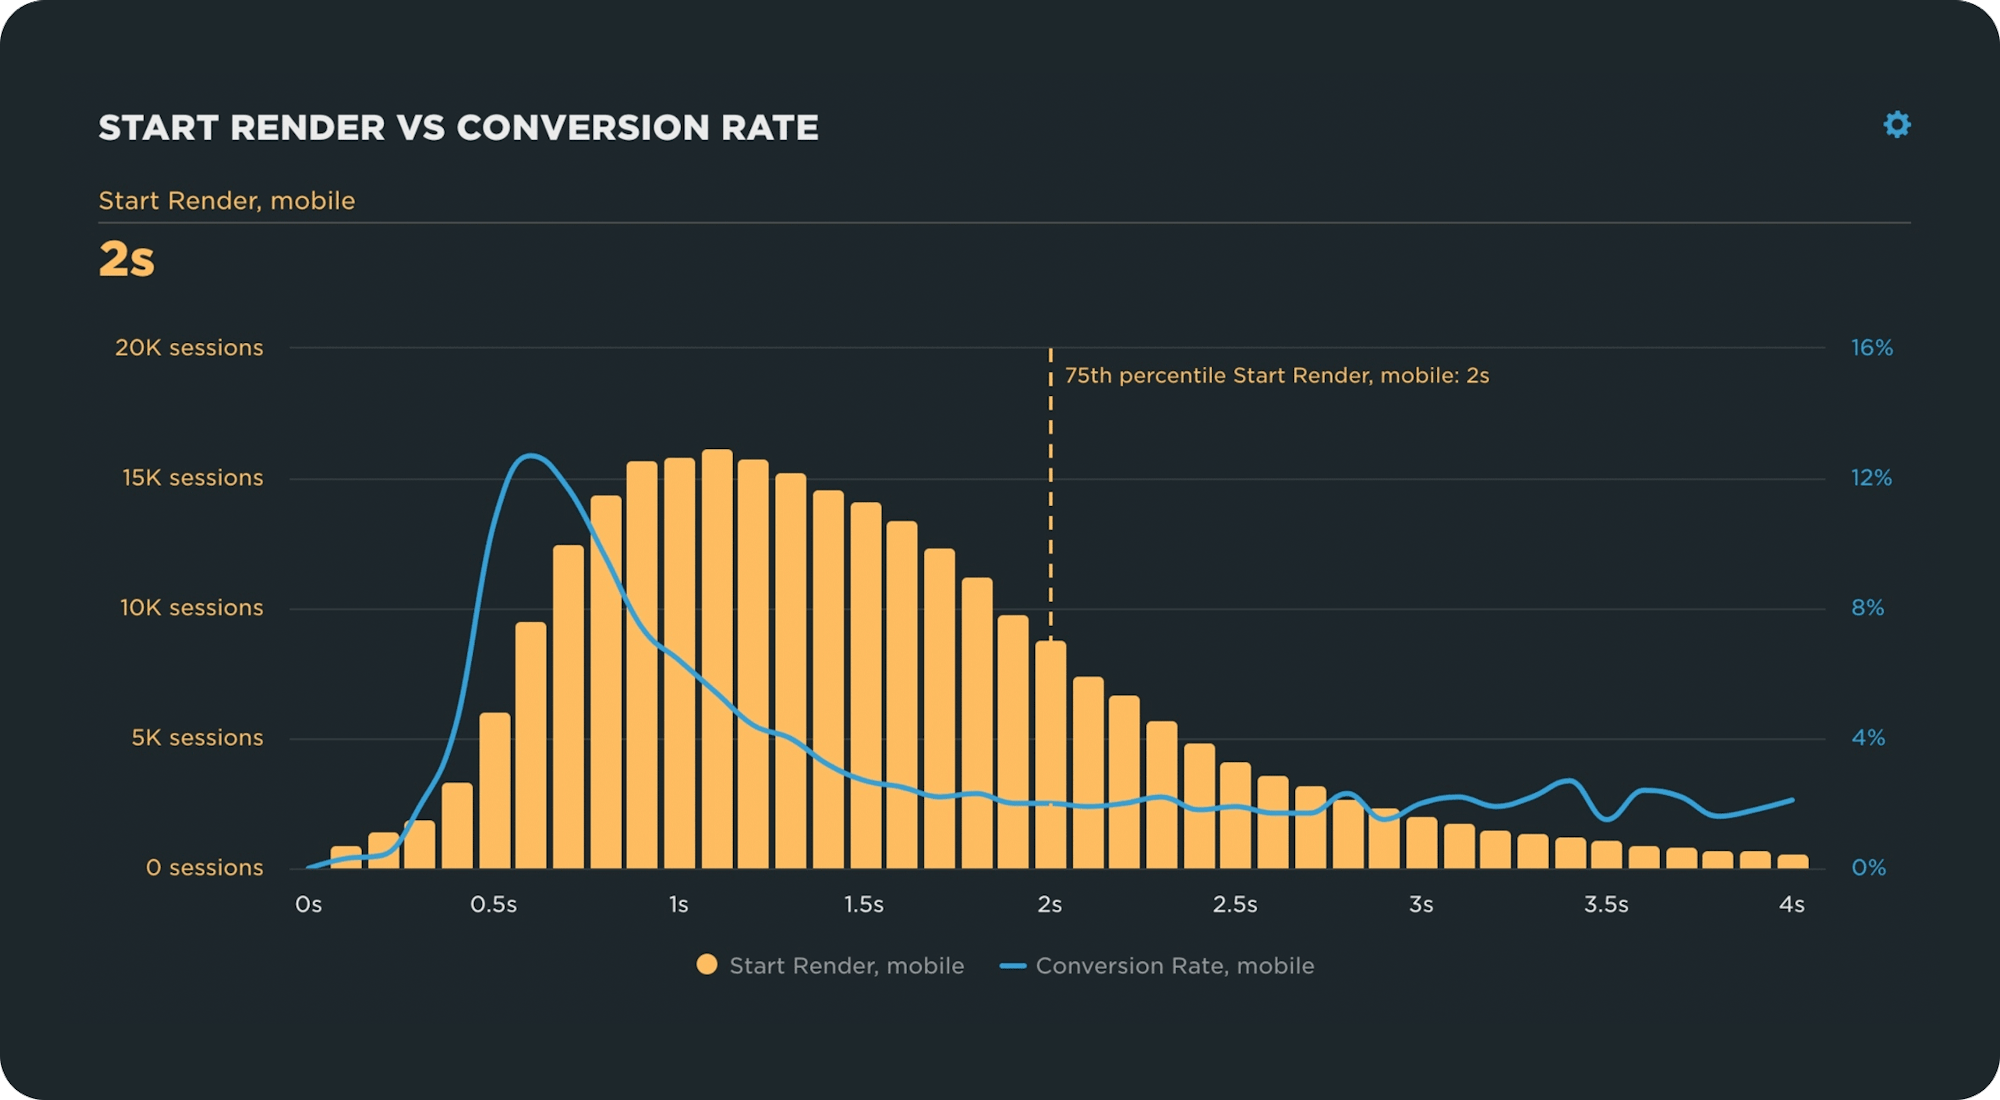
The cohort of mobile users who experienced Start Render times of 0.6 seconds had the highest conversion rate (13%). As pages get slower for this site, conversion rate quickly decreases. At 1.9 seconds, conversion rate plateaus at about 2%.
Slowdowns can cost more than downtime
Downtime gets all the attention, but “slowtime” is often just as damaging and harder to notice. Visitors rarely wait around when pages load at a crawl.
How real user monitoring (RUM) with SpeedCurve can help you
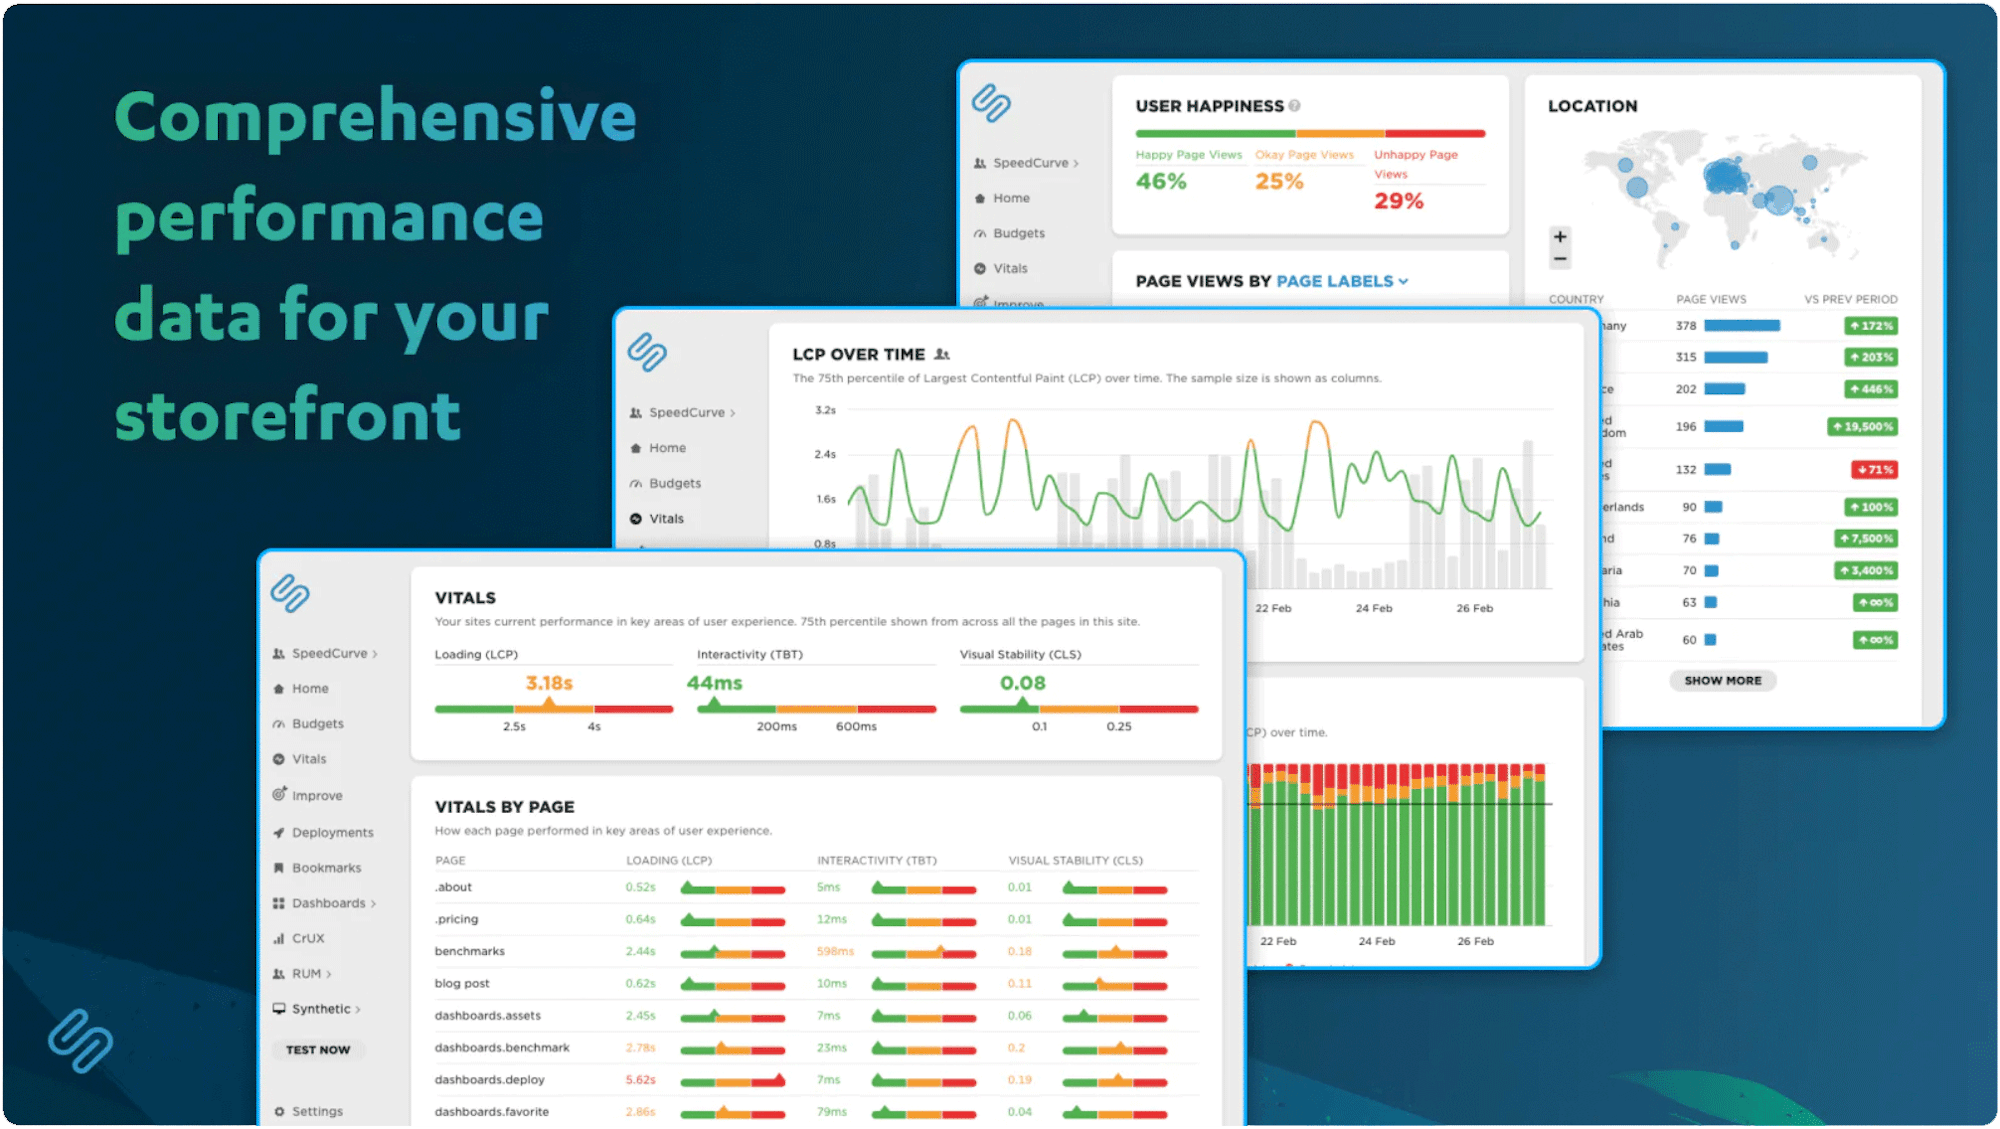
SpeedCurve is uniquely positioned to give you a full picture of your web performance and how it affects user behavior. By combining synthetic testing and real user monitoring, you can learn exactly how long your pages are taking to load for real users and then get the optimization recommendations you need to diagnose and improve performance.
Until now, if you were a Shopify merchant without a developer, you probably relied on synthetic testing like Lighthouse or PageSpeed Insights. With the new SpeedCurve RUM app, you can easily add real user monitoring, which unlocks the full potential of SpeedCurve.Additionally, you’ll be able to automatically track your conversion rates to web performance.
RUM gives you visibility into how your actual customers experience your site. With RUM, you can:
- Correlate key business metrics with performance – Out of the box, SpeedCurve RUM shows you correlation charts (like those used above) between your performance and bounce rates. We’ve also set up automatic conversion tracking for add to cart, checkout started, and checkout completed. With a little extra setup, you can also create correlation charts for conversion rate, cart size, A/B tests, and more.
- Pinpoint problems with data – Without data, optimizing your site feels like guesswork. RUM provides real, actionable insight into where performance breaks down on real user devices, so you can fix it faster and more confidently.
- Segment web performance data by page type, device, and more – SpeedCurve gives you the power to segment data, track performance trends over time, and see exactly how different parts of your site perform for different users.
- Track improvements and spot new issues – Once you've addressed current issues, SpeedCurve helps you stay ahead with weekly reports and real-time alerts, set according to your notification preferences. Never miss a performance regression again!
Easy setup, no developer required
You no longer need to dive into code or wait for a web or theme developer to set up performance monitoring for you. The new Shopify app makes RUM setup as simple as a few clicks.
No developer required
The installation is non-technical. Here's how to install SpeedCurve RUM in just four steps.
Get useful data immediately
Once the app is installed, SpeedCurve begins collecting real user data right away, giving you insights within minutes.
Friendly support when you need it
Whether you hit a snag or just want advice, SpeedCurve's super-friendly performance experts are there to help. Just send them a note at support@speedcurve.com.
Add RUM to your Shopify store – for free
It’s free to install and explore the SpeedCurve Shopify app. Start collecting real user performance data today and unlock new ways to improve speed, conversion, and user experience.
If you're already a SpeedCurve Synthetic user – Install the SpeedCurve RUM app via your Shopify dashboard, and then connect the app to your SpeedCurve account. Here's how to get setup in minutes.
If you're not a SpeedCurve user yet – Sign up for your free trial and then install the app.
Sia Karamalegos is a web performance engineer and consultant, creative technologist, and systems thinker. At Shopify, she enhanced merchant sites fand the Shopify platform for Core Web Vitals performance. She is a Google Developer Expert in Web Technologies, as well as a Cloudinary Media Developer Expert.