How to use Server Timing to get backend transparency from your CDN


80% of end-user response time is spent on the front end.
That performance golden rule still holds true today. However, that pesky 20% on the back end can have a big impact on downstream metrics like First Contentful Paint (FCP), Largest Contentful Paint (LCP), and any other 'loading' metric you can think of.
Server-timing headers are a key tool in understanding what's happening within that black box of Time to First Byte (TTFB).
In this post we'll explore a few areas:
- Look at industry benchmarks to get an idea of how a slow backend influences key metrics, including Core Web Vitals
- Demonstrate how you can use server-timing headers to break down where that time is being spent
- Provide examples of how you can use server-timing headers to get more visibility into your content delivery network (CDN)
- Show how you can capture server-timing headers in SpeedCurve
How slow backend times influence key metrics
First, we need to understand what 'slow' means. For more years than I care to mention, I've been advising folks that their TTFB should be under 500ms. Google recommends that TTFB be 800ms at the 75th percentile. For the purpose of this post, let's say that 500ms backend time is 'good enough'.
Looking at the industry benchmarks for US retailers, four well-known sites have backend times that are approaching – or well beyond – that threshold.
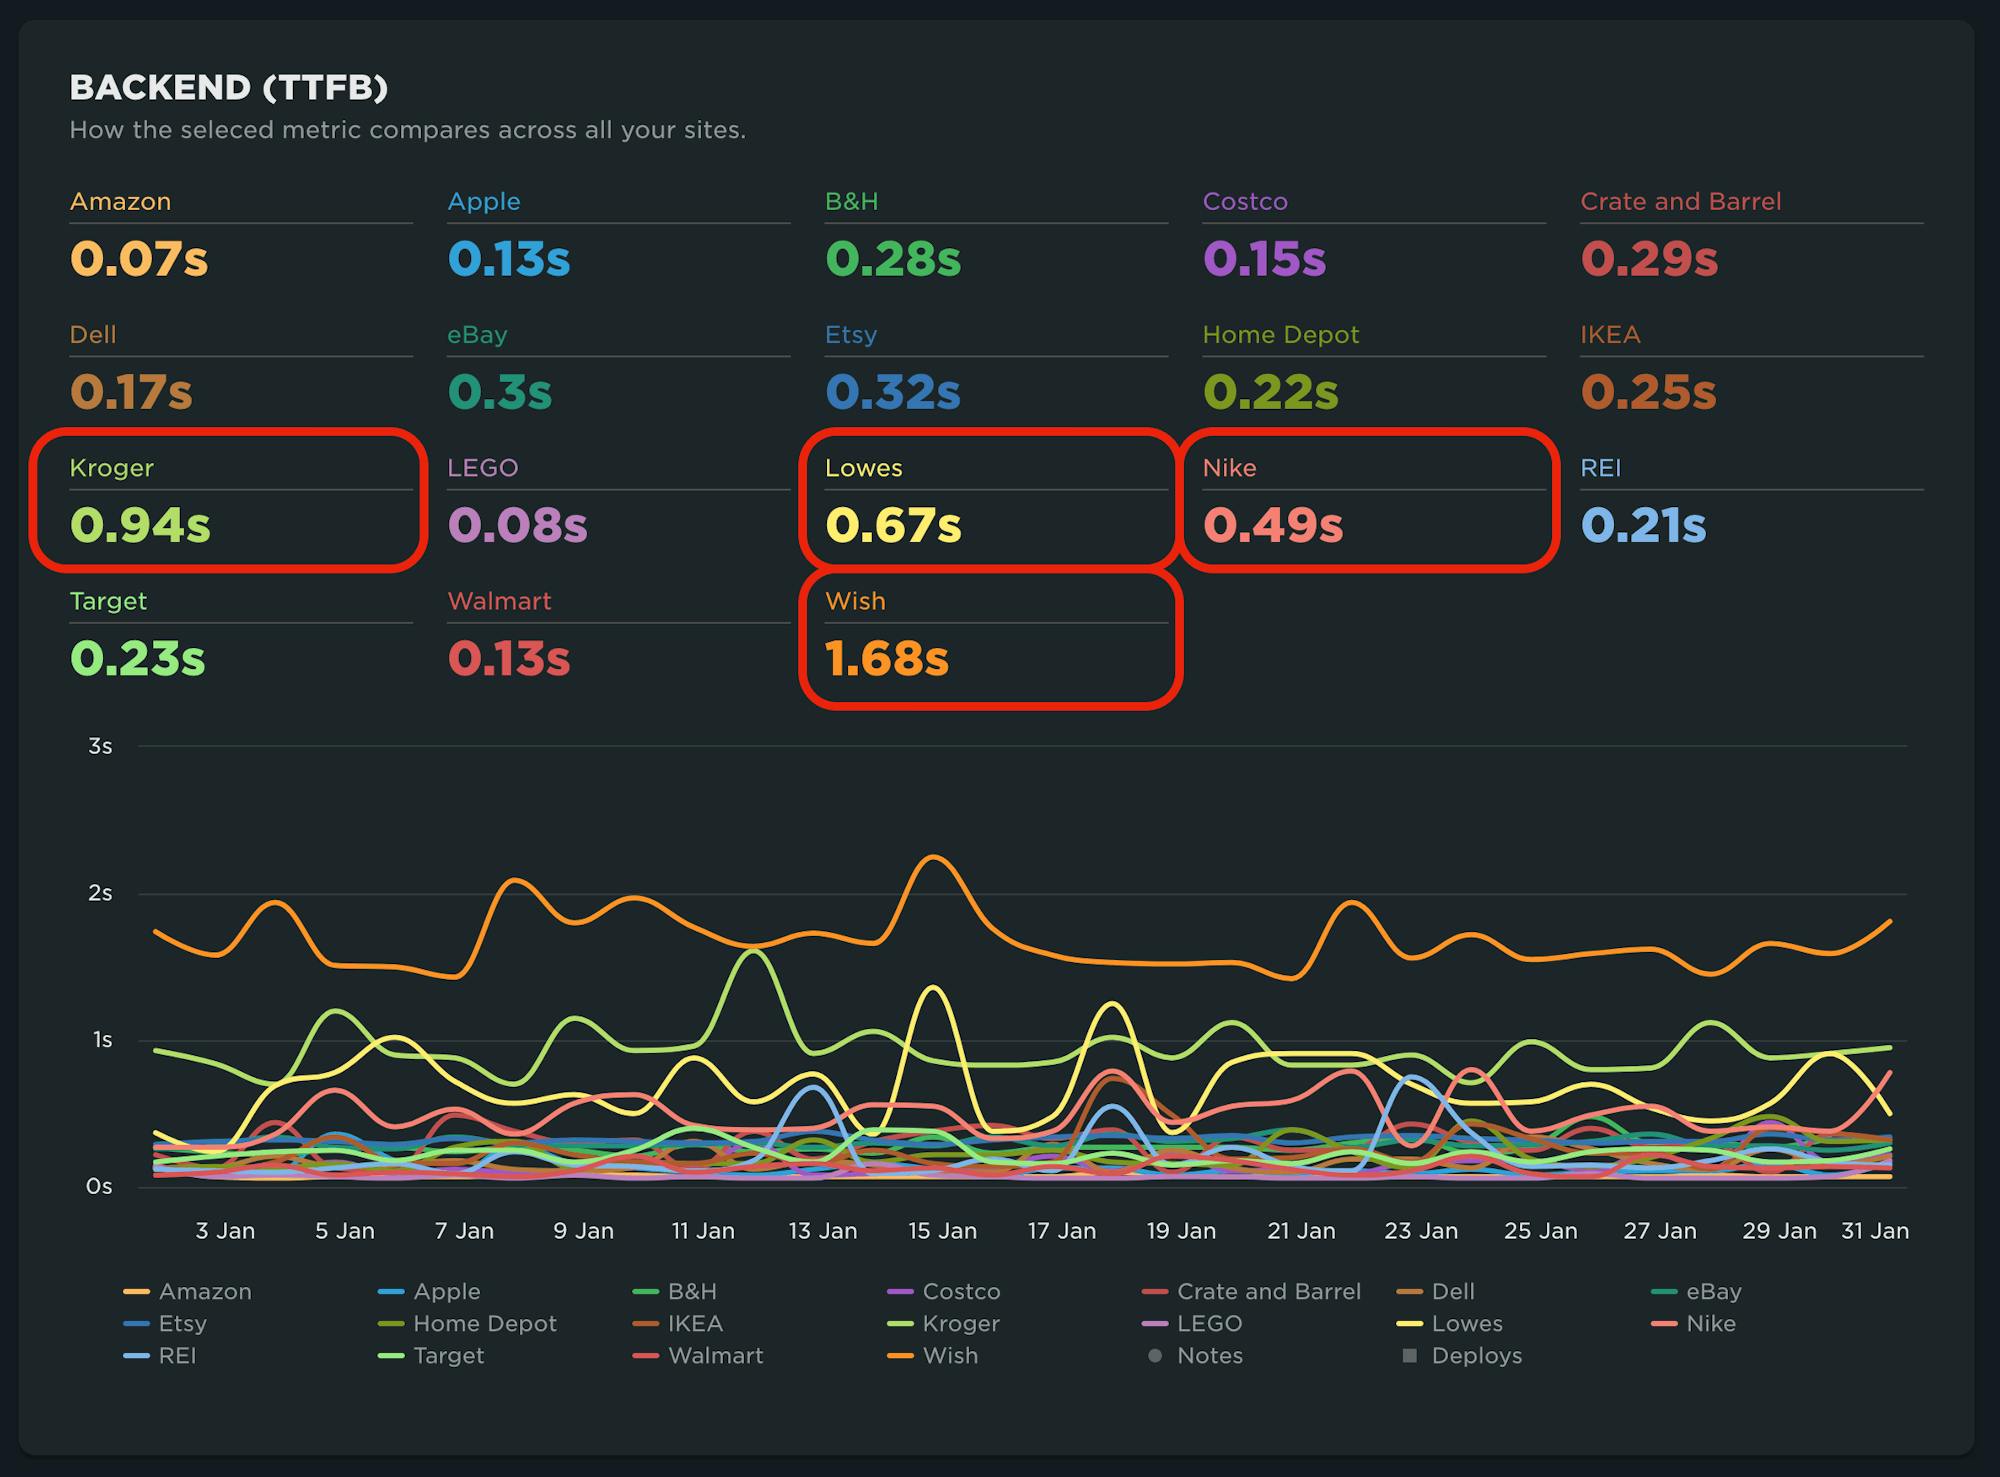
Pagespeed Benchmarks - US Retail - Backend
Those same sites, with the exception of Lowe's, were also in the slower cohorts for First Contentful Paint (FCP), Largest Contentful Paint (LCP), and other loading metrics.
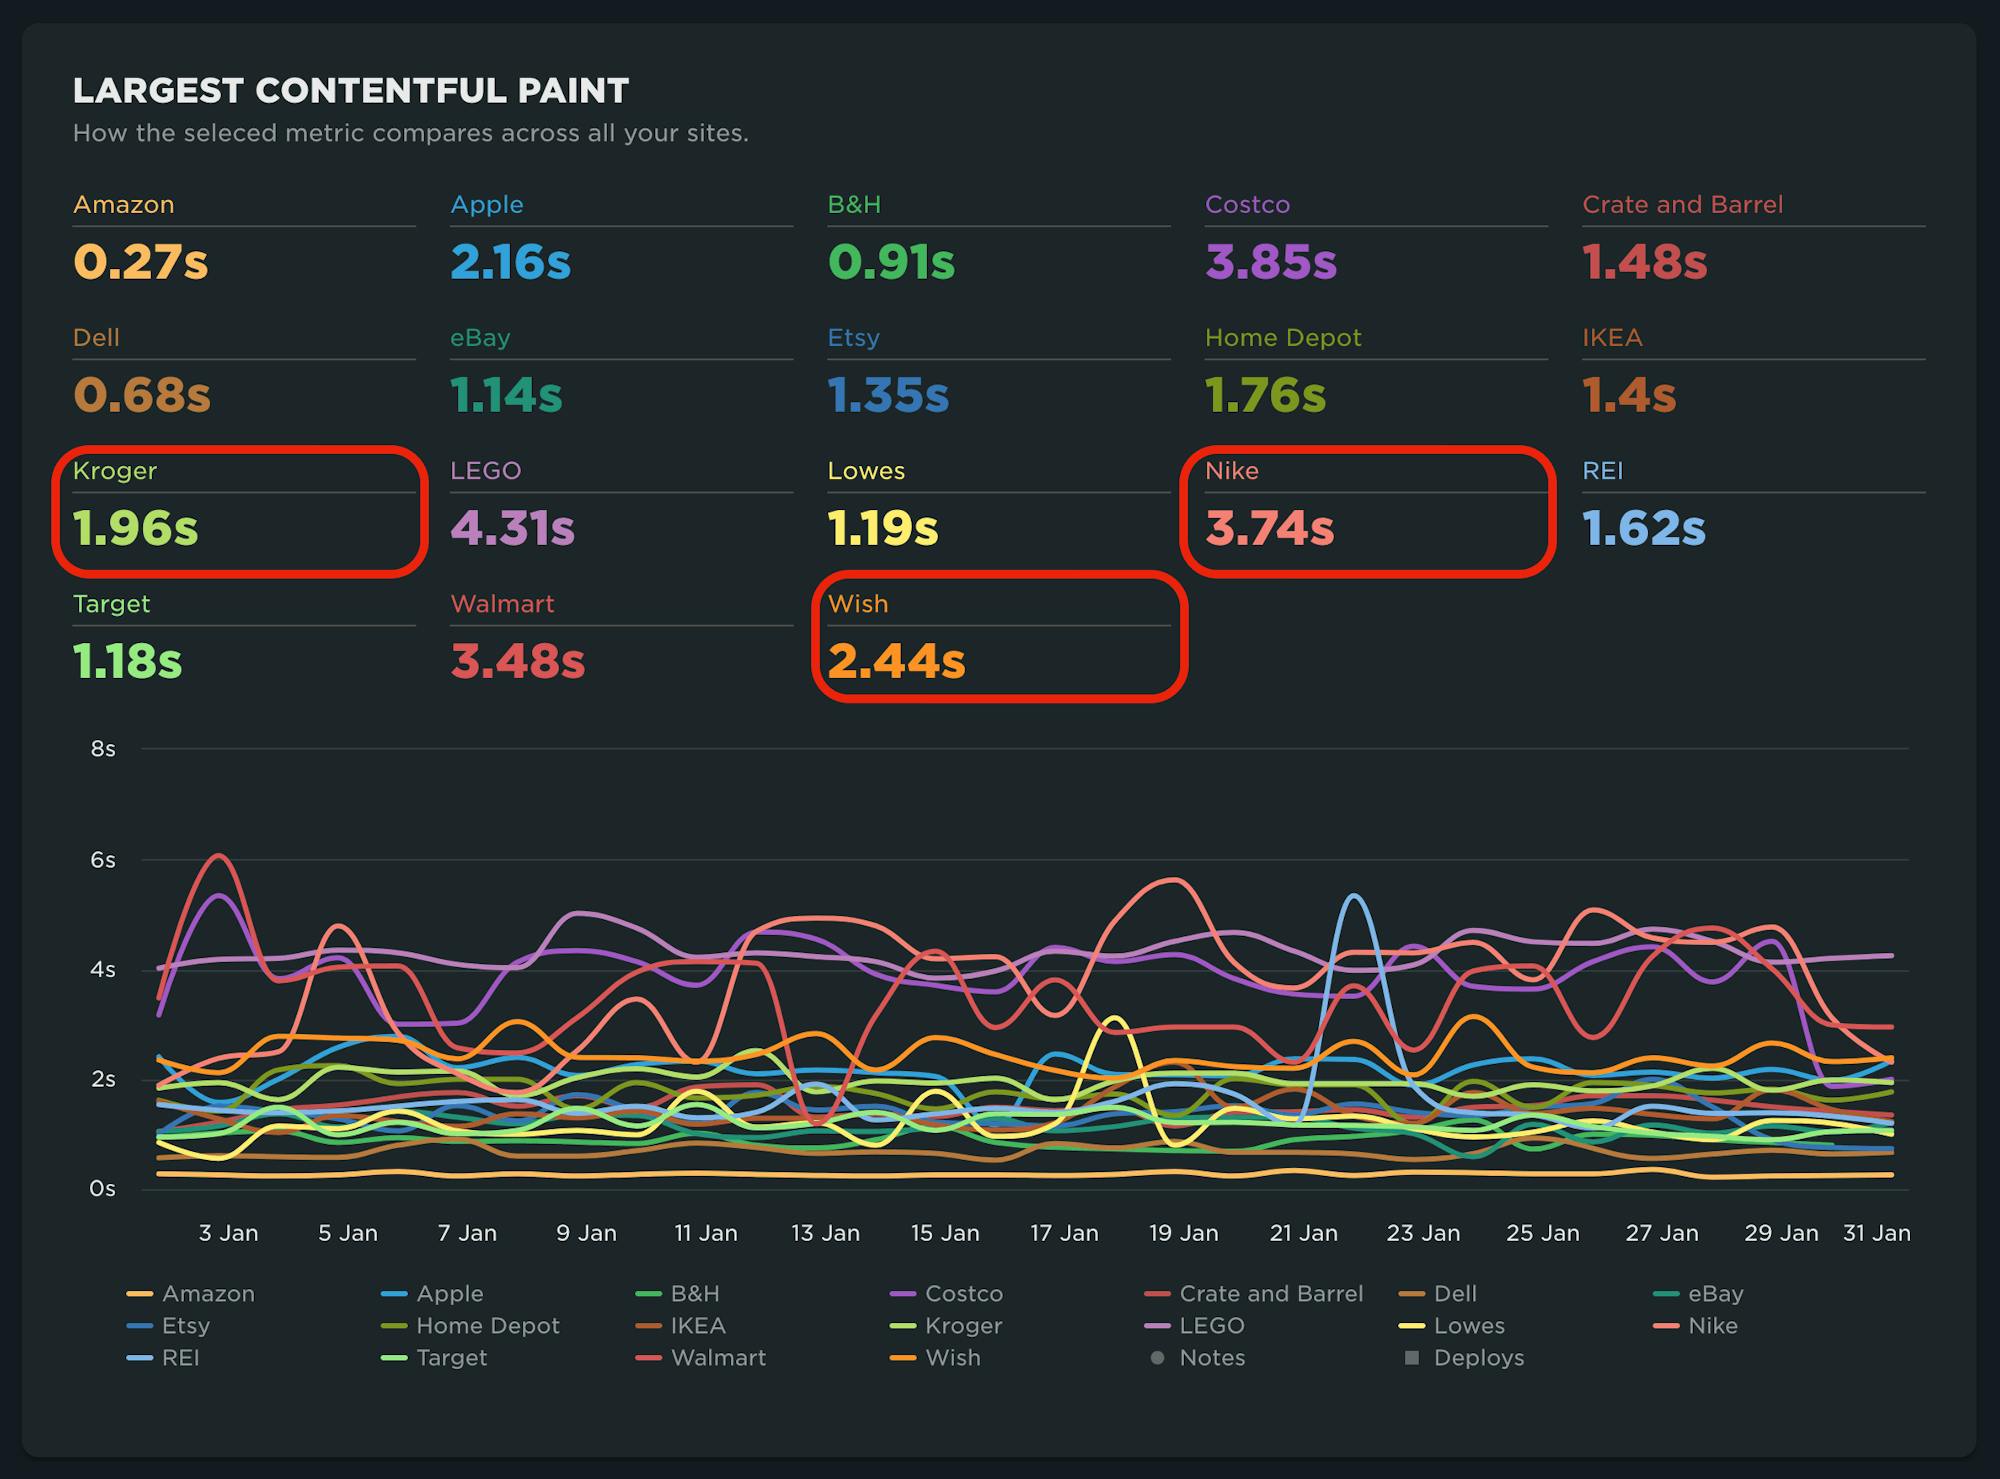
Pagespeed Benchmarks - US Retail - LCP
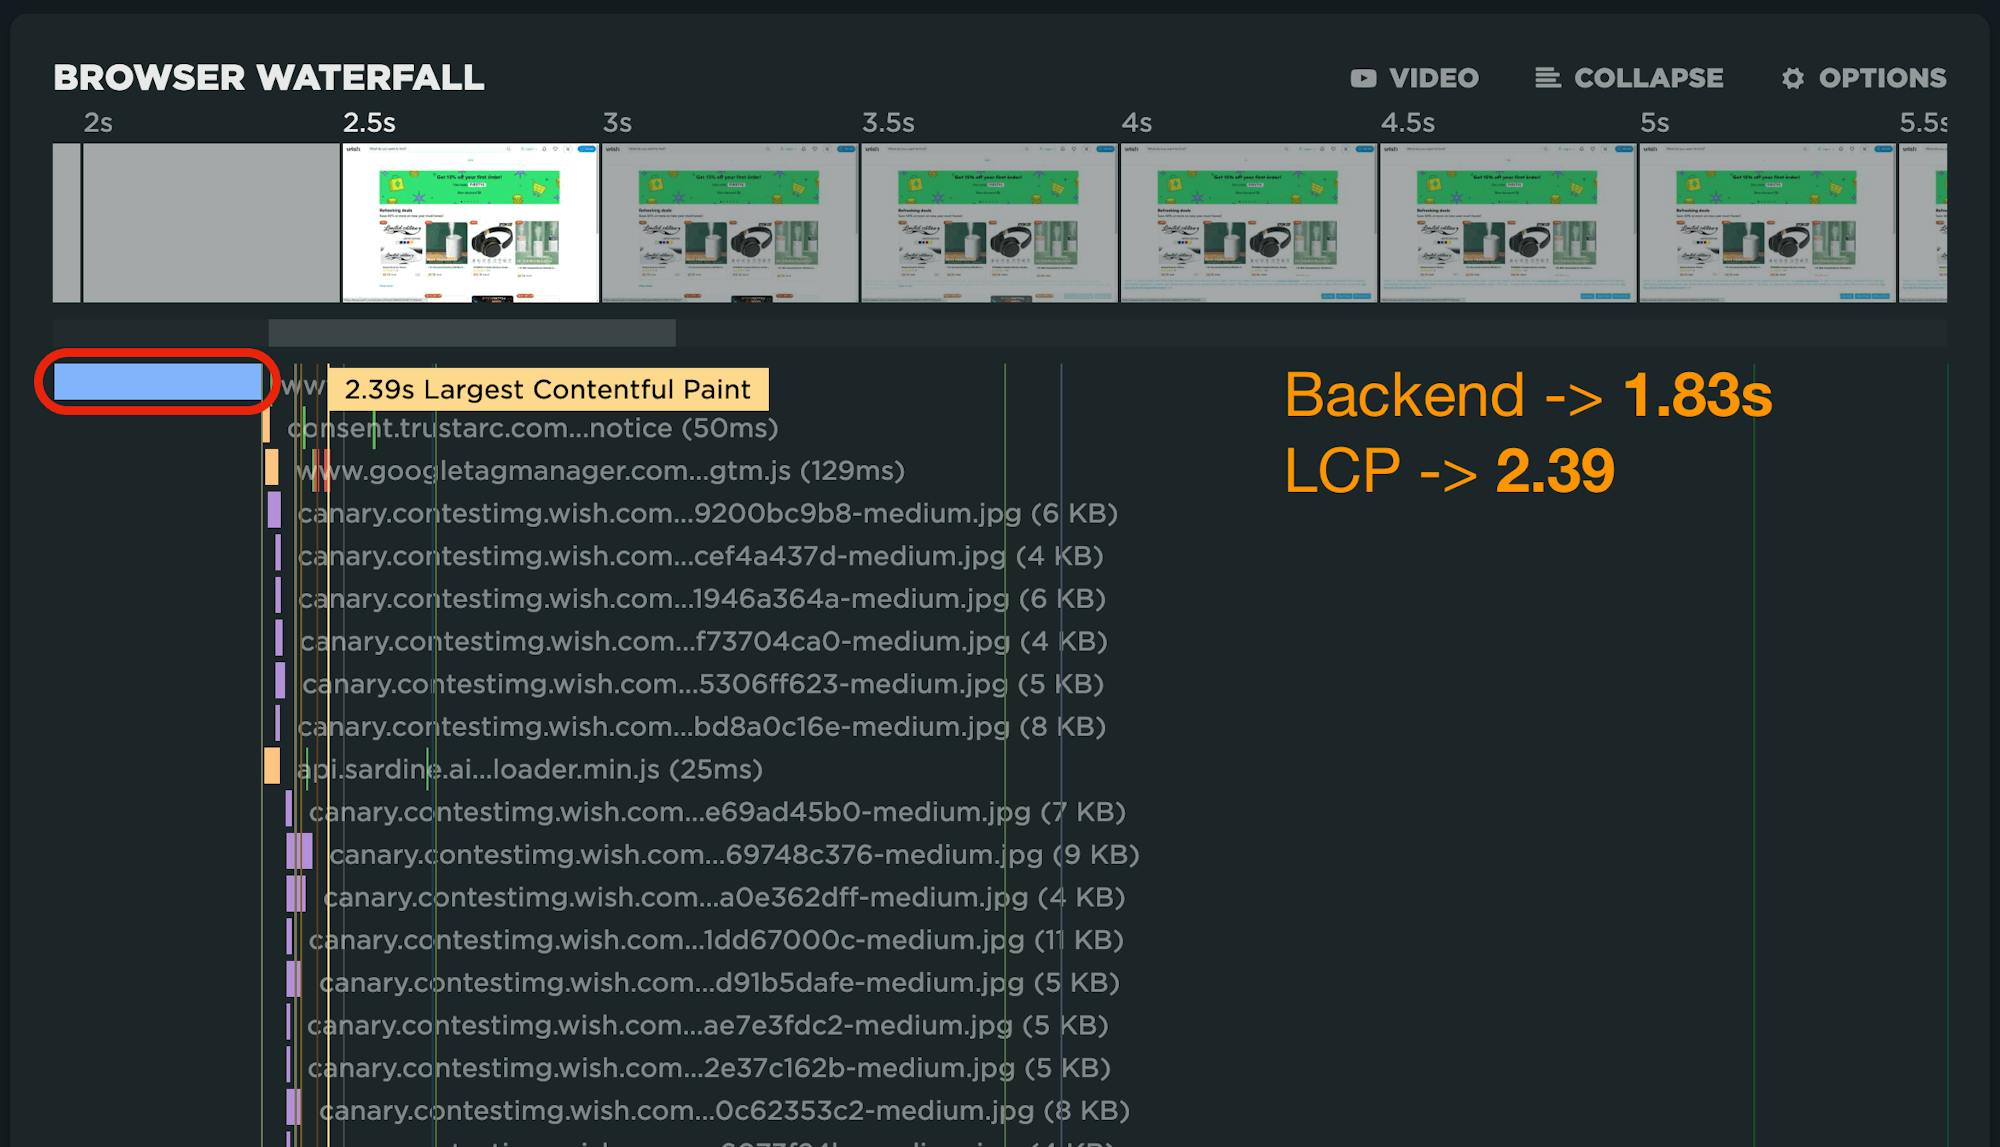
When you examine a waterfall, it's pretty obvious that TTFB is the long pole in the tent, pushing out render times for the page. Given that TTFB is synchronous by nature, we can expect to see this pattern for any site that has opportunities.
Cue server-timing headers
Historically, when looking at page speed, we've had the tendency to ignore TTFB when trying to optimize the user experience. I mean, why wouldn't we? Steve told us to focus on the front-end! ;)
Well, a lot has changed over the years, including the ability to get more detailed information from the server on the user agent through the use of Server Timing.
Server Timing is a specification that allows communication of data from the server to the client through the use of a server-timing header. This is a special header that is accessible through a JavaScript interface. SpeedCurve's RUM collection library – lux.js – accesses this interface to collect custom data from the user agent.
The specification requires that header values are passed through a duration field (dur) and/or a description field (desc). In practice, it looks something like this:
server-timing: processing_time; dur=123.4; desc="Time to process request at origin"
NOTE: This is not a new API. Charlie Vazac introduced server timing in a Performance Calendar post circa 2018. However, wider adoption has only just started to take off.
It's not just about timing
While the intention of server-timing headers may have originally been to get more insight into how long things are taking, another great use case involves sending across dimension data or meta data.
For example, you might use the headers to pass across identifiers such as a datacenter location or other geographic details:
server-Timing: datacenter; desc="denDRP01"
For debugging purposes, maybe send along a link to a session trace to provide a 'front-end' APM solution:
server-Timing: sessiontrace; desc="https://your.logfiles.com/transId=T1234-5678-9012-3456
Or, did the request use early hints (or some other form of web performance magic):
server-timing: earlyhints
Server timing and your CDN
For a large majority of sites, content delivery networks (CDNs) serve a critical role in delivering consistent user experiences. Caching the base page/HTML is common, and it should have a positive impact on backend times. But what happens when it doesn't?
CDNs have traditionally been a bit of a black box when it comes to finding out where time is being spent. With as much as we are moving compute and other capabilities (e.g., bot management, WAF) to the 'edge', there are more and more checkpoints that often go unreported.
The use of server-timing headers by content delivery networks closes a big gap. Today, it's possible to add these headers from your CDN with ease, if they aren't already set up out of the box.
Key things to understand from your CDN
- Cache Hit/Cache Miss – Was the resource served from the edge, or did the request have to go to origin?
- Latency – How much time does it take to deliver a packet from A to B. Also measured by round trip time (RTT).
- Origin Time – How much time did the request spend from your origin? (In the case of a cache miss, this should be zero.)
- Edge Time – How much time was spent at the CDN? This can include a lot of different service layers, not just serving from cache. For example, processing of web application firewall (WAF) rules, detecting bots or other malicious traffic though security services, and growing in popularity, edge compute.
Below are some examples from the major CDN providers that you can leverage.
Akamai
Akamai was the first to start emitting server-timing headers and set the tone for CDN transparency. This data is available by enabling the mPulse behavior in property manager. With the behavior enabled, you will start seeing the following server-timing headers:
Cache HIT/MISS
Server-Timing: cdn-cache; desc=<MISS|HIT>
Edge Time
Server-Timing: edge; dur=<# ms>
Origin Time
Server-Timing: origin; dur=<# ms>
Note that if you don't use the mPulse product, you can still enable the headers without the snippet by modifying property settings. Another option would be using EdgeWorkers to add the headers to the request, similar to the example shown next.
Amazon Cloudfront
You can add server-timing headers via opt-in via the AWS Console as mentioned in this post.
CDN Layer (edge, edge-cache, origin shield)
DNS Time
Connect Time
Upstream/downstream first byte latency
Cache status
POP
Here is an example of server-timing headers taken from https://www.perfwork.com/:
server-timing: cdn-upstream-layer;desc="EDGE",cdn-upstream-dns;dur=0,cdn-upstream-connect;dur=69,cdn-upstream-fbl;dur=562,cdn-cache-miss,cdn-pop;desc="DEN52-P3",cdn-rid;desc="5McHcGf1pCMEZKUtTuHH-UI7Co2qq-817CJu_cD7oVUo9BmxBtpIHQ==",cdn-downstream-fbl;dur=563
Cloudflare
UPDATED: July 2025
Cloudflare now supports server-timing headers out of the box for their RUM customers. If you are not a RUM customer, you can easily add these headers using transform rules.
Default for RUM customers:
Server-Timing: cfCacheStatus;desc=<MISS|HIT|EXPIRED>
Server-Timing: cfEdge;dur=<# ms>
Server-Timing: cfOrigin;dur=<# ms>
Using transform rules:
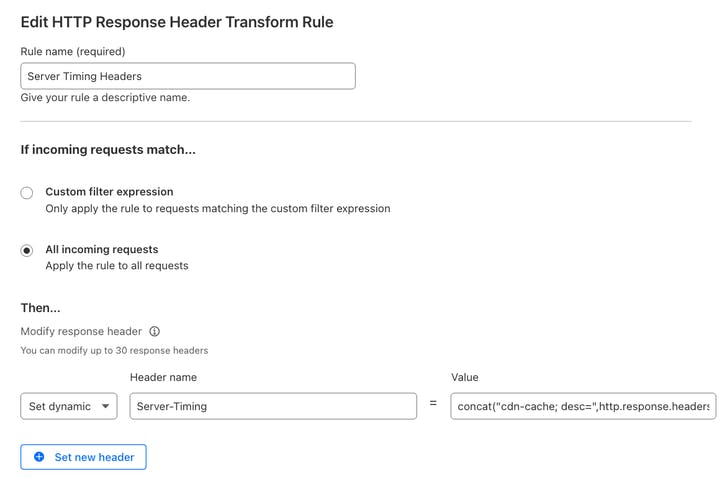
concat("cdn-cache; desc=",http.response.headers["cf-cache-status"][0],", edge; dur=",to_string(cf.timings.edge_msec),", origin; dur=",to_string(cf.timings.origin_ttfb_msec))
This transform rule exposes:
Server-Timing: cdn-cache; desc=<MISS|HIT>
Server-Timing: edge; dur=<# ms>
Server-Timing: origin; dur=<# ms>
Workers:
Using Cloudflare Workers, you can add values from existing headers such as CF-Cache-Status into server-timing headers.
Here is an example returning the cache status (hit, miss, revalidate, etc.):
/**
* @param {Response} response
* @returns {Response}
*/
function addServerTimingHeaders(response, startTime) {
const serverTiming = [];
const cfCache = response.headers.get('cf-cache-status');
if (cfCache) {
serverTiming.push(`cf_cache;desc=${cfCache}`);
}
serverTiming.push(`worker;dur=${Date.now() - startTime}`);
response.headers.set('Server-Timing', serverTiming.join(', '));
}
Fastly
While you could likely use Compute@Edge to add server-timing headers via Fastly, using VCL is pretty straightforward as discussed in this post.
TLDR:
Request start (from edge)
Elapsed time (edge time)
POP (edge location)
Cache status (hit, miss)
To get the following:
Server-Timing: time-start-msec;dur=1544705663920,time-elapsed;dur=0,fastly-pop;desc=LCY,hit-state;desc=HIT
Use the following VCL:
set resp.http.Server-Timing = "time-start-msec;dur=" time.start.msec ",time-elapsed;dur=" time.elapsed.msec ",fastly-pop;desc=" server.datacenter ",hit-state;desc=" fastly_info.state;
There are a lot of VCL variables available that might be useful server-timing headers.
Shopify
UPDATED: July 2025
Shopify provides the following server-timing headers for all Shopify sites. It's important to note that these are not considered public, so use at your own risk.
server-timing: processing;dur=1665;desc="gc:119", db;dur=539, db_async;dur=75.192, edge_cart;dur=2.0;desc="trips=1", fetch;dur=89, render;dur=521, asn;desc="7922", edge;desc="DEN", country;desc="US", prefetch, speculationTags;desc="shopify_storefront", theme;desc="135541981393", pageType;desc="collection", servedBy;desc="hfnx", requestID;desc="9d04f86b-2108-43b4-bf10-ee898cf26b1d-1751988611"
server-timing: cfRequestDuration;dur=1713.999987
server-timing: ipv6
server-timing: cfExtPri, earlyhints
As of the writing of this article, our understanding of each of the headers is as follows:
cfRequestDuration = Duration from the time the request hits Cloudflare (CDN) until it is finished processing.
processing = Duration from the time the request reaches the Storefront until processing of the request is complete.
db = Duration of the request processing spent querying the database. (Subset of processing time)
db_async = ??
edge_cart = ??
fetch = ??
render = ??
asn = Autonomous System Number
edge = Location of CDN edge server
country = Country of CDN edge server
prefetch = Was the page prefetched (if present, assume yes)
speculationTags = Which speculation rule(s) were used
theme = Shopify theme used
pageType = page identifier
servedBy = ??
requestID = ??
ipv6 = present if ipv6 network protocol was used
cfExtPri = ??
earlyhints = Were early hints used for the request (if present, assume yes)
Collecting server-timing headers with SpeedCurve
If you use SpeedCurve RUM, server timing is one of the preferred methods for capturing custom data. See this guide to learn how you can define custom dimension data, metadata, or metric (timing, size, numeric).
Here are a few example charts created by leveraging server-timing headers provided by CDNs: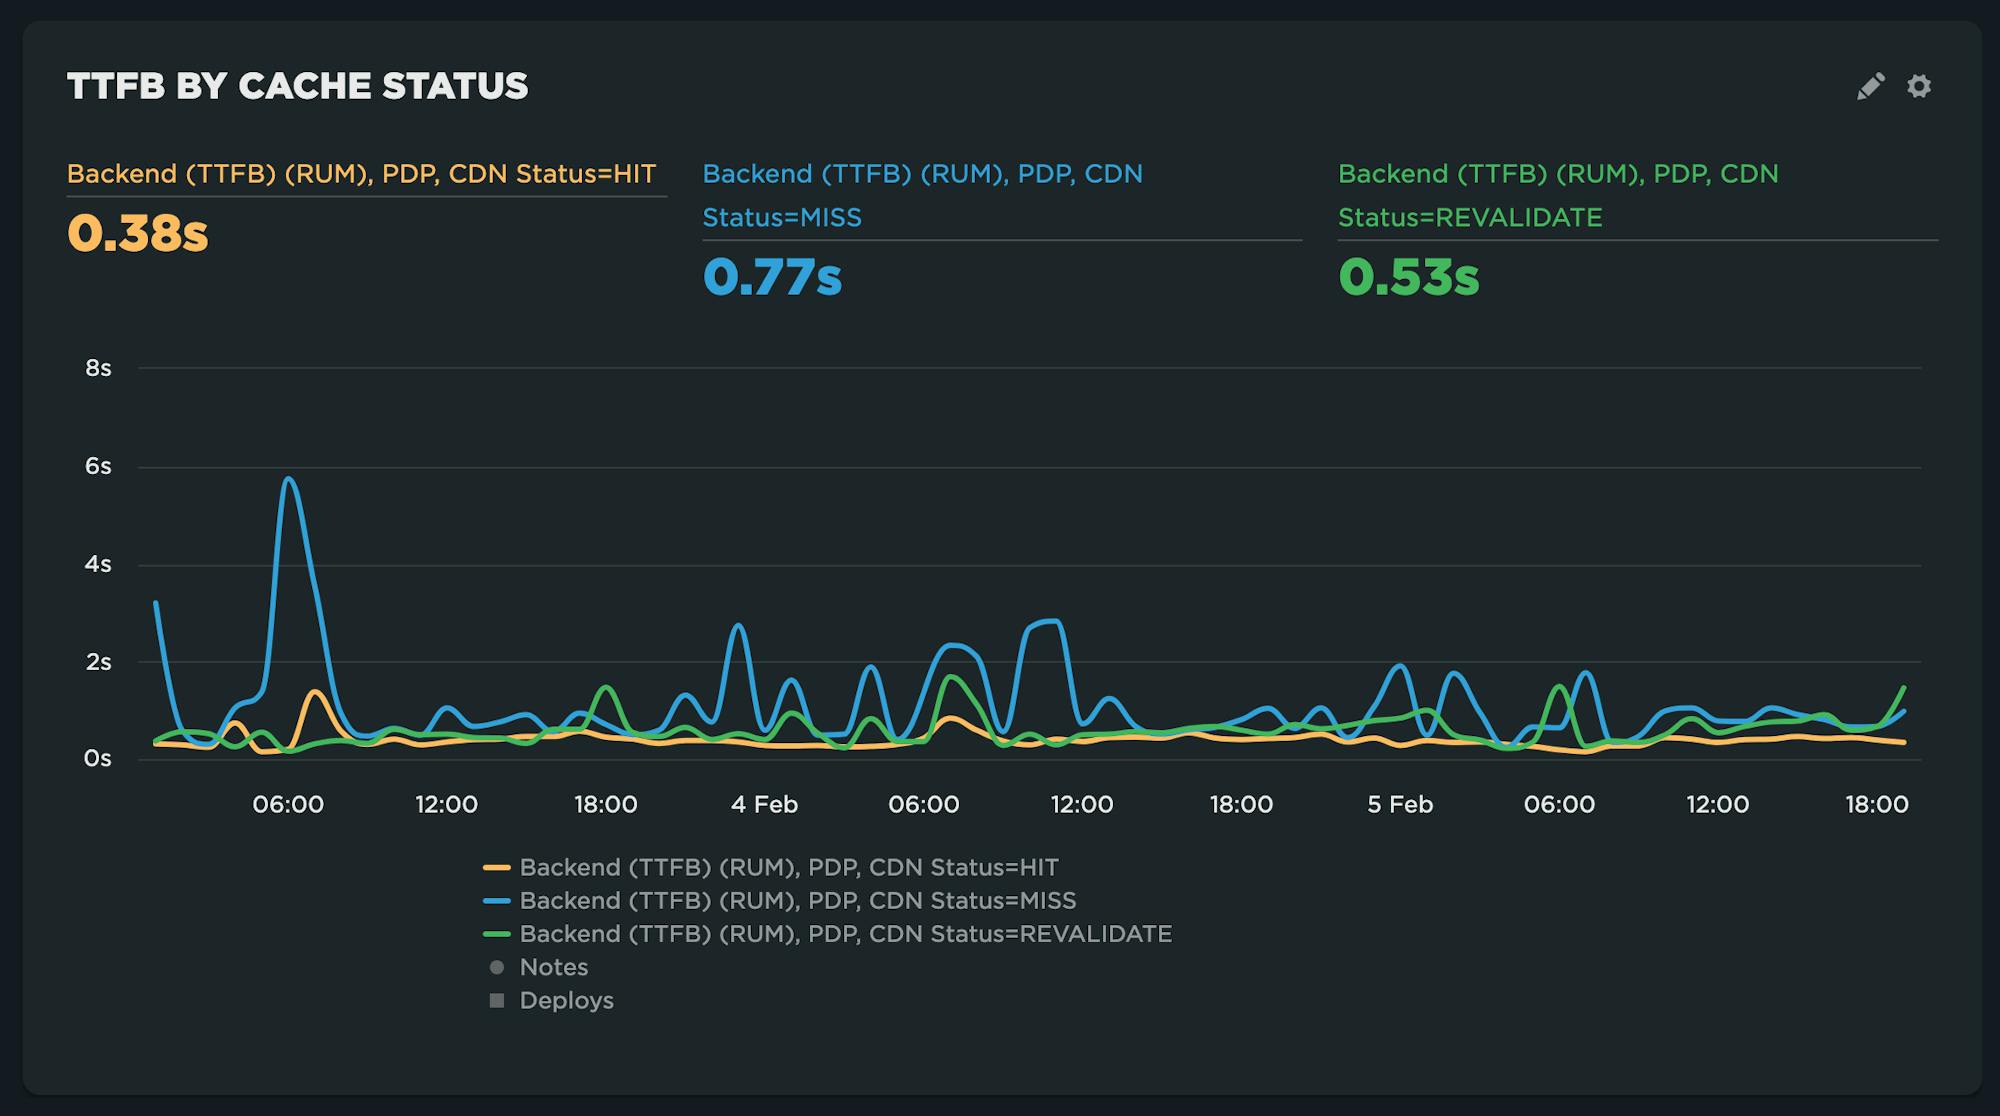
TTFB by cache state
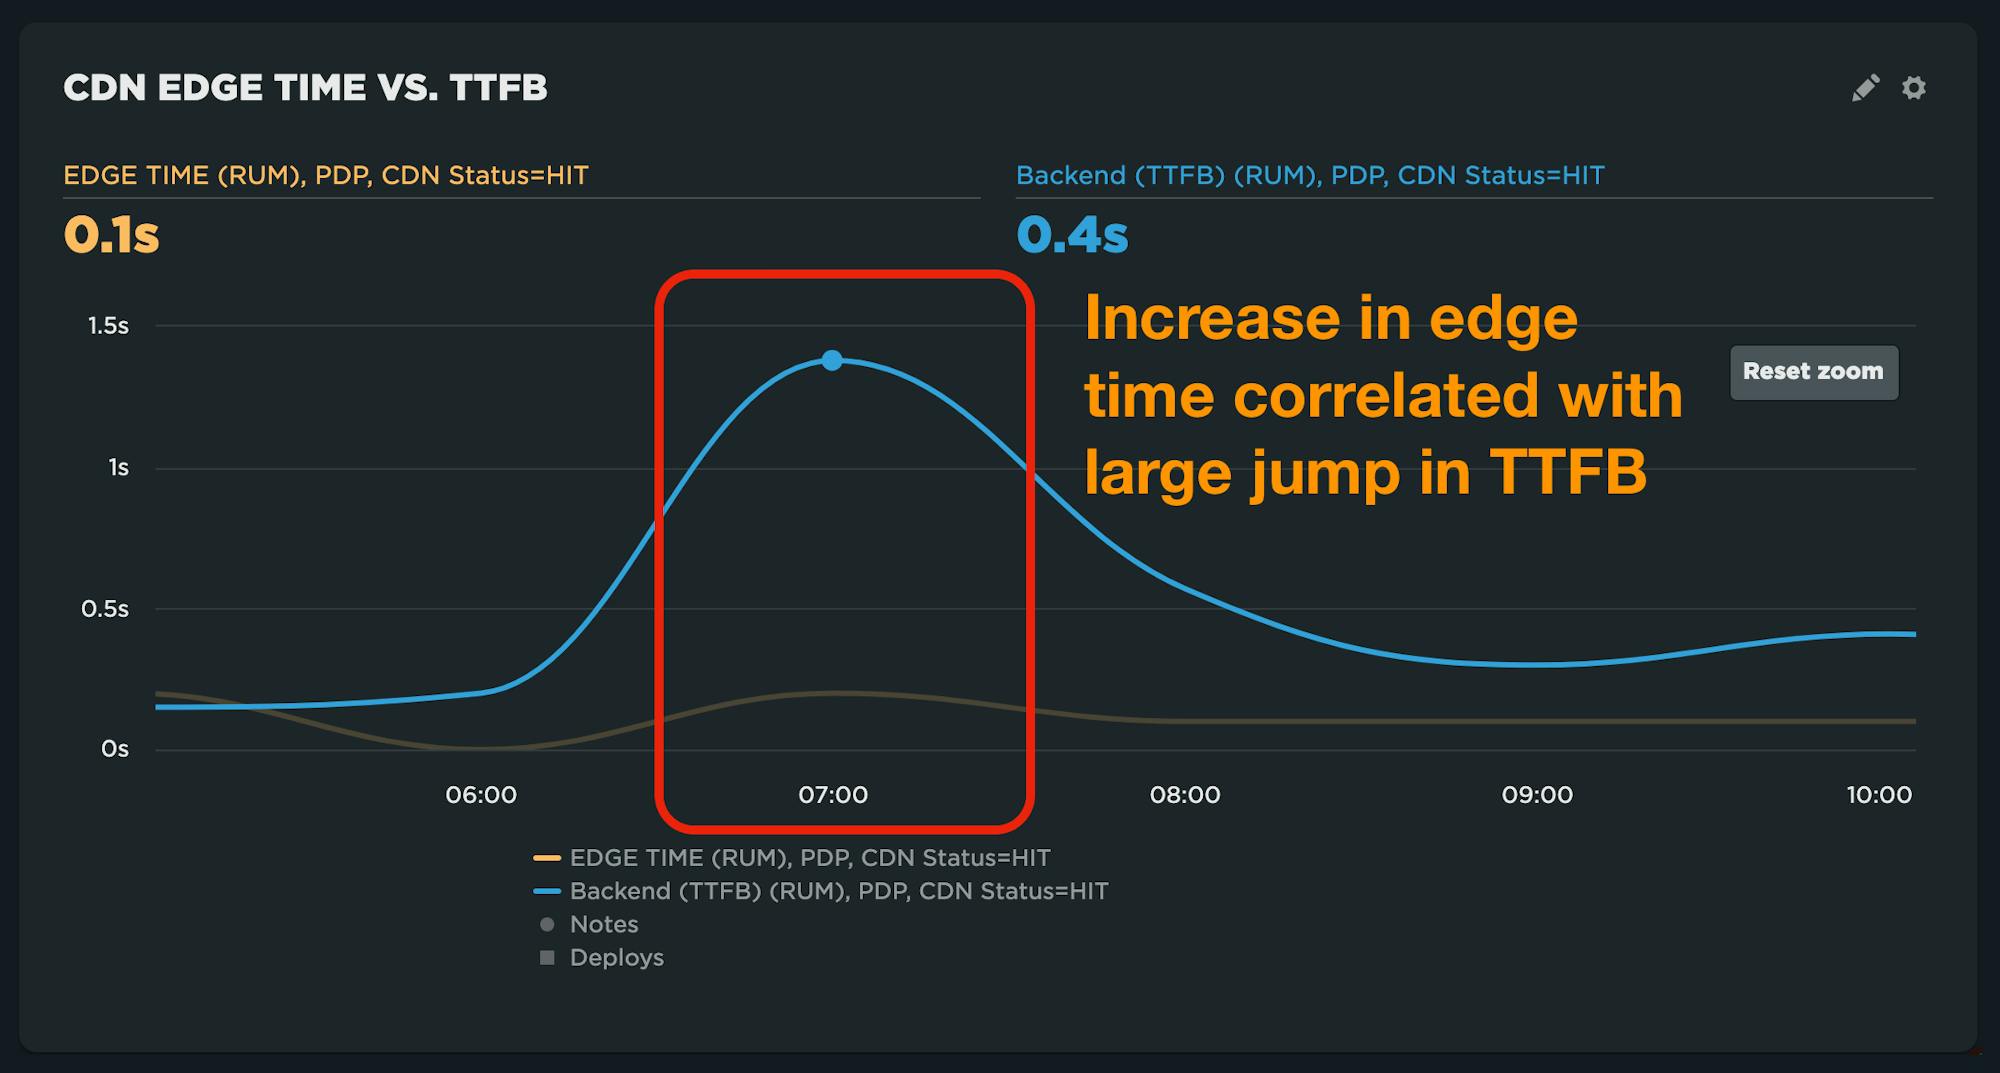
TTFB and CDN Edge time
If you're not using SpeedCurve RUM and want to experiment with capturing server-timing headers, start a free trial today!
Recent server timing case studies
It's great to see server timing starting to get more use in the wild. Here are a couple of great blog posts from last year's Web Performance Calendar. Definitely worth a read!
- How epilot used Server Timing to drive a 70% performance improvement
- Breaking down TTFB with Server Timing

Read Next

Largest Contentful Paint might miss the most important elements on the page. Here's how Element Timing can help you measure the moments that matter for your visitors.
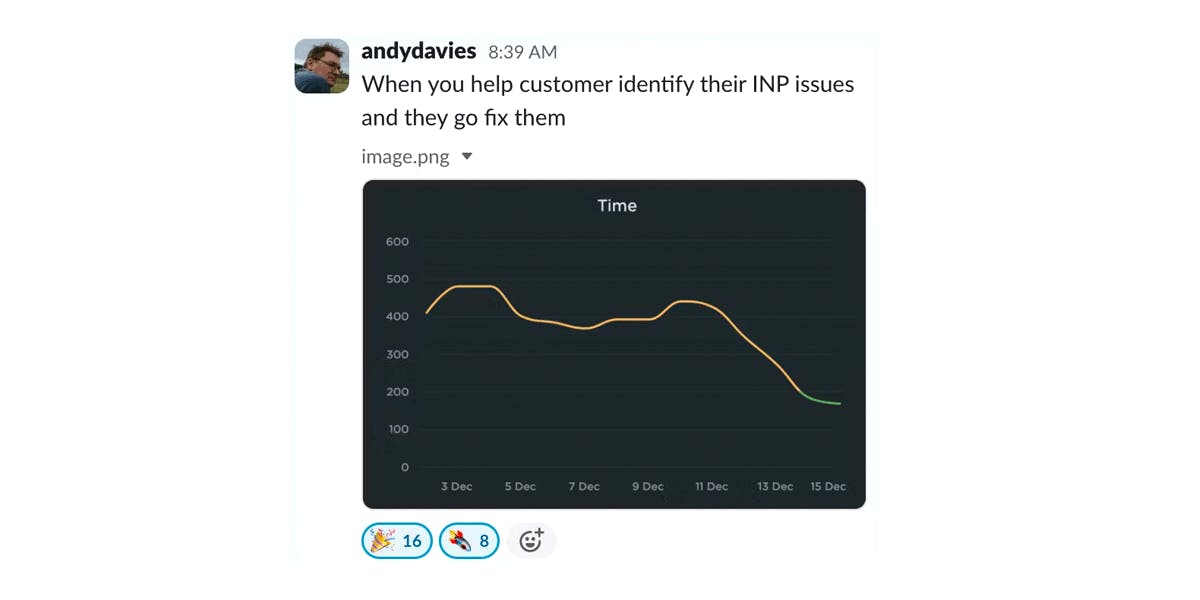
Here's a super-helpful tip for identifying elements causing Interaction to Next Paint issues for your pages.