More RUM metrics in your Favorites dashboards

SpeedCurve comes with a great set of dashboards for Synthetic and RUM. But we know that one size does not fit all when it comes to data charts, which is why we've invested so much work into the Favorites dashboards. For customers who use RUM, it provides a place to create custom charts that combine metrics from synthetic and RUM.
We just added some new RUM metrics in Favorites to allow for even more customized monitoring:
- Page Views – The number of page views, including Single-Page-App page transitions
- Sessions – The number of unique sessions
- Session Length – The number of page views per session
- Bounced Sessions – The number of sessions that only have one page view
- Bounce Rate – The percentage of bounced sessions out of the total number of sessions
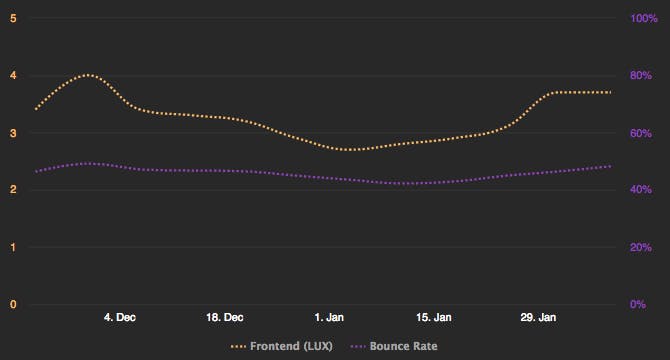
Bounce rate is a powerful metric for correlating performance metrics with business metrics. In the chart below, we see that as frontend time gets faster, bounce rate drops from 49% to 42%, and then rises again as frontend time regresses. This is a great way of showing why staying vigilant about the speed of your site is important for keeping your users happy.
How to get started with these new metrics
If you're already a RUM user: These metrics are waiting in your Favorites dashboard. Give them a try and send us your feedback at support@speedcurve.com.
If you're not a RUM user yet: We'd love to have you try us out for free. Sign up for your 30-day trial.