The Definitive Guide to Long Animation Frames (LoAF)

With Long Animation Frames (commonly referred to as LoAF, pronounced 'LO-aff') we finally have a way to understand the impact of our code on our visitors' experiences.
Long Animation Frame – a frame that took longer then 50ms from its start to when it started painting
LoAF allows us to understand how scripts and other tasks affect both hard and soft navigations, as well as how scripts affect interactions. Using the data LoAF provides, we can identify problem scripts and target changes that improve our visitors' experience. We can also finally start to quantify the impact of third-party scripts as they execute in our visitors' browsers.
Keep reading to learn:
- Why animation frame rate matters
- Anatomy of a Long Animation Frame
- Key LoAF milestones and what we can do with milestone data
- Script attribution (and why script details might sometimes be unavailable)
- How to match script data to Interaction to Next Paint, including sub-parts
- How to capture LoAF entries
- Getting started with LoAF
- LoAF support in SpeedCurve
Where we've come from
Performance isn't just about the download size of our pages and their components, or how a quickly the browser can fetch components from a server. Yet this is where we often start looking when we want to improve site speed.
It's not surprising that network performance is often the main focus. Historically, we've lacked APIs that provide data on the runtime costs of the code we ship as it executes in our visitors' browsers.
The Long Tasks API was a first attempt at providing runtime data. It generates entries for any task longer than 50ms, but it doesn't provide any attribution so it's hard to understand what's causing the Long Tasks.
This is why Long Animation Frames are an evolutionary next step.
Why does animation frame rate matter?
In an ideal world, we want the browser to be able to paint at 60 frames per second – in other words, a frame every 16.66ms. A Long Animation Frame takes longer than 50ms from its start to when it begins painting.
The Long Animation Frames (LoAF) API is a modern attempt to provide data on what's consuming the browser's processing time. It uses an animation frame-based approach rather than a task-based one.
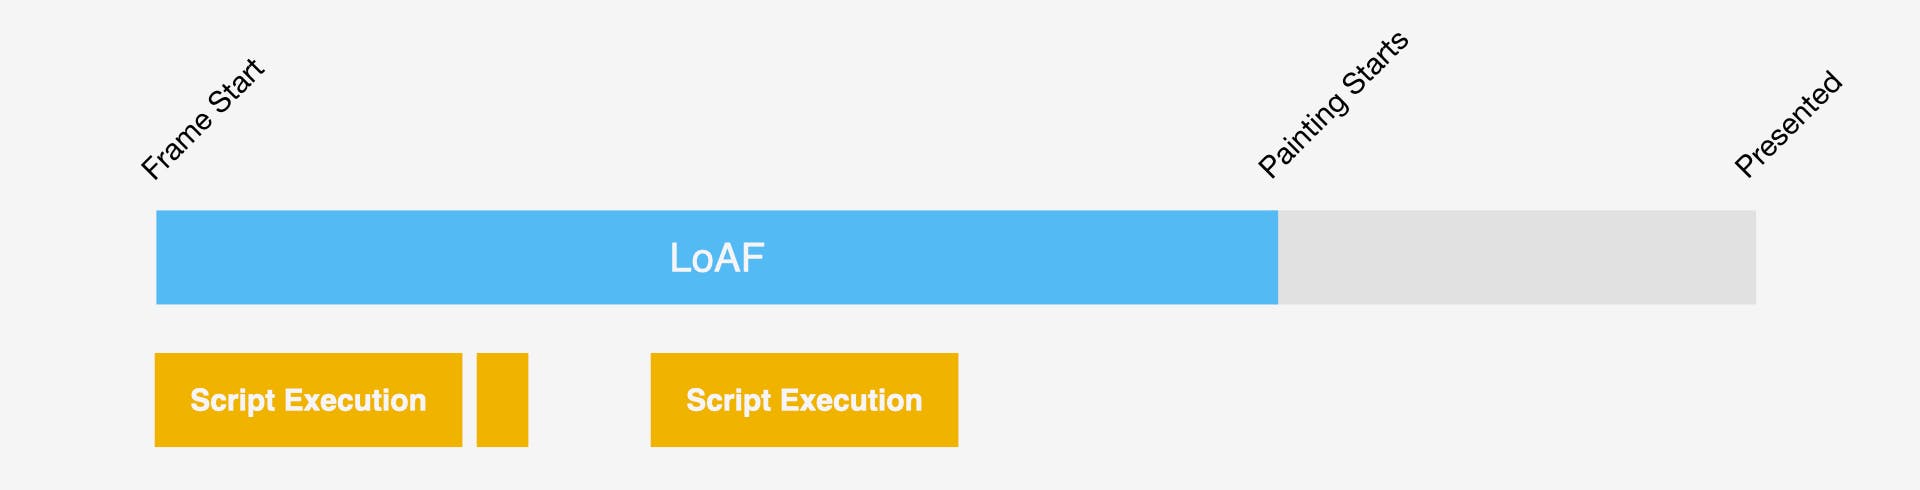
Anatomy of a LoAF
With the LoAF API, not only do we get data for each LoAF, we also get data on which scripts executed during the LoAF. We finally have a way to begin to understand the impact that the code we're shipping has on our visitors' experiences.
Long Animation Frame (LoAF)
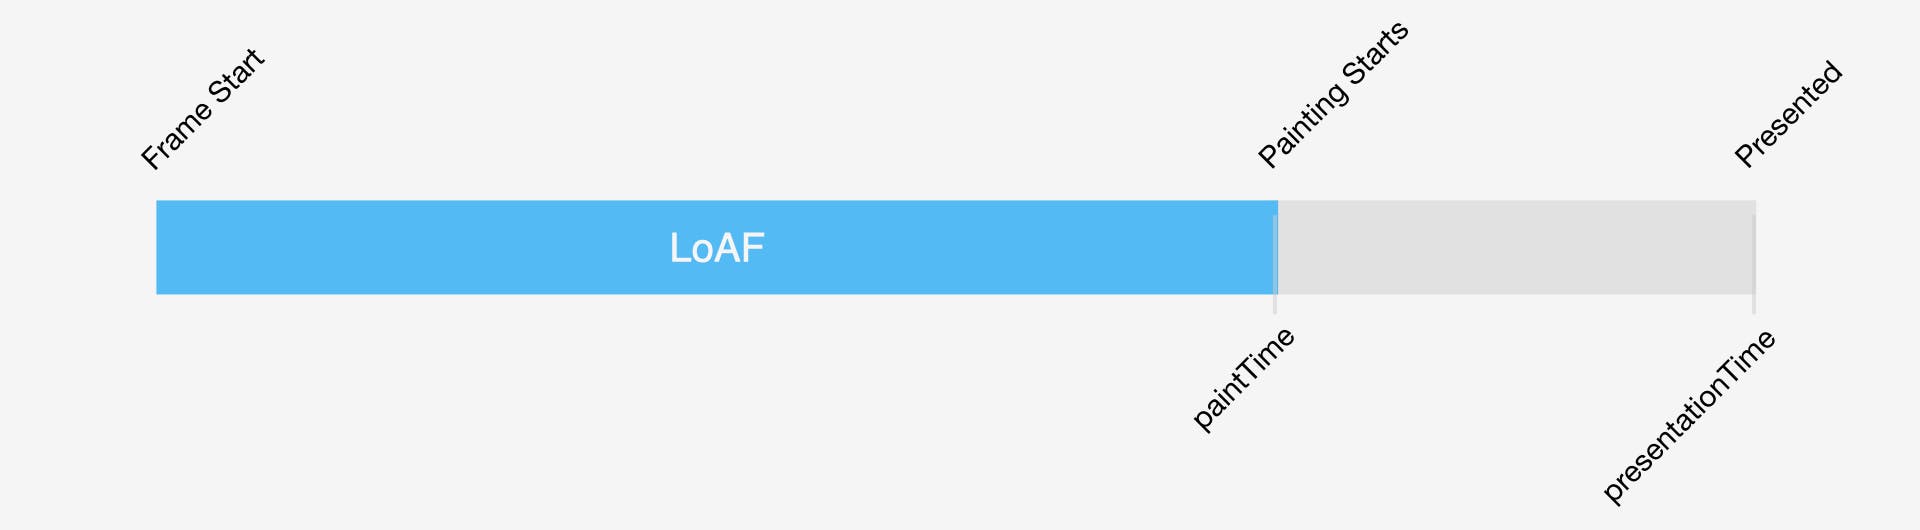
A LoAF measures from the point in time where a browser starts a new frame to the point where paint operations for that frame start.
It's important to note that the work to paint the frame, send it to the GPU, and finally show (present) it to the visitor are NOT included in the LoAF, as shown below.
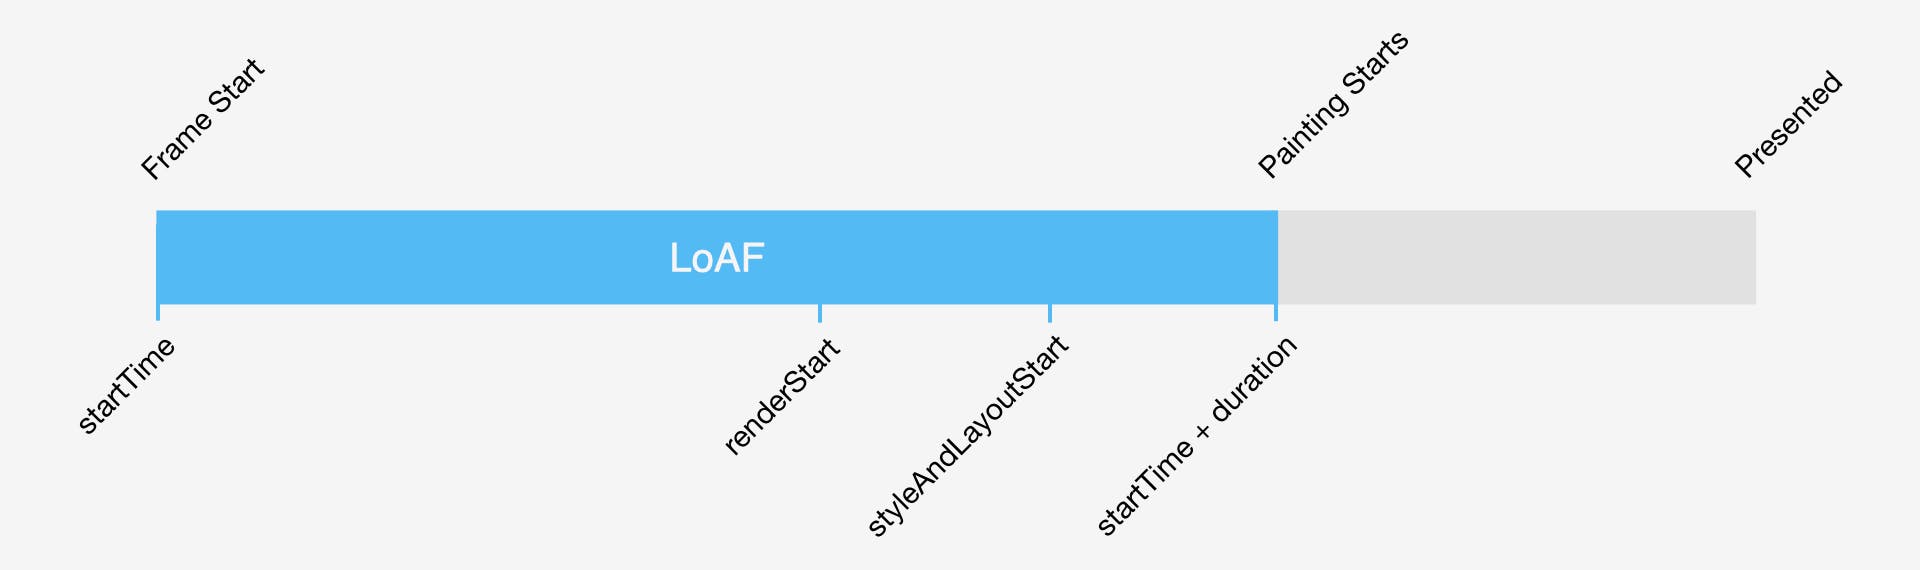
Relationship between a Long Animation Frame and how frames are presented to the visitor
More things to note:
- LoAF entries are only created for visible pages.
- A LoAF may have zero, one, or more scripts associated with it.
- A LoAF may or may not correspond with an interaction.
Script Timing
Script Timing gives you details of a script that executed for longer than 5ms during a Long Animation Frame. Timing information isn't available for all script tasks. For example, there's no data exposed for extension scripts and garbage collection.
Long Task
A Long Task API entry is generated for main-thread activities that are longer than 50ms. They are generated for hidden and visible pages. There's no direct way to link them to a LoAF.
What does a LoAF entry look like?
A LoAF entry contains some metadata and a mixture of timestamps and durations. It also includes an array of Script Timing entries for any scripts that executed for longer than 5ms during the LoAF.
{
    "name": "long-animation-frame",
    "entryType": "long-animation-frame",
    "navigationId": "508afc4b-f812-456f-a22a-4938478e4e1b",
    "startTime": 2899,
    "duration": 143,
    "renderStart": 3035,
    "styleAndLayoutStart": 3035.4000000059605,
    "paintTime": 3042,
    "presentationTime": 3044,
    "firstUIEventTimestamp": 0,
    "blockingDuration": 87.524,
    "scripts": [
        // Array of PerformanceScriptTiming Entries
    ]
}
Key LoAF milestones
There are several key milestones within a Long Animation Frame:
startTime
Start of the frame.
renderStart
Start of the rendering process. Sometimes the Style and Layout phase starts at the same time as rendering, but this is the point where requestAnimationFrame handlers, ResizeObservers, etc. execute, so they may delay the start of the style and layout phase.
styleAndLayoutStart
When the browser starts the final style and layout operations for the frame. This might not be the only style and layout work in the frame – for example a script might force style and layout by querying the size or styles of an element or a browser may sometimes choose to recalculate them mid-frame.
endTime
The point in time when the browser starts paint tasks for the frame. Calculated as startTime + duration.
Key milestones during a Long Animation Frame
What can we do with this milestone data?
With just this data we can begin to get an understanding of how a page is performing. We can:
- Count how many LoAFs there were
- Calculate their total time
- Identify the longest LoAF
- Get an indication of how much time is spent in style and layout tasks
If you're familiar with DevTools profiling, LoAF maps onto the main thread activities something like this simplified visualisation:
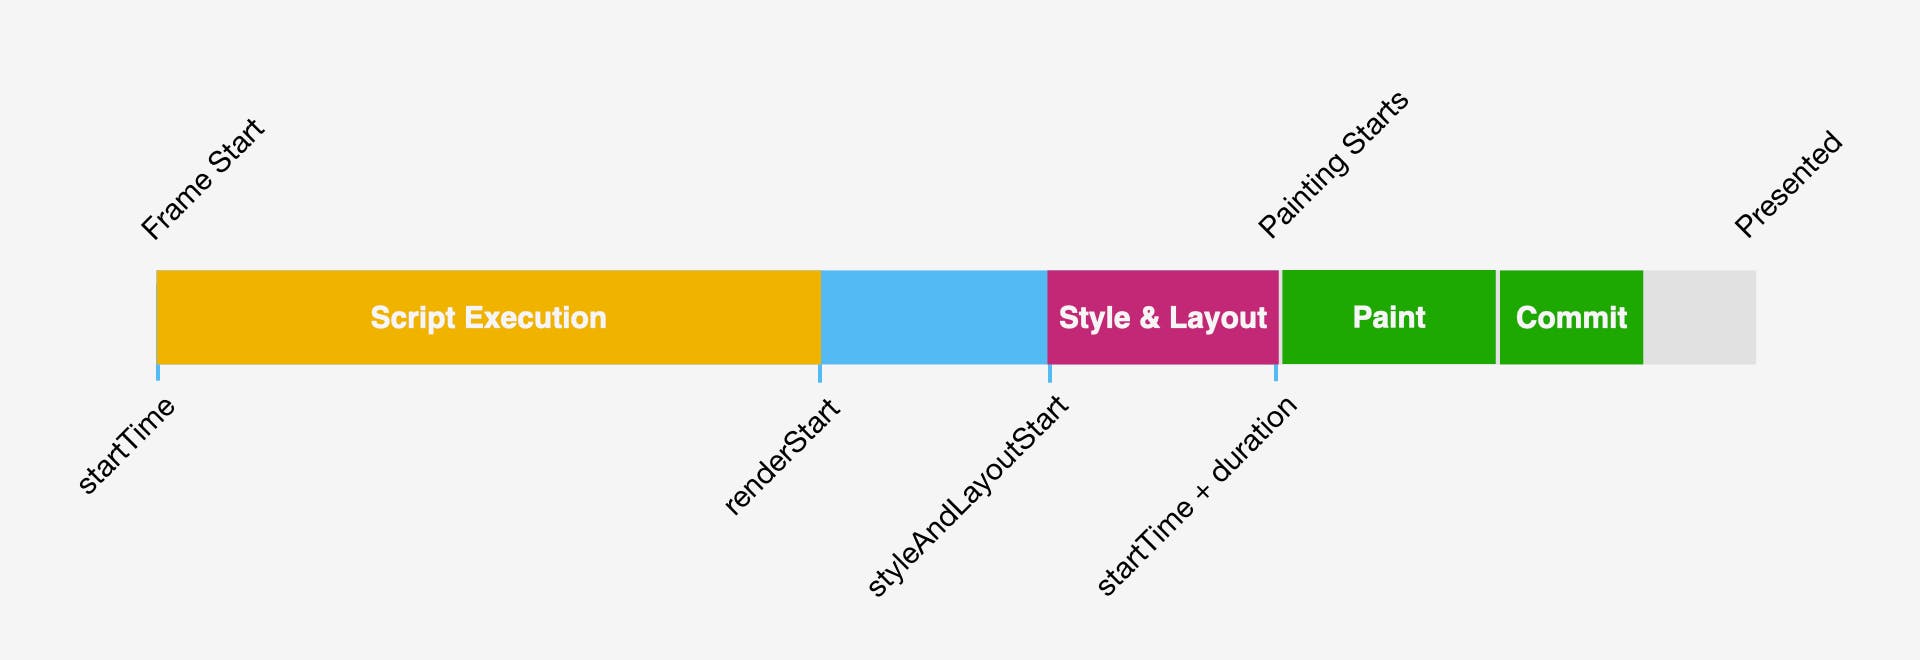
LoAF milestones vs main thread activity
I used Chrome Canary – which has the experimental PaintTimingMixin enabled – to generate the JSON example above. This mixin adds two more timestamps to the LoAF entry:
paintTime
When the browser starts paint operations for the frame.
presentationTime
When the frame is actually displayed to the visitor.
Although these timestamps are part of the LoAF entry, they occur after the end of the LoAF, i.e. startTime + duration < paintTime < presentationTime
Timestamps added by the PaintTimingMixin
If the frame wasn't painted or presented, then both these timestamps will be zero.
Some browsers can't capture a presentationTime, as the work of displaying the frame is handed off to the operating system and paintTime is aimed to provide a interoperable timestamp across browsers.
Finally there are two other time related properties included in the LoAF entry:
blockingDuration
The length of time the browser could not respond quickly to a visitor’s interactions (taps, clicks, or keypresses).
firstUIEventTimestamp
If the visitor interacted with the page and the event was handled within this LoAF, then the timestamp will be non-zero and will be before the startTime for this LoAF.
Summarising LoAFs
Much of the focus on LoAF has been around scripts. Understanding which scripts contribute to slow interactions – but summarising the higher level data – can provide an overview of our runtime costs.
Some examples of summary metrics I've experimented with:
- Count of LoAFs – How many frames were delayed by longer than 50ms?
- Total LoAF Duration – What was the total time of all Long Animation Frames?
- Total Blocking Duration – What was the total length of time the browser could not respond quickly to a visitor’s interactions, for example, taps, clicks or keypresses?
- Longest LoAF Duration – If a visitor tries to interact with the page during a LoAF, then their interaction won't be handled until the frame is presented. Measuring the longest LoAF might indicate how bad INP could potentially be. There's normally at least one LoAF entry before First Contentful Paint (FCP). As visitors are less likely to interact before content is shown, any LoAFs that occur before FCP should probably be excluded from this metric.
Script attribution
If a script executes for longer than 5ms within a LoAF, then a PerformanceScriptTiming entry is generated.
Relationship between LoAF and Script Timing entries
Script attribution is probably the part of LoAF that has attracted the most interest. We can finally measure which scripts are slow and when they execute. Using this data, we can begin to understand what proportion of any script performance issues are due to third-party tags and what's due to our own code.
(Spoiler: For many of the sites I've looked at, the first party code is often as big a source of problems as the third-party code.)
A typical Script Timing entry might look like this:
{
    "name": "script",
    "entryType": "script",
    "navigationId": "13b594a2-ca64-4812-ae67-139617da01fb",
    "windowAttribution": "self",
    "startTime": 4286.5,
    "duration": 319,
    "executionStart": 4370.29999999702,
    "forcedStyleAndLayoutDuration": 0,
    "pauseDuration": 0,
    "invoker": "https://example.com/assets/vendor/jquery/jquery.min.js?v=3.7.1",
    "invokerType": "classic-script",
    "sourceURL": "https://example.com/assets/vendor/jquery/jquery.min.js?v=3.7.1",
    "sourceFunctionName": "",
    "sourceCharPosition": 0
}
Timing
startTime
When the script was invoked.
duration
How long the script execution took.
executionStart
A script might not execute immediately. For example, a classic script might need to be compiled before it can be executed, in which case executionStart might be later than startTime. Due to security and privacy concerns, compilation time isn't exposed for third-party scripts and executionStart will be the same as startTime.
forcedStyleAndLayoutDuration
If a script queries the size, position or CSS properties of an element then the browser may need to recalculate these before it can return the data.
pauseDuration
How long a script was paused while a synchronous operation took place, e.g., showing an alert box, or making a synchronous XHR call
Invoker
invoker
In the case of a classic script or a module, this will be the URL of the script. If the execution was triggered by an event handler, then it will be the event handler type combined with the element the handler was attached to, e.g. BODY.onclick
invokerType
Why the script was executed. This should be one of classic-script, module-script, event-listener, user-callback, resolve-promise, reject-promise.
Script details
sourceURL
URL of the script source file. This can be overridden using the //# sourceURL= directive, which can be useful if the script names are hashed. Inline scripts are attributed to the HTML page they are in, but they can also be explicitly named using the //# sourceURL= directive. For example, the entry generated by the snippet below would be have a sourceURL of "Use-the-sourceURL-Luke".
document.body.addEventListener("click", function() {
      for (var a = Date.now() + 2E3; Date.now(););
});
//# sourceURL=Use-the-sourceURL-Luke
sourceFunctionName
Name of the top level function that executed, i.e., the entry point of the script. This is often empty. Even when it's populated it's commonly a minified function name, so I've not found it that useful.
sourceCharPosition
Character position of the script entry point within the source file.
Why script details might be unavailable
Sometimes details of the script that executed aren't available. This can be for privacy reasons and/or due to gaps in the API that have yet to be closed.
From a privacy perspective, browser extensions often install content scripts. These scripts execute within the context of our pages. Although they may cause performance problems, we have no right to know what our visitors have installed. Hopefully we can get opaque attribution for these, so at least we'll know an extension script was the source of the issue.
Inline handlers injected by third parties, such at Google Tag Manager, are also a common source of missing attribution.
Summarising script data
There are multiple ways to summarise the Script Timing data.
In the table below I've grouped the data by scriptURL and summed the durations. (Alternatively, it could also be grouped by eTLD + 1 to distinguish first- versus third-party domains or by invokerType to understand what's triggering the scripts.)
Summarising the entries while the page loads can help to quickly identify that, in this case, most of the long scripts are first party ones and so within the site owner's control.
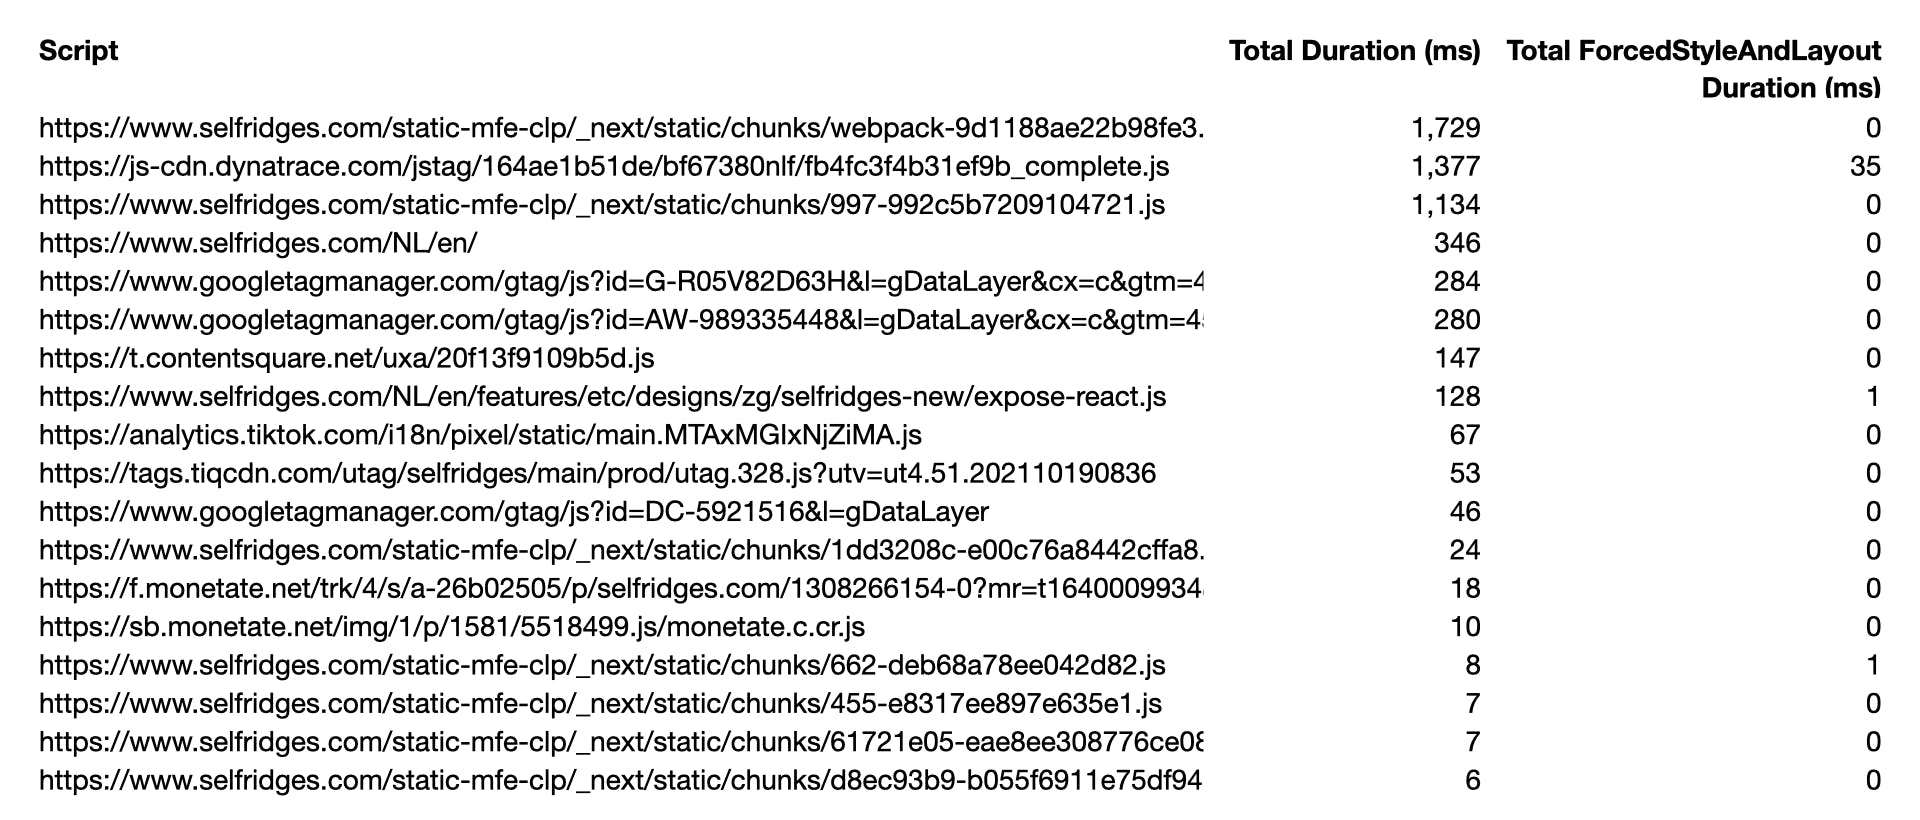
Summary of script execution on Selfridges (captured at 6x CPU slowdown)
The summary could be refined further to focus on just the scripts that executed before First Contentful Paint or Largest Contentful Paint.
The data could also be grouped by multiple dimensions, such as scriptURL and invoker. One thing to keep in mind is that, as data becomes more granular, it can be harder to see the patterns in it.
Matching script data to INP
We can also use LoAF data to understand which scripts were executed during Interaction to Next Paint (INP) and – perhaps more interesting – which scripts executed during which INP phase/sub-part.
There's no explicit link between the Event Timing entries that are used to calculate INP and any corresponding LoAF entries, so they need to be matched using timestamps.
In the diagram below, there are three LoAF entries that overlap with INP:
- A frame was already in progress when the visitor interacted and the browser needs to complete this frame before the interaction can be handled.
- The visitor's interaction is handled in this frame.
- Once the current frame has been sent to the GPU for presentation, the browser's main thread is free to start the next frame. This LoAF is actually generated by the next frame.
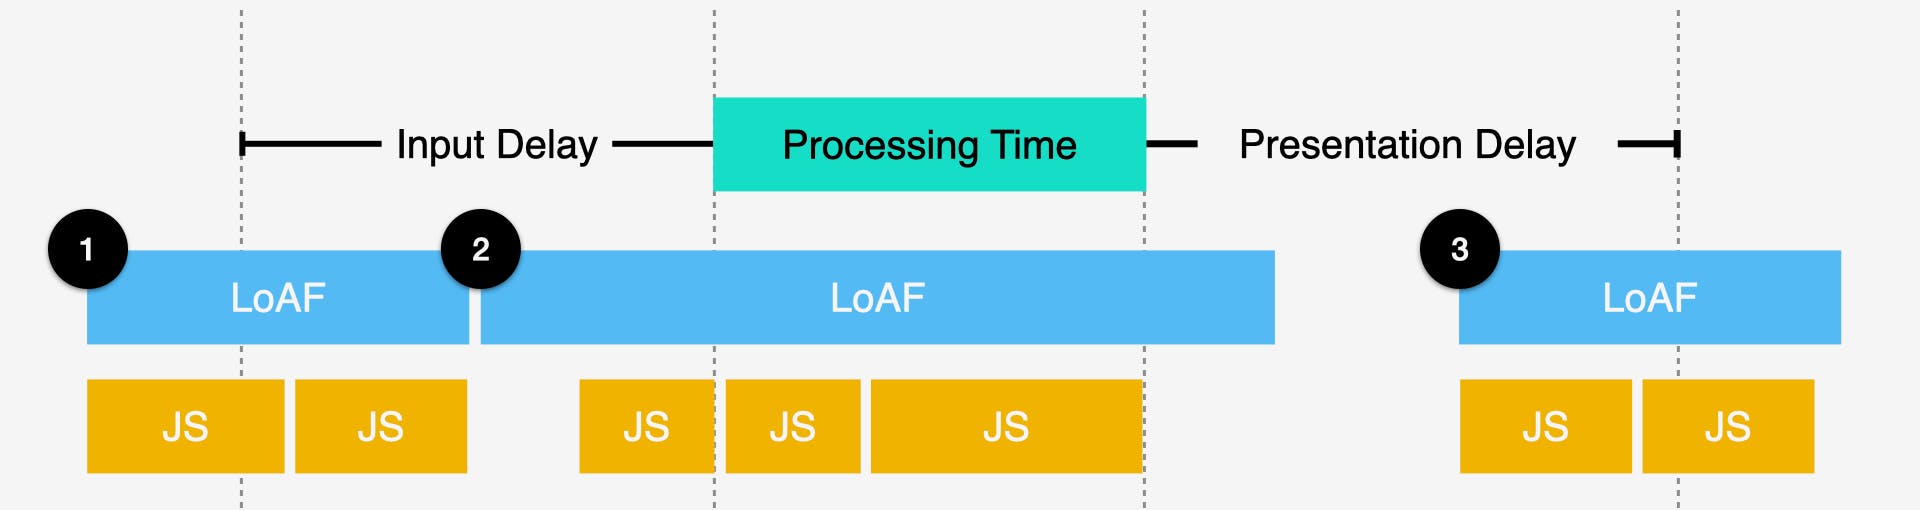
LoAFs overlapping with INP
We can follow this process to attribute the scripts, or parts of a script, to the different phrases of INP:
- When a LoAF overlaps with the start of an interaction, only the portion of the script that executes after the interaction is applicable to INP.
- If a LoAF wholly intersects with INP, then all the scripts executed are relevant to this INP.
- When a LoAF finishes after the INP presentation time, then it's the next frame, so the LoAF and its scripts can be discounted.
So in this example only the portions of JS coloured in dark gold are applicable to INP:
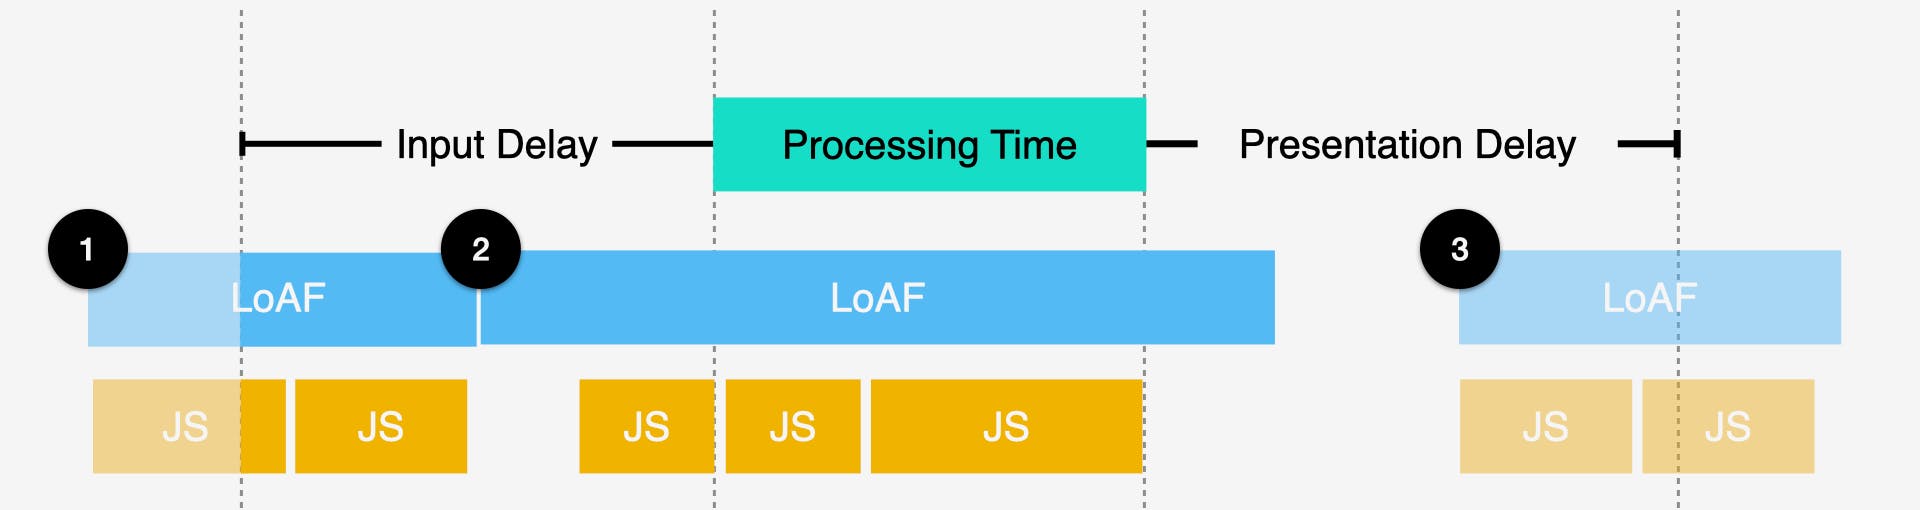
Attributing LoAF and Script Timing entries to INP phases / sub-parts
Once we've identified the relevant scripts and identified which phase of INP they belong to, we can summarise the data and use it to identify the common sources of Input Delay, Processing Time, or Presentation Delay.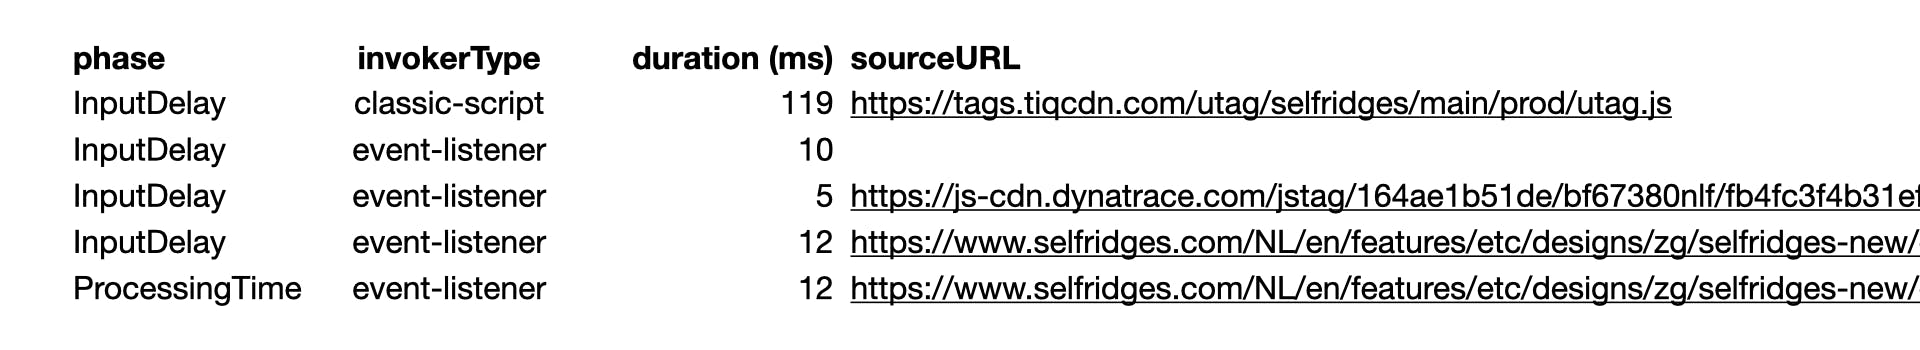
Breakdown of script execution by INP phase
There are at least two ways to calculate INP phases
The simplest approach uses Input Delay, Processing Time and Presentation Delay as calculated from the Event Timing entry that corresponds to INP.
The more complex method looks at all the Event Timing entries that end in the same frame and calculates the phases as follows:
- Input Delay = start of the first Event Timing entry to the earliest Processing Time across all entries
- Processing Time = start of the earliest Processing Time to the end of the latest Processing Time across all entries
- Presentation Delay = end of the latest Processing Time to end of the frame across all entries
Chrome and web-vitals.js use the second of these approaches.
How to capture LoAF entries
As with other performance APIs, LoAF entries can be captured in a couple of ways.
Indirectly, using PerformanceObserver
const observer = new PerformanceObserver((list) => {
  for (const entry of list.getEntries()) {
    console.log(entry);
  }
});
observer.observe({ type: "long-animation-frame", buffered: true });
Directly, by querying the Performance Timeline
console.log(performance.getEntriesByType("long-animation-frame"));The number of LoAF and ScriptTiming entries generated depends on how much work the page demands of the browser or the capabilities of the device being used. Pages that use more scripts or are visited by people who have slower devices will often generate more LoAF entries than pages with fewer scripts or those that are visited by people with faster devices.
Exploring LoAF in DevTools
Chrome DevTools doesn't currently visualise Long Animation Frame or Script Timing entries. LoAF can generate a lot of data and one of the challenges I faced was matching its data to my understanding of how browsers work and how this is visualised in the DevTools Performance panel.
To help close this gap, I created a Chrome extension (available on GitHub) that adds a Custom Track to the Performance panel. This visualises LoAF and any corresponding script entries alongside the usual main thread view.
To use it, you'll need to enable Developer Mode and load it as an unpacked extension. By default it injects a content script for all pages, so I tend to only install it in a separate Chrome profile.
This first example is for a fresh page load of Selfridges at 4x CPU slowdown:
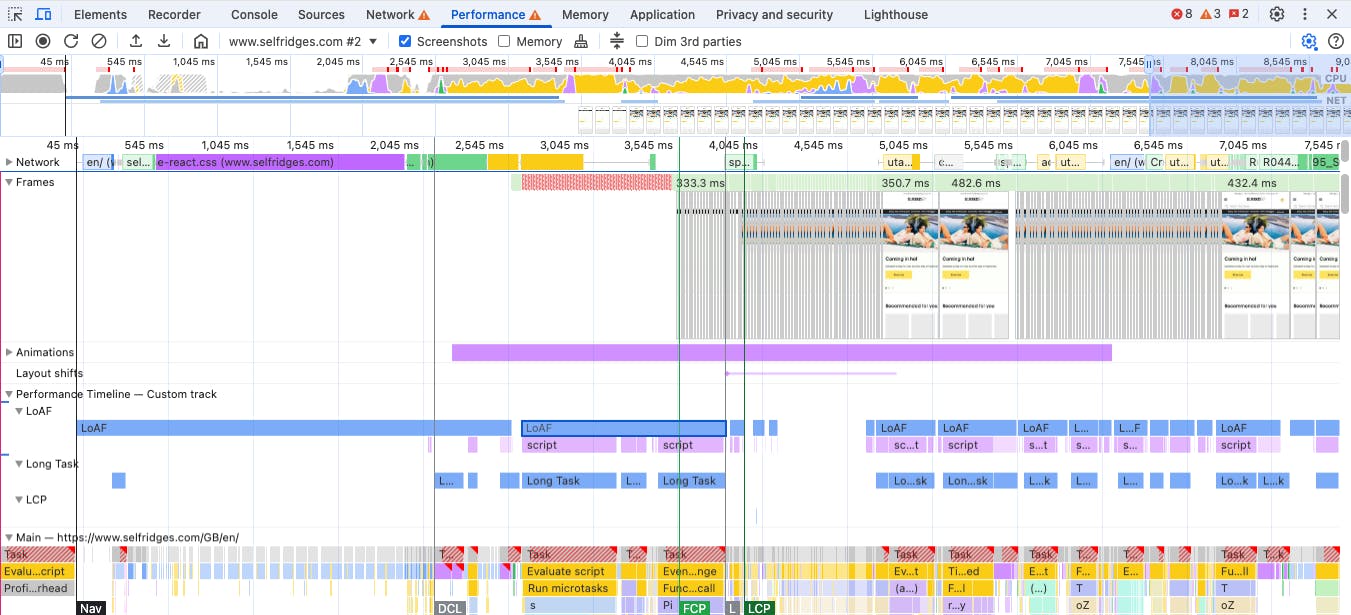
Example of custom performance track showing LoAF, Script Timing and Long Task Entries (view trace)
In this second example, I profiled opening the menu. The slow interaction is due to SnapChat's tag querying a DOM element. This can be seen in both the trace and the LoAF data. By collecting LoAF data from visitors using RUM, Selfridges would be able to identify how commonly SnapChat contributes to INP.
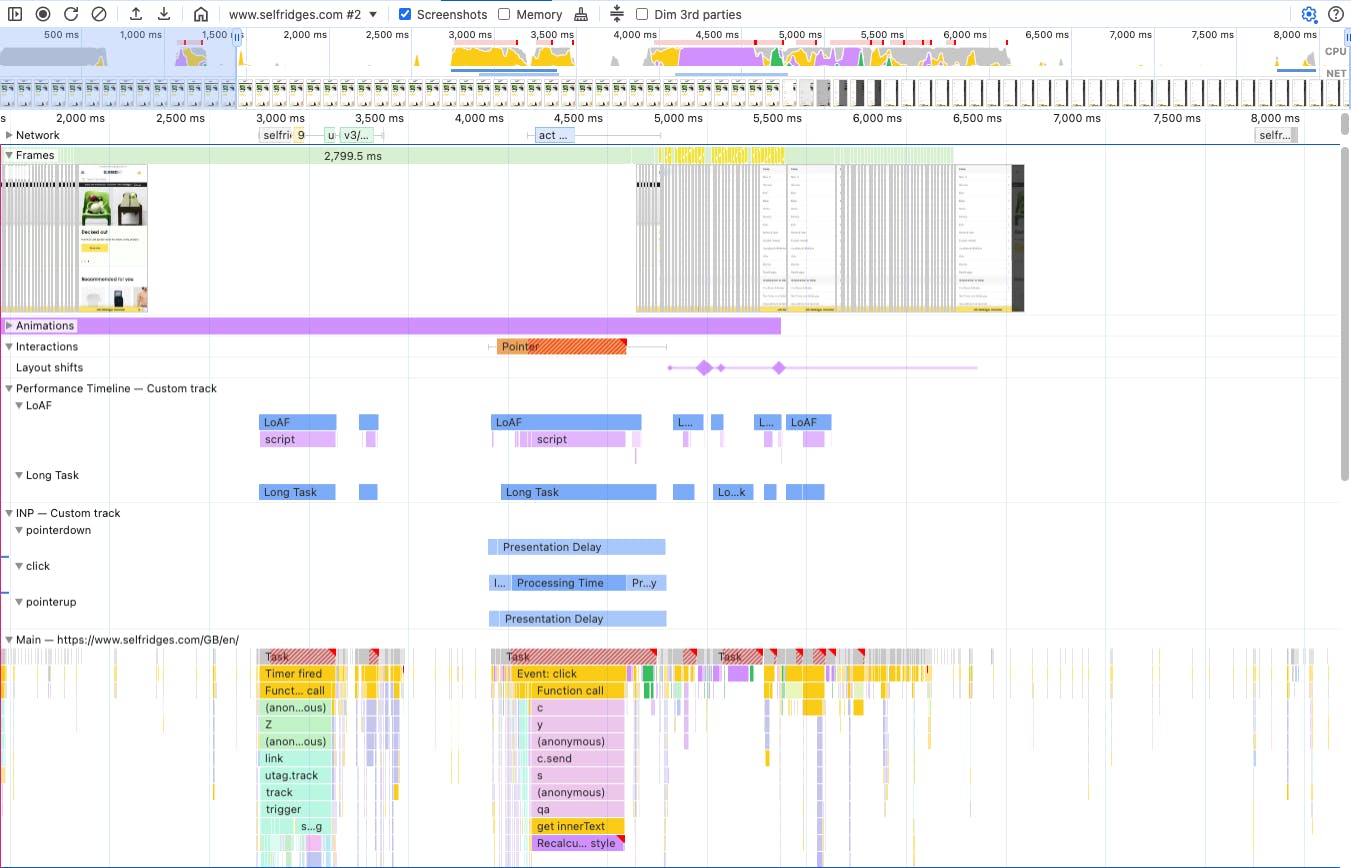
Example of LoAF and Script Timing entries created during an interaction (view trace)
Using the extension, it's also possible to see the gaps in the LoAF API – the impact of Garbage Collection or Extension scripts – and visualise where the Long Tasks API differs from LoAF. It's also helped me find a couple of Chrome bugs.
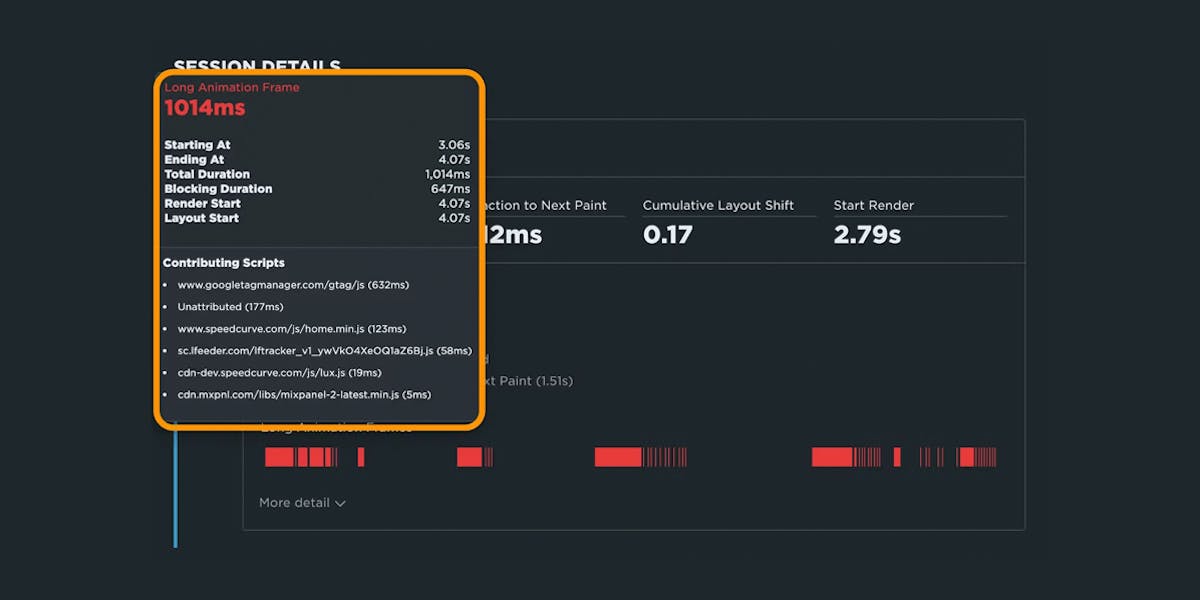
Getting started with LoAF
We've captured and exposed Long Tasks in SpeedCurve RUM for many years. One of the most common questions we've had from customers is "Can you tell me what causes these Long Tasks?"
Finally, thanks to the Long Animation Frames API, we can say: Yes! SpeedCurve now supports monitoring LoAFs and drilling down into attributions.
LoAF allows us to understand how scripts and other tasks affect both hard and soft navigations, as well as how scripts affect interactions. Using the data it provides, we can identify problem scripts and target changes that improve our visitors' experience. We can also finally start to quantify the impact of third-party scripts as they execute in our visitor browsers.
A free trial of SpeedCurve RUM will allow you to start to measure how scripts are affecting your visitors' experience. It will also help you track changes to Core Web Vitals and visitor behaviour as you make code improvements.
If you have any questions or comments about this post, you can find me on Bluesky.
I'd also like to say a very big thank you to Barry Pollard, Noam Rosenthal and Michal Mocny for their patient answers to my many questions about LoAF.