An update on the recent JavaScript error tracking outage

During a deployment at 08:00 pm on 7 May 2026 (UTC), SpeedCurve RUM JavaScript error tracking had an outage that lasted for 5 days, until 08:00 pm on 12 May. The outage caused the complete loss of JavaScript error details recorded by SpeedCurve's RUM script, lux.js. Total error count was recorded correctly, but the details of those errors were lost.
Unfortunately our automated monitoring did not alert us to this outage. We were only alerted after reports of missing data from SpeedCurve customers. Once the initial report was received, we were able to identify and fix the issue within a few minutes. We then performed an investigation to discover the root cause, and put together a timeline of events.
The impact on your data
JavaScript error tracking is done in two parts: counting the number of errors on a page, and sending the full details of a small sample of those errors (up to 5 per page). The first part of this tracking was not affected, so the total number of errors shown in your dashboards remains correct*. The second part is what was affected: error message, filename, line, and column were all lost during the outage.
*One exception is when filtering to a specific error message.
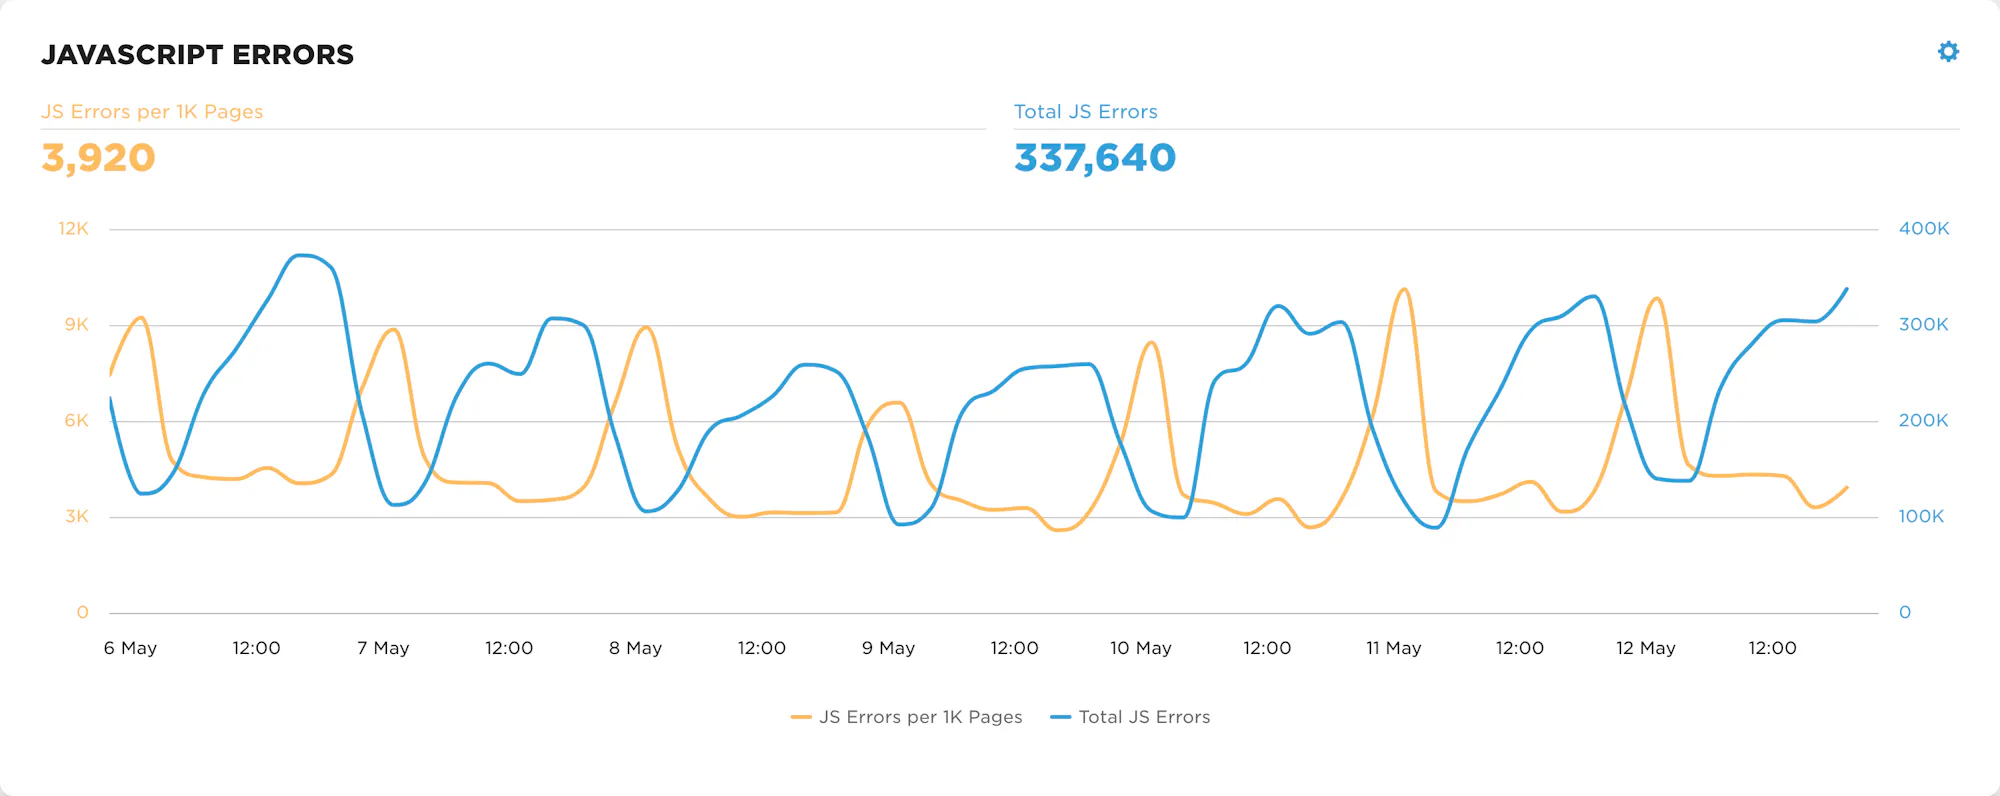
This chart shows JavaScript error count during the outage period, with the total count unaffected by the outage.
The timeline
- On 4 May we deployed and tested an update to the staging environment of our JS error tracking pipeline. This update included a new endpoint for receiving JS error beacons, and a new version of our RUM script (lux.js v4.5) that sends JS error beacons to the new endpoint.
- On 7 May at around 08:00 pm (UTC) we deployed lux.js v4.5 to our production environment, but did not deploy the new endpoint. This meant that any JS error details generated by lux.js v4.5 were sent to an endpoint that did not exist, resulting in a 404 response code and the error details being lost.
- On 7 May at 10:00 pm the majority of RUM traffic was using the new version of lux.js. Around this time, our monitoring alerted us that the number of JS errors in our ingest pipeline had dropped to zero. We spot-checked this alert against SpeedCurve's internal "dogfooding" account and determined it to be a monitoring issue.
- The monitoring system was patched and the number of JS errors returned to a non-zero value. This value was significantly lower than before however this was falsely attributed to a monitoring system quirk.
- On 11 May at 10:00 am, SpeedCurve received a report that JS error details were missing. This report was not forwarded to the engineering team until 07:00 pm on 12 May, at which point is was triaged as a P0 (urgent priority) incident.
- On 12 May at 07:00 pm engineering identified the root cause as the endpoint not being deployed, causing JS error details to be dropped. The endpoint was deployed within several minutes.
- At 7:20 pm the issue was confirmed as fixed.
What went wrong
Ultimately the root cause of this outage was human error, however there were gaps in our processes and monitoring systems that allowed it to go unnoticed for so long. The release process for the affected systems is nontrivial and entirely manual. In the past we have been able to rely on our monitoring to alert us of issues post-release. In this case our monitoring coverage was not sufficient.
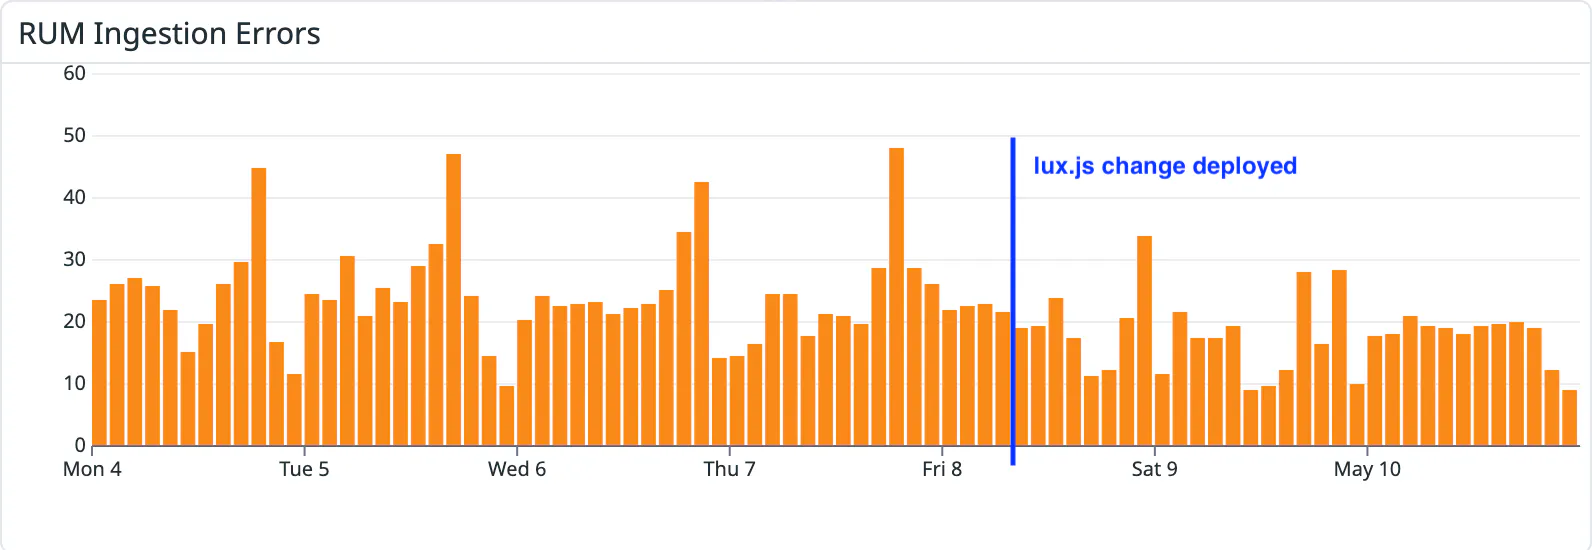
This chart shows the number of errors from our RUM beacon endpoints. This metric did not increase during the outage, preventing any alerts from being issued.
The relevant part of our monitoring is a metric that tracks the number of errors in our RUM beacon endpoints. This metric is pushed to our monitoring service by Fastly, and for reasons unclear, this metric did not increase during the outage. This is shown in the chart above, which exhibited normal error rates during the entirety of the outage.
The alert that was triggered in event (3) of the timeline above was a strong signal that something was wrong. However because we used our internal dogfooding account for spot-checking, we were led to the half-baked conclusion that this was a monitoring issue and not a genuine data issue. While there was a monitoring issue, we mistakenly believed the issue was solved once we saw our internal data flow into the monitoring system. In reality, this data was coming from our staging environment only. This obscured the fact that no production data was flowing into the system.
And finally, there was a 35 hour delay between the issue first being reported and the report making its way to our engineering team. This delay did not directly contribute to the issue but did unnecessarily extend the outage.
Going forward
We're making some changes to avoid issues like this in the future: we'll expand our monitoring to cover many more types of potential issues, we'll improve our spot-checking so that both staging and production data is validated, and we'll onboard more engineers to support these systems.
We'd like to thank the users who reported this issue to support@speedcurve.com, and we're grateful for all of your feedback and patience.